1923
Macromolecular proton fraction as a marker of myelin recovery in ischemic stroke1Tomsk State University, Tomsk, Russian Federation, 2Pirogov Russian National Research Medical University, Moscow, Russian Federation, 3University of Washington, Seattle, WA, United States
Synopsis
The study, performed on a rat model of ischemic stroke, aimed to evaluate a recently proposed myelin biomarker, macromolecular proton fraction (MPF) as a non-invasive tool for monitoring recovery after stroke. Longitudinal observations showed the different time courses of MPF evolution in the infarct zones undergoing subsequent demyelination (DZ) or remyelination (RZ). After a sharp decrease at days 1-5 after MCAO, MPF showed a further decline in the DZ and a restoration in the RZ to day 56. These findings were confirmed by histology which showed similar tissue evolution zones and enhancement of neurogenesis and oligodendrogenesis in the ischemic core.
Introduction
In addition to neuronal death, ischemic stroke causes extensive demyelination in the lesion. Enhancement of post-ischemic endogenous neurogenesis and oligodendrogenesis is considered as a potential target for brain recovery. A recently developed quantitative MRI method, fast macromolecular proton fraction (MPF) mapping, has been used to quantify myelination. This method showed a promise as a biomarker of myelin in human and animal studies1-12, including the animal model of stroke12.Purpose
The study aimed to evaluate MPF mapping as a non-invasive biomarker of myelin recovery after stroke.Methods
Animal procedures and immunochemistry. Six adult male Wistar rats underwent surgery with 1.5 hour transient occlusion of the middle cerebral artery (MCAO) followed by reperfusion. MRI scanning was performed before and at days 3, 5, 7, 14, 21, 31, 42, and 56 after surgery. At days 7, 21 and 56 after surgery animals were trancardially perfused with 4% phosphate buffer solution, their brains were removed and frozen for histological processing. Coronal 10 µm sections were stained with GFAP (astrocytes), MBP (myelin), LFB (myelin), NeuN (mature neurons), DCX (immature neurons) and NG2 (oligodendrocyte precursors).Image Acquisition. The rats were imaged on a 7 T small animal MRI scanner (ClinScan, Bruker, Germany). A fast high-resolution 3D MPF mapping protocol included the following sequences: MT-weighted spoiled GRE imaging (TR=29 ms, TE=2 ms, FA=9°, BW=129 kHz, off-resonance Gaussian pulse saturation with duration of 10 ms and offset frequency of 1.8kHz, effective FA = 500°); T1-weighted spoiled GRE imaging (TR=16 ms, TE=2 ms, FA=16°); proton-density-weighted spoiled GRE imaging (TR=16 ms, TE=2 ms, FA=3°). Acquisition time of the protocol was 26 min. 3D MPF maps were reconstructed using the single-point synthetic-reference method1-3, which requires three source images for MPF calculation (MT-, PD-, and T1-weighted). Additionally, T2 and ADC mapping was performed.
Image Analysis. MPF maps and microphotographs of stained sections were analyzed in the ischemic lesion typically located in the caudoputamen and a symmetric region of the contralateral hemisphere. The borders of the affected area in the ipsilateral hemisphere were determined according to the T2 –weighted images obtained at day 1 after surgery. Inside the affected area of the caudoputamen, the zones with different dynamics of MPF were analyzed separately. Regions-of-interest (ROIs) of a standard size and shape were manually placed on MPF maps and quantified using the procedure modified from that described previously11. Similar brain locations were chosen for quantification of ADC maps and microphotographs of stained brain sections. Neurogenesis and oligodendrogenesis were evaluated as the density of DCX+ and NG2+ cells correspondingly in the same brain locations. MPF and ADC values, as well as the density of DCX+ and NG2+ cells were compared between symmetrical regions of the ipsilateral and contralateral hemispheres using paired t-test.
Results
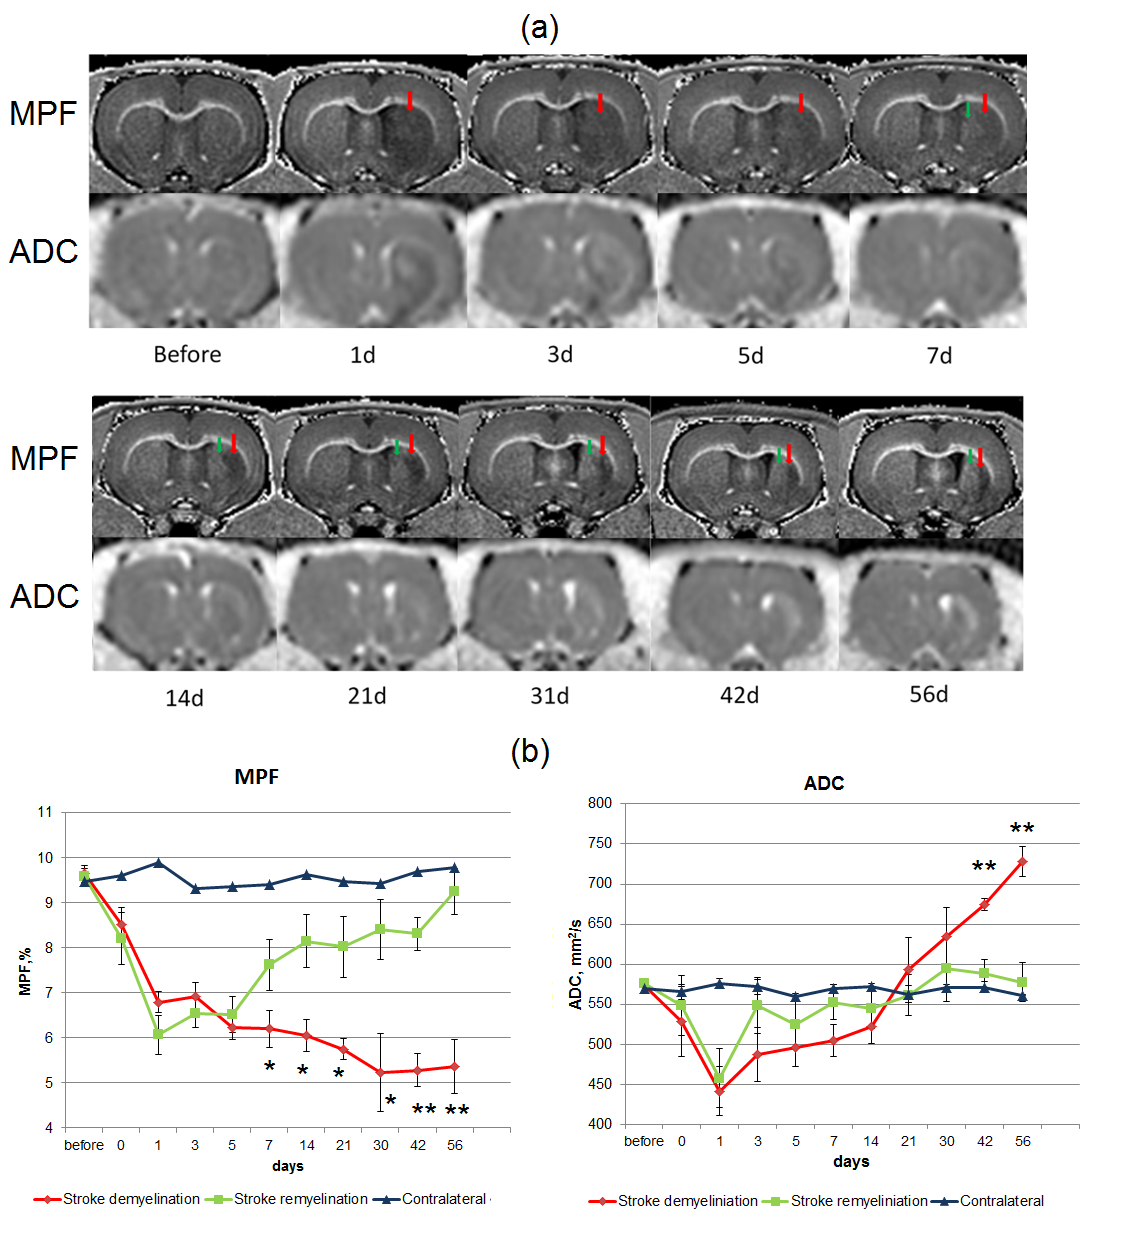
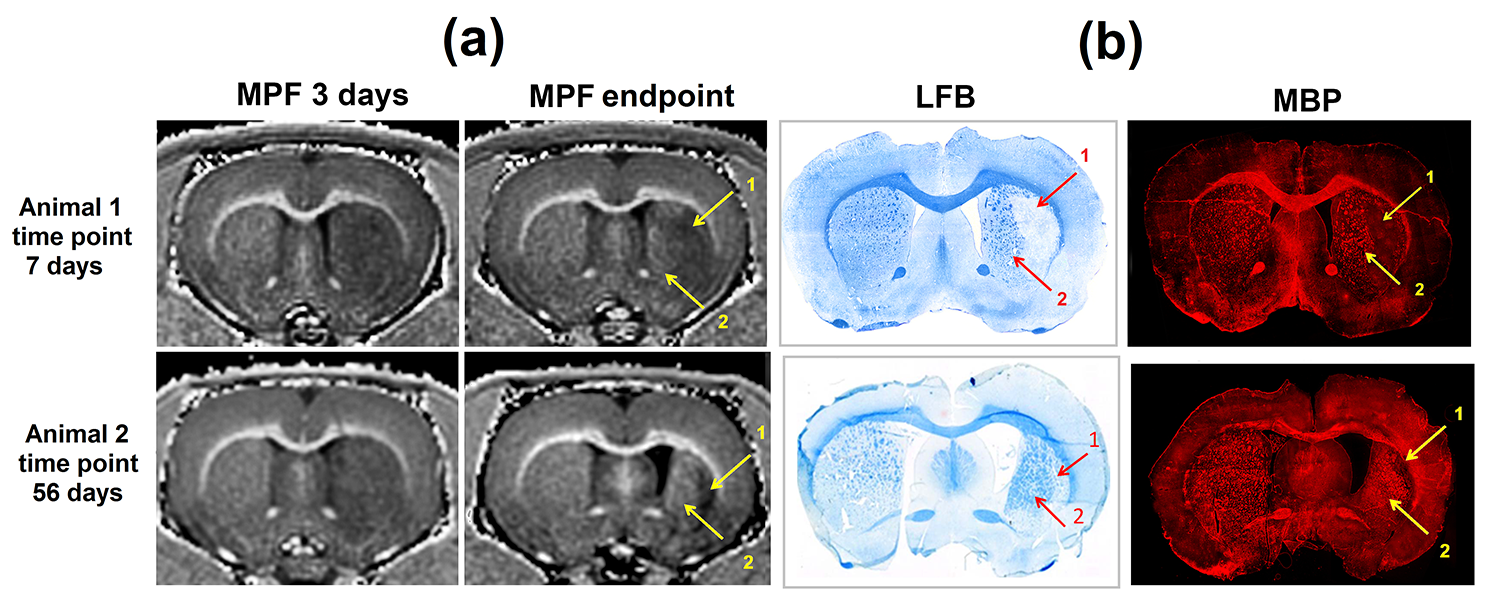
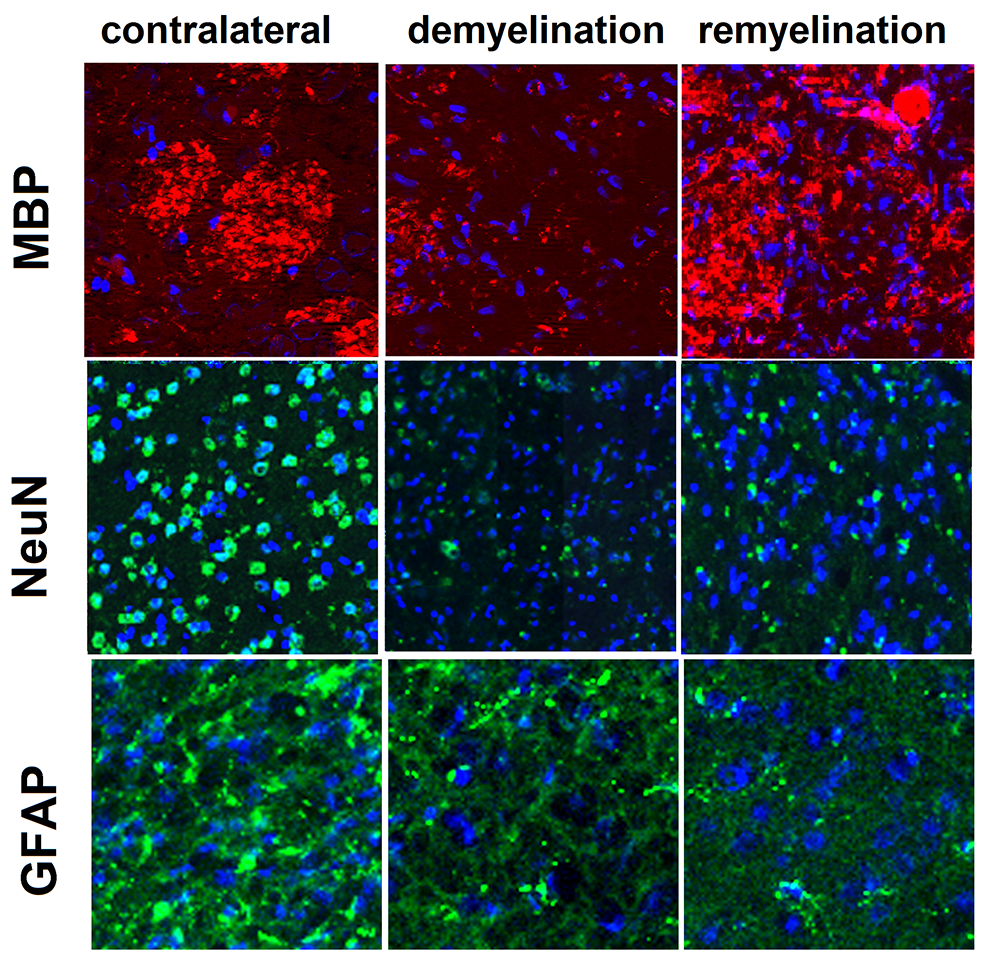
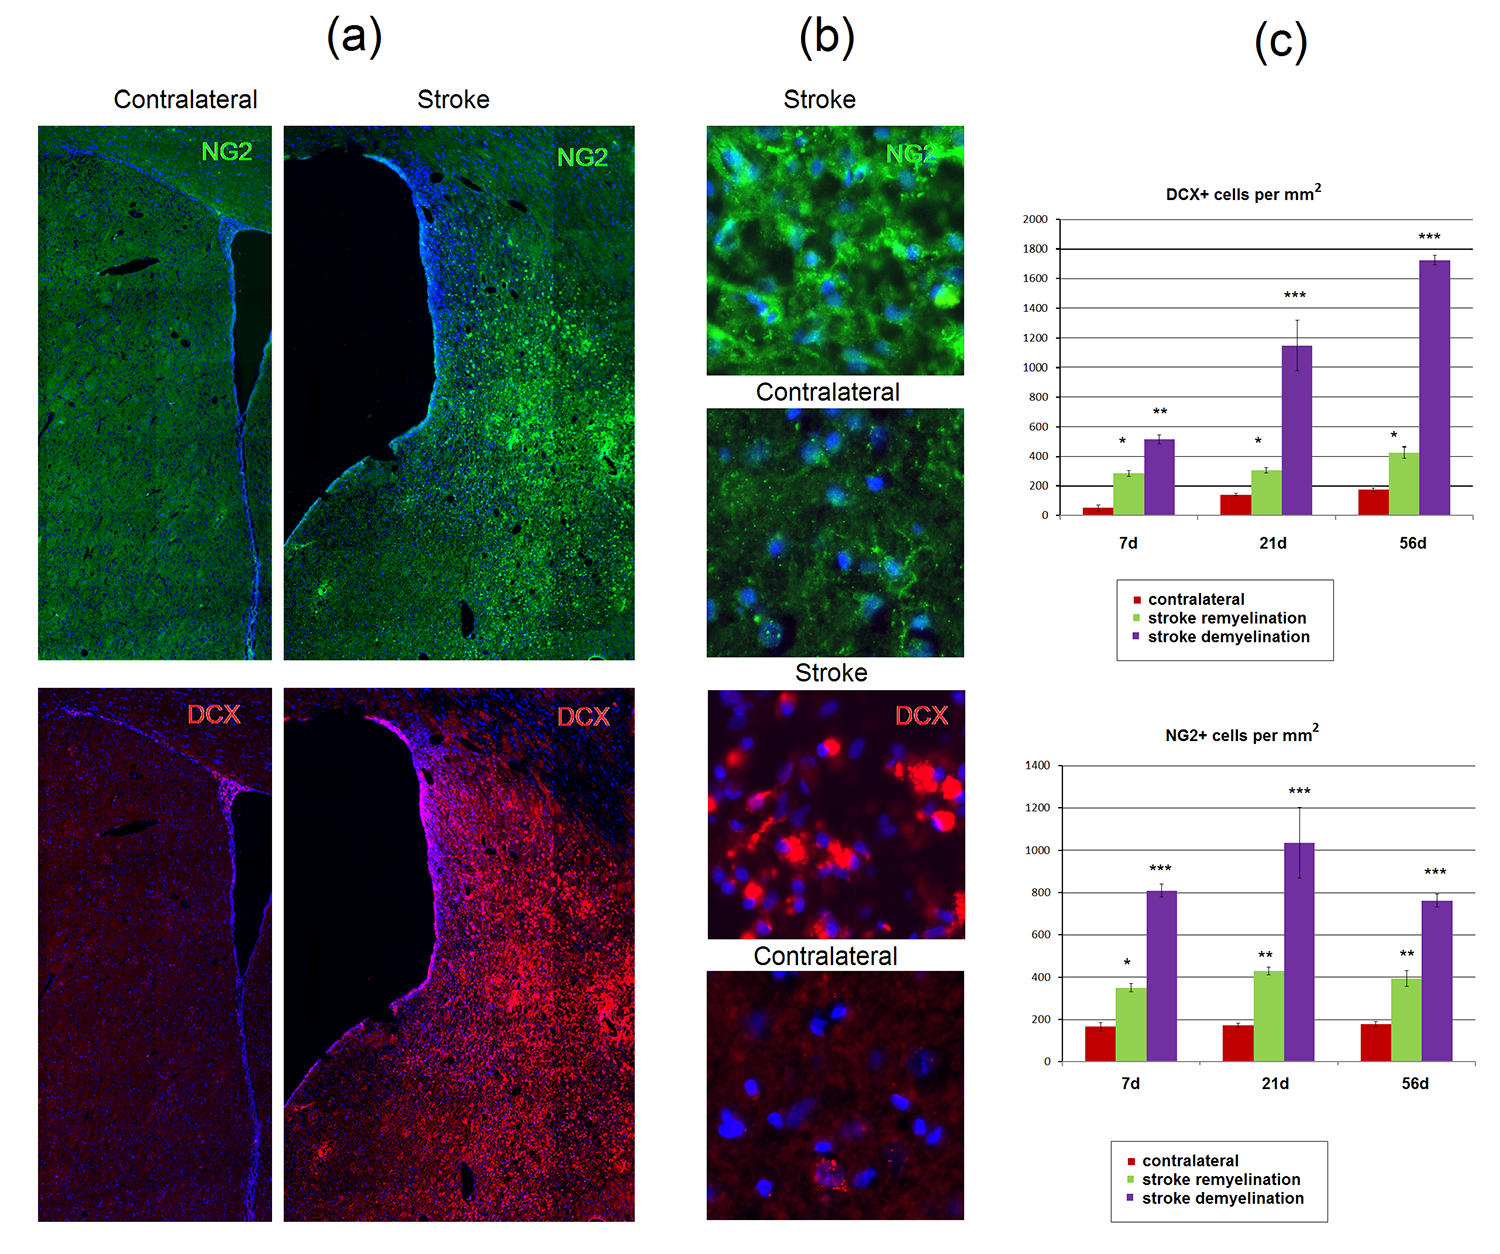
The dynamics of MPF and ADC changes is presented in fig. 1. MRF values in the ischemic core at days 1-5 sharply decreased up to 30-50% from baseline. At days 7-56 MPF values showed opposite changes in two distinct zones of the ischemic core. One zone showed subsequent decrease of MFP (demyelination zone, DZ), whereas other zone showed an increase of MPF almost up to the baseline level (remyelination zone, RZ). These differences in MPF became significant from the 7th day of observations. ADC values also differed in the DZ and RZ at later time points, at days 42 and 56. LFB and MBP labeling showed similar separation to zones of demyelination and remyelination, which corresponded to those in MPF maps, at days 21 and 56. Bundles of myelin fibers in the RZ of the ipsilateral hemisphere at days 21 and 56 were substantially reorganized as compared with the symmetrical zones of the contralateral hemisphere. Histological findings are shown in fig. 2-4.The presence of de- or remyelination was confirmed by LFB and MBP staining and corresponded to the borders of these zones on MPF maps (fig. 2). Reactive astrocytes that formed glial scar matched with the DZ at day 56 (fig. 2,3). Neuronal loss was 94% in DZ and 25% in RZ (fig. 4). A density of neuroblasts and oligodendrocyte precursors was increased significantly throughout the almost entire lesioned hemisphere from the subventricular zone to the DZ and RZ (fig. 4). The most prominent increase was observed in the DZ. A similar increase of neurogenesis and oligodendrogenesis is common for the MCAO model14,15 and confirms the presence of active restorative processes after MCAO.Conclusion
The key finding of this study was the discovery of the essentially different time courses of MPF evolution in the infarct zones undergoing subsequent demyelination or remyelination. The presence of de- or remyelination was confirmed by LFB and MBP staining. Observations at different time points confirmed active processes of neurogenesis and oligodendrogenesis after stroke in the MCAO model. The study reveals the feasibility of using MPF as a specific biomarker of demyelination and remyelination, which has a potential clinical significance for rehabilitation monitoring after stroke. In summary, the results of this study suggest that the neural tissue evolution after stroke (necrosis or repair) can be predicted from a short-term observation of MPF time course.Acknowledgements
Russian Science Foundation (project #18-15-00229), state assignment № 18.2583.2017/4.6.References
1. Yarnykh VL. Time-efficient, high-resolution, whole brain three-dimensional macromolecular proton fraction mapping. Magn. Reson. Med. 2016;75:2100–2106.
2. Naumova AV, et al. High-resolution three-dimensional macromolecular proton fraction mapping for quantitative neuroanatomical imaging of the rodent brain in ultra-high magnetic fields. Neuroimage. 2016; 10.1016/j.neuroimage.2016.09.036. [Epub ahead of print]
3. Yarnykh, V. L. et al. Fast whole-brain three-dimensional macromolecular proton fraction mapping in multiple sclerosis. Radiology 2015;274: 210–220.
4. Khodanovich MY et al. Histological validation of fast macromolecular proton fraction mapping as a quantitative myelin imaging method in the cuprizone demyelination model. Sci Rep. 2017; 7: 46686.
5. Odrobina EE, et al. MR properties of excised neural tissue following experimentally induced demyelination. NMR Biomed. 2005;18:277–284.
6. Schmierer K, et al. Quantitative magnetization transfer imaging in postmortem multiple sclerosis brain. J Magn Reson Imaging. 2007;26:41–51.
7. Rausch M, et al. Characterization of white matter damage in animal models of multiple sclerosis by magnetization transfer ratio and quantitative mapping of the apparent bound proton fraction f. Mult. Scler. 2009;15:16–27.
8. Ou X, et al. The MT pool size ratio and the DTI radial diffusivity may reflect the myelination in shiverer and control mice. NMR Biomed. 2009;22:480–487.
9. Ou X, et al. Quantitative magnetization transfer measured pool-size ratio reflects optic nerve myelin content in ex vivo mice. Magn Reson Med. 2009;61:364–371.
10. Janve VA, et al. The radial diffusivity and magnetization transfer pool size ratio are sensitive markers for demyelination in a rat model of type III multiple sclerosis (MS) lesions. Neuroimage. 2013;74:298–305.
11. Samsonov A, et al. Quantitative MR imaging of two-pool magnetization transfer model parameters in myelin mutant shaking pup. Neuroimage. 2012;62:1390–1398.
12. Thiessen JD, et al. Quantitative MRI and ultrastructural examination of the cuprizone mouse model of demyelination. NMR Biomed. 2013;26:1562–1581.
13. Turati L, et al. In vivo quantitative magnetization transfer imaging correlates with histology during de- and remyelination in cuprizone-treated mice. NMR Biomed. 2015;28:327–337.
14. Underhill HR, et al. Fast bound pool fraction imaging of the in vivo rat brain: Association with myelin content and validation in the C6 glioma model. Neuroimage. 2011;54:2052–2065.
15. Dula AN, et al. Multiexponential T2, magnetization transfer, and quantitative histology in white matter tracts of rat spinal cord. Magn Reson Med. 2010;63:902–909.
16. Khodanovich MY, et al. Quantitative assessment of demyelination in ischemic stroke in vivo using macromolecular proton fraction mapping. J. Cereb. Blood Flow Metab. 2018;38:919–931. 17. Khodanovich MY, et al.. Quantitative Imaging of White and Gray Matter Remyelination in the Cuprizone Demyelination Model Using the Macromolecular Proton Fraction Cells. 2019; 8:1204.
18. Lindvall O, Kokaia Z. Neurogenesis following Stroke Affecting the Adult Brain. Cold Spring Harb Perspect Biol. 2015; 7(11): a019034.
19. Zhang R, et al. Oligodendrogenesis after cerebral ischemia. Front. Cell. Neurosci. 2013:29.
Figures