1921
Long-term Structural Brain Changes in Adult Rats After Focal Ischemic Stroke1The Florey Institute of Neuroscience and Mental Health, Melbourne, Australia, 2The Melbourne Brain Centre Imaging Unit, The University of Melbourne, Melborne, Australia, 3Melbourne Neuropsychiatry Centre, The University of Melbourne, Melborne, Australia, 4Department of Neuroscience, Monash University, Melbourne, Australia
Synopsis
Accumulating clinical evidence suggests remote neurodegeneration occurs in non-ischemic brain regions distant to the site of infarction in stroke, driven by both axonal degeneration and global brain inflammation. Prior preclinical studies of remote degeneration have mainly focused on brain changes over a few days or weeks post-stroke. We investigated long-term structural brain changes in an endothelin-1 model of mild focal ischemic stroke in rats, using a clinically relevant period of 48-weeks. Serial structural and diffusion-weighted MRI data were used to assess dynamic volume and white matter trajectories. We found significant cortical atrophy and white matter alterations, suggesting widespread stroke-related degenerations.
Introduction
Ischemic stroke is a leading cause of death and disability. Secondary degeneration may contribute to stroke-induced cognitive impairment and dementia1, 2. Preclinical models are employed to investigate underlying mechanisms of remote neurodegeneration over time. Previous preclinical studies have reported altered hippocampal-thalamic networks3 and neuroinflammation4 up to 24-weeks post-stroke in middle cerebral artery occlusion-induced models, producing variably large focal strokes5. Local application of endothelin-1 (ET-1), a vasoconstrictor substance, induces focal stroke in specific brain networks, facilitating region-specific characterisation of neurodegeneration5.We investigated long-term structural brain changes in rats following ET-1 induced ischemia in the motor cortex over a more clinically relevant period of 48-weeks. T2*-weighted (T2*w) images were used to map volumetric trajectories in cortex, hippocampus and thalamus. Post-stroke whole-brain white matter (WM) changes were assessed using diffusion-weighted imaging (DWI). We hypothesised wide-spread atrophy in areas connected to the infarcted motor cortex and altered WM microarchitecture.
Methods
MRI acquisition: Adult Long Evans rats (n=14, male, age=20-weeks) were injected unilaterally with ET-1 in the right motor cortex to induce focal ischemia. Sham rats (n=9, male, age=20-weeks) were similarly injected with saline. Multiecho-T2*w and DWI were acquired invivo at baseline and 1,4,12,24,36,48-weeks post-stroke. 3D-MGE parameters: first-echo=4ms, echo-spacing=4ms, 20 echoes, TR=110ms, matrix=176x128x70, resolution=150x150x150µm3. DTI-EPI parameters: TE/TR=26/3000ms, matrix=96x80, 28 slices, resolution=350x350x350µm3, $$$\delta/\Delta$$$=5/12ms, b=2500s/mm2, 81 directions, 4 b0 volumes. Incomplete scans for 3 animals at 24-weeks were excluded due to scanner issues.Image analyses: Multiecho-T2*w images were bias-field corrected6 and averaged. Separate cohort/time templates were constructed from averaged images7 to create an unbiased study-template. The study-template was nonlinearly registered to Waxholm-space rat brain atlas8 to segment ROIs (brain, cortex, hippocampus, thalamus). Subject-to-template registration was performed to delineate ROIs in the subject images. Manual corrections were performed if needed. Region volume was computed by voxel-count.
DWI images were skull-stripped, bias-field corrected and denoised in MRtrix9. Diffusion tensor images (DTI) were estimated to construct a study-specific DTI template using DTI-TK10. Diffusion parameter maps (FA: fractional anisotropy, MD: mean diffusivity, AD: axial diffusivity, RD: radial diffusivity) were calculated and warped to the DTI-template space. For each animal, voxelwise fiber orientation distributions (FODs) were computed and warped to DTI-template space to generate an FOD-template. A tractogram seeded at ipsilesional motor cortex was generated from template FODs to ascertain connectivity to other brain regions (MRtrix).
Statistical Analyses: For all tests, p<0.05 was considered significant.
Volumetric assessment: Cross-sectional statistical analyses were performed in MATLAB for each region/timepoint separately on %-volume estimates normalized to the baseline volume (BLV). We performed a two-way ANOVA: cohort (stroke/sham) between-subject, and lesion side (ipsi/contralesional) within-subject factor; post-hoc pairwise comparisons with HSD-correction.
To determine effects of stroke on regional volumes over time, we implemented a region-wise linear mixed effects model in RStudio. Dependent variable: estimated volumes, covariates: regional BLV, total brain volume, fixed effects: cohort, side, timepoint (categorical variables), random effects: random intercept and random slope (side) by subject to address between-subject heterogeneity. All fixed effects interactions were included.
Diffusion parameters: To assess effects of stroke on diffusion parameters, voxelwise unpaired t-tests were performed for each metric and timepoint using the FSL ‘randomise’ function, corrected for multiple comparisons with threshold-free cluster enhancement.
Results and Discussion
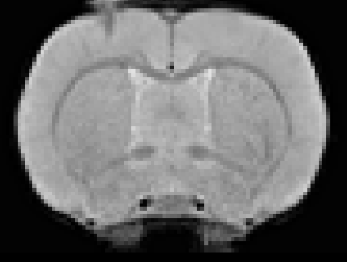
ET-1 model of focal ischemic stroke and cortical atrophy post-strokeIn all stroke rats, ET-1 injection induced focal infarcts in the right motor cortex were visible on T2*w images (Fig.1).
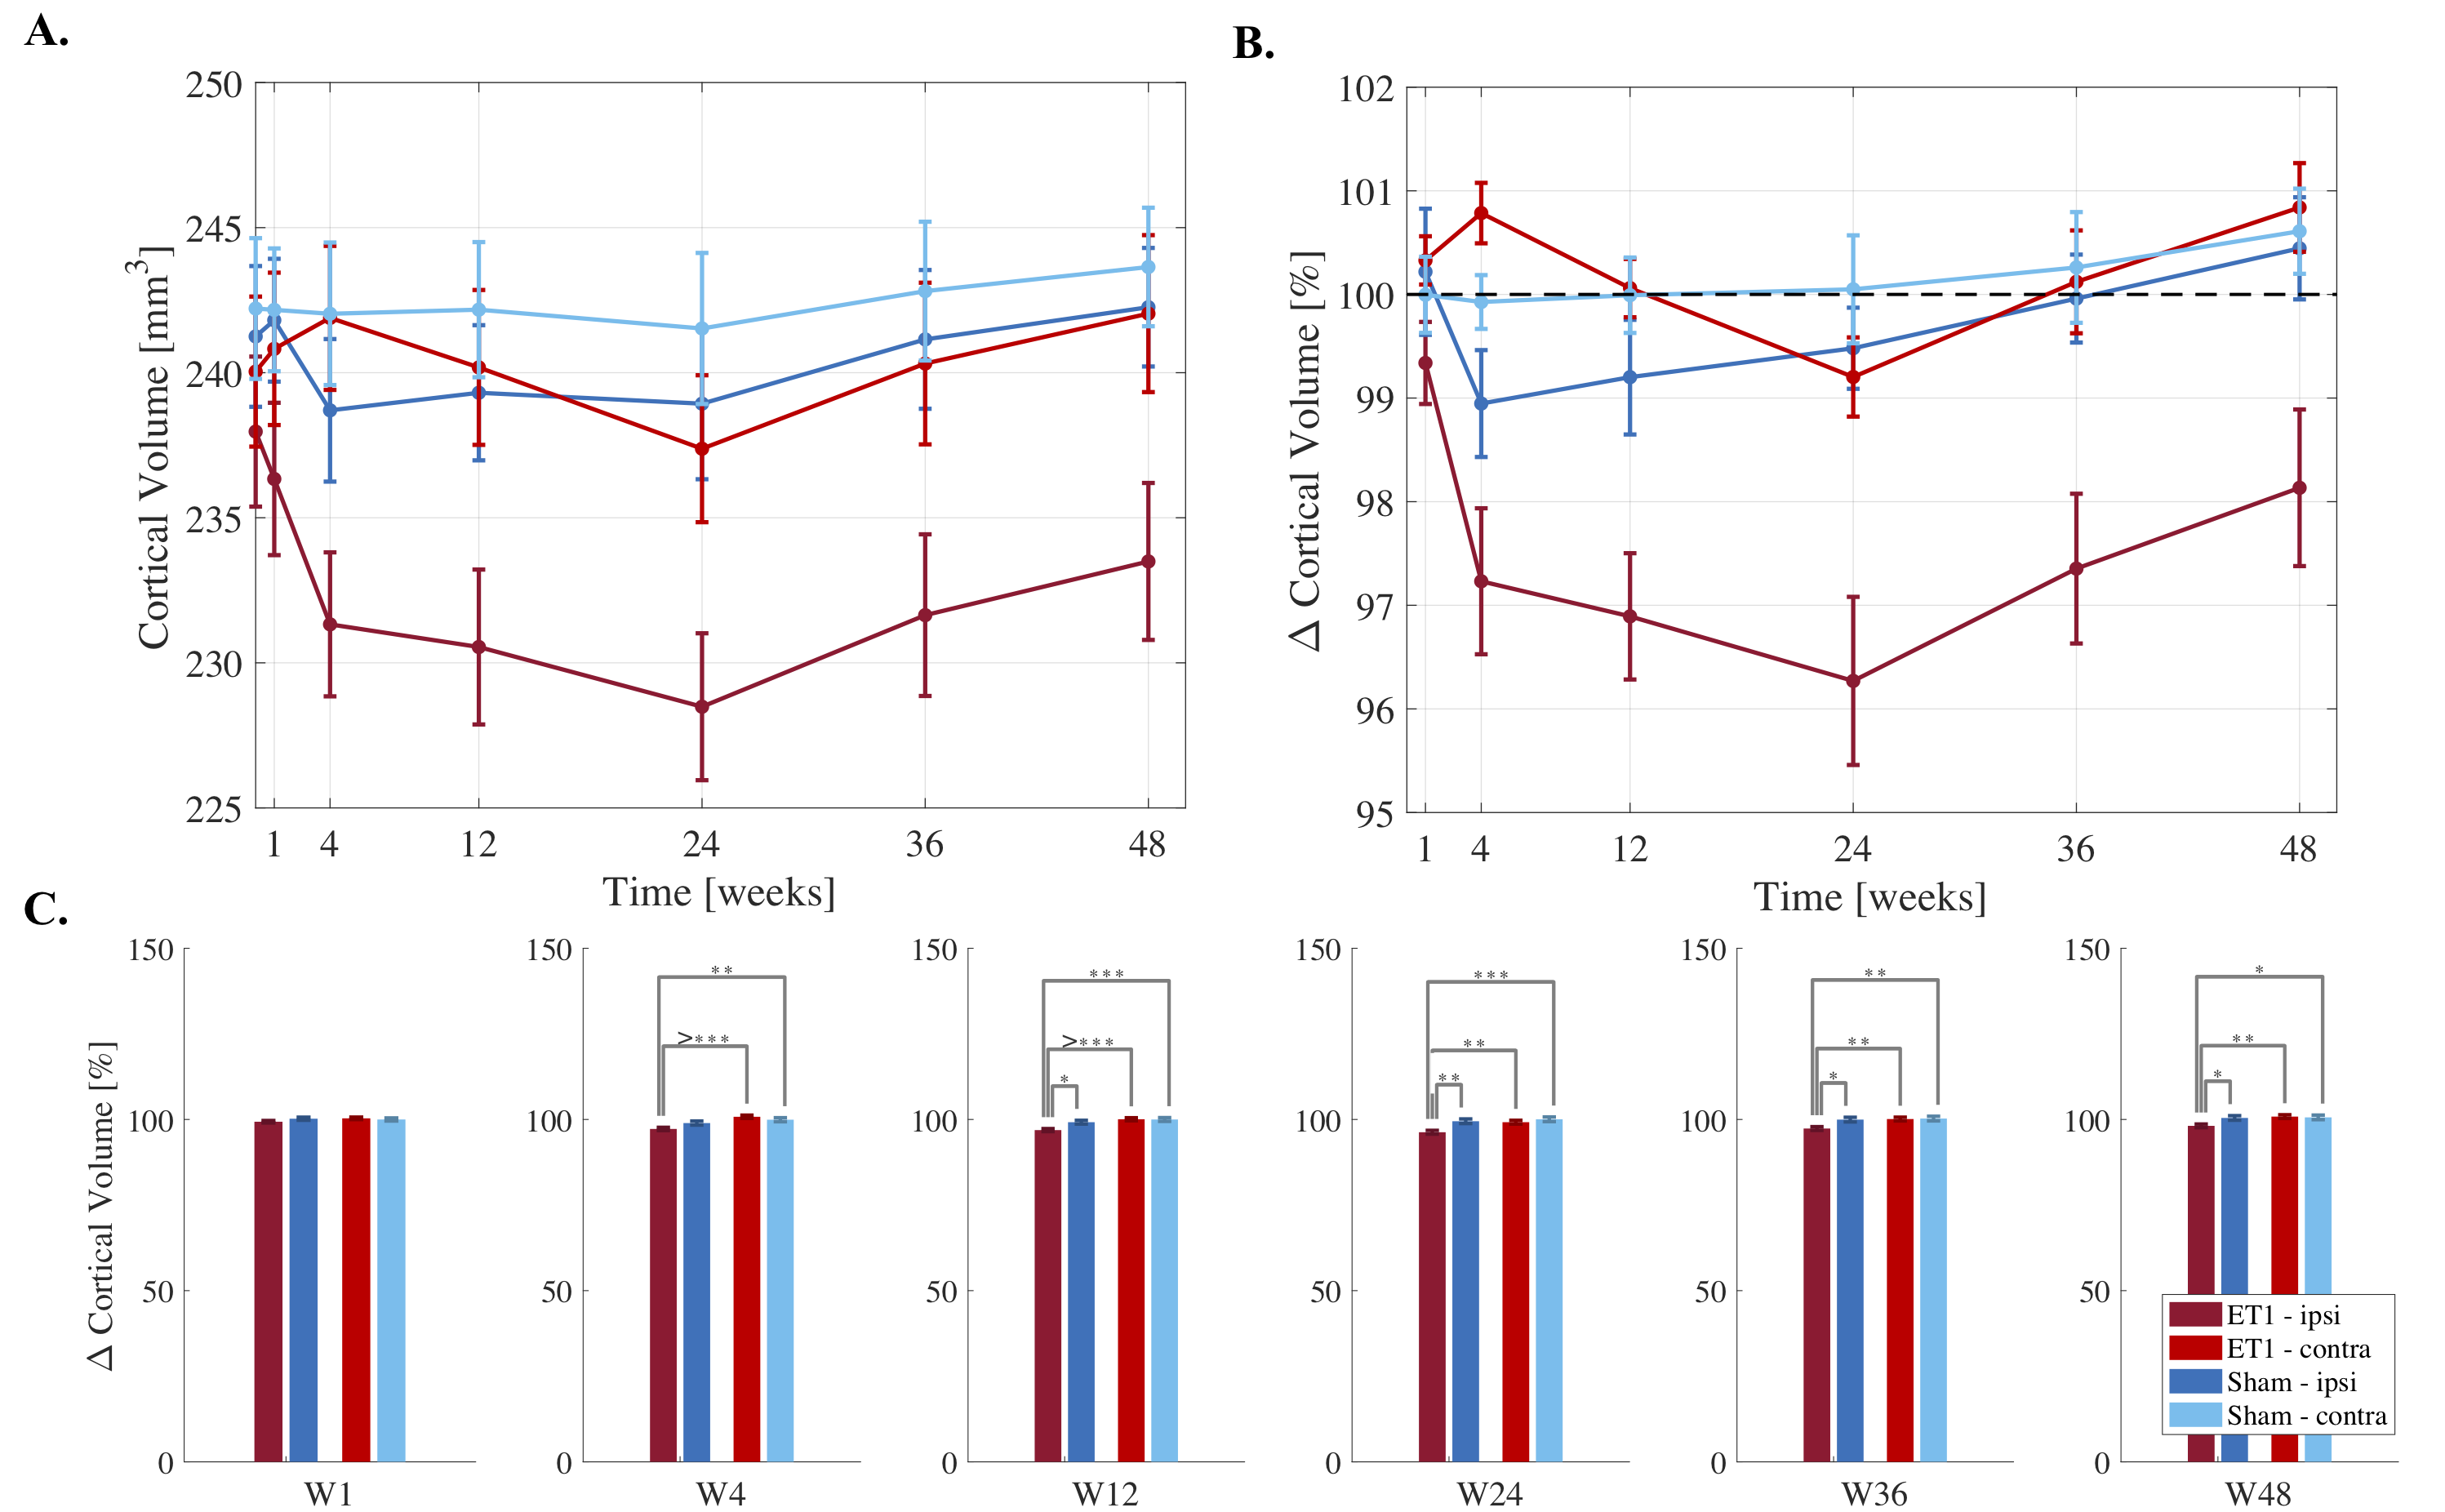
Cortical atrophy was observed ipsilesionally in stroke rats over time (Fig.2A). After an initial 2.7% drop at 4-weeks, ipsilesional volume loss peaked at 24-weeks (4% compared to baseline), followed by recovering trend at weeks-36 and 48 (Fig.2B).
Repeated measures analyses showed significant cohort/side/time interactions from weeks 4-48. Post hoc analyses showed significant ipsilesional volume decreases at each timepoint compared to BLV (p<0.0001). Cross-sectional comparisons at each timepoint showed significantly smaller ipsilesional cortices in stroke rats compared to ipsilateral sham and contralateral cortices in sham and stroke rats from 12-weeks onwards (Fig.2C).
Hippocampal and thalamic volume trajectories
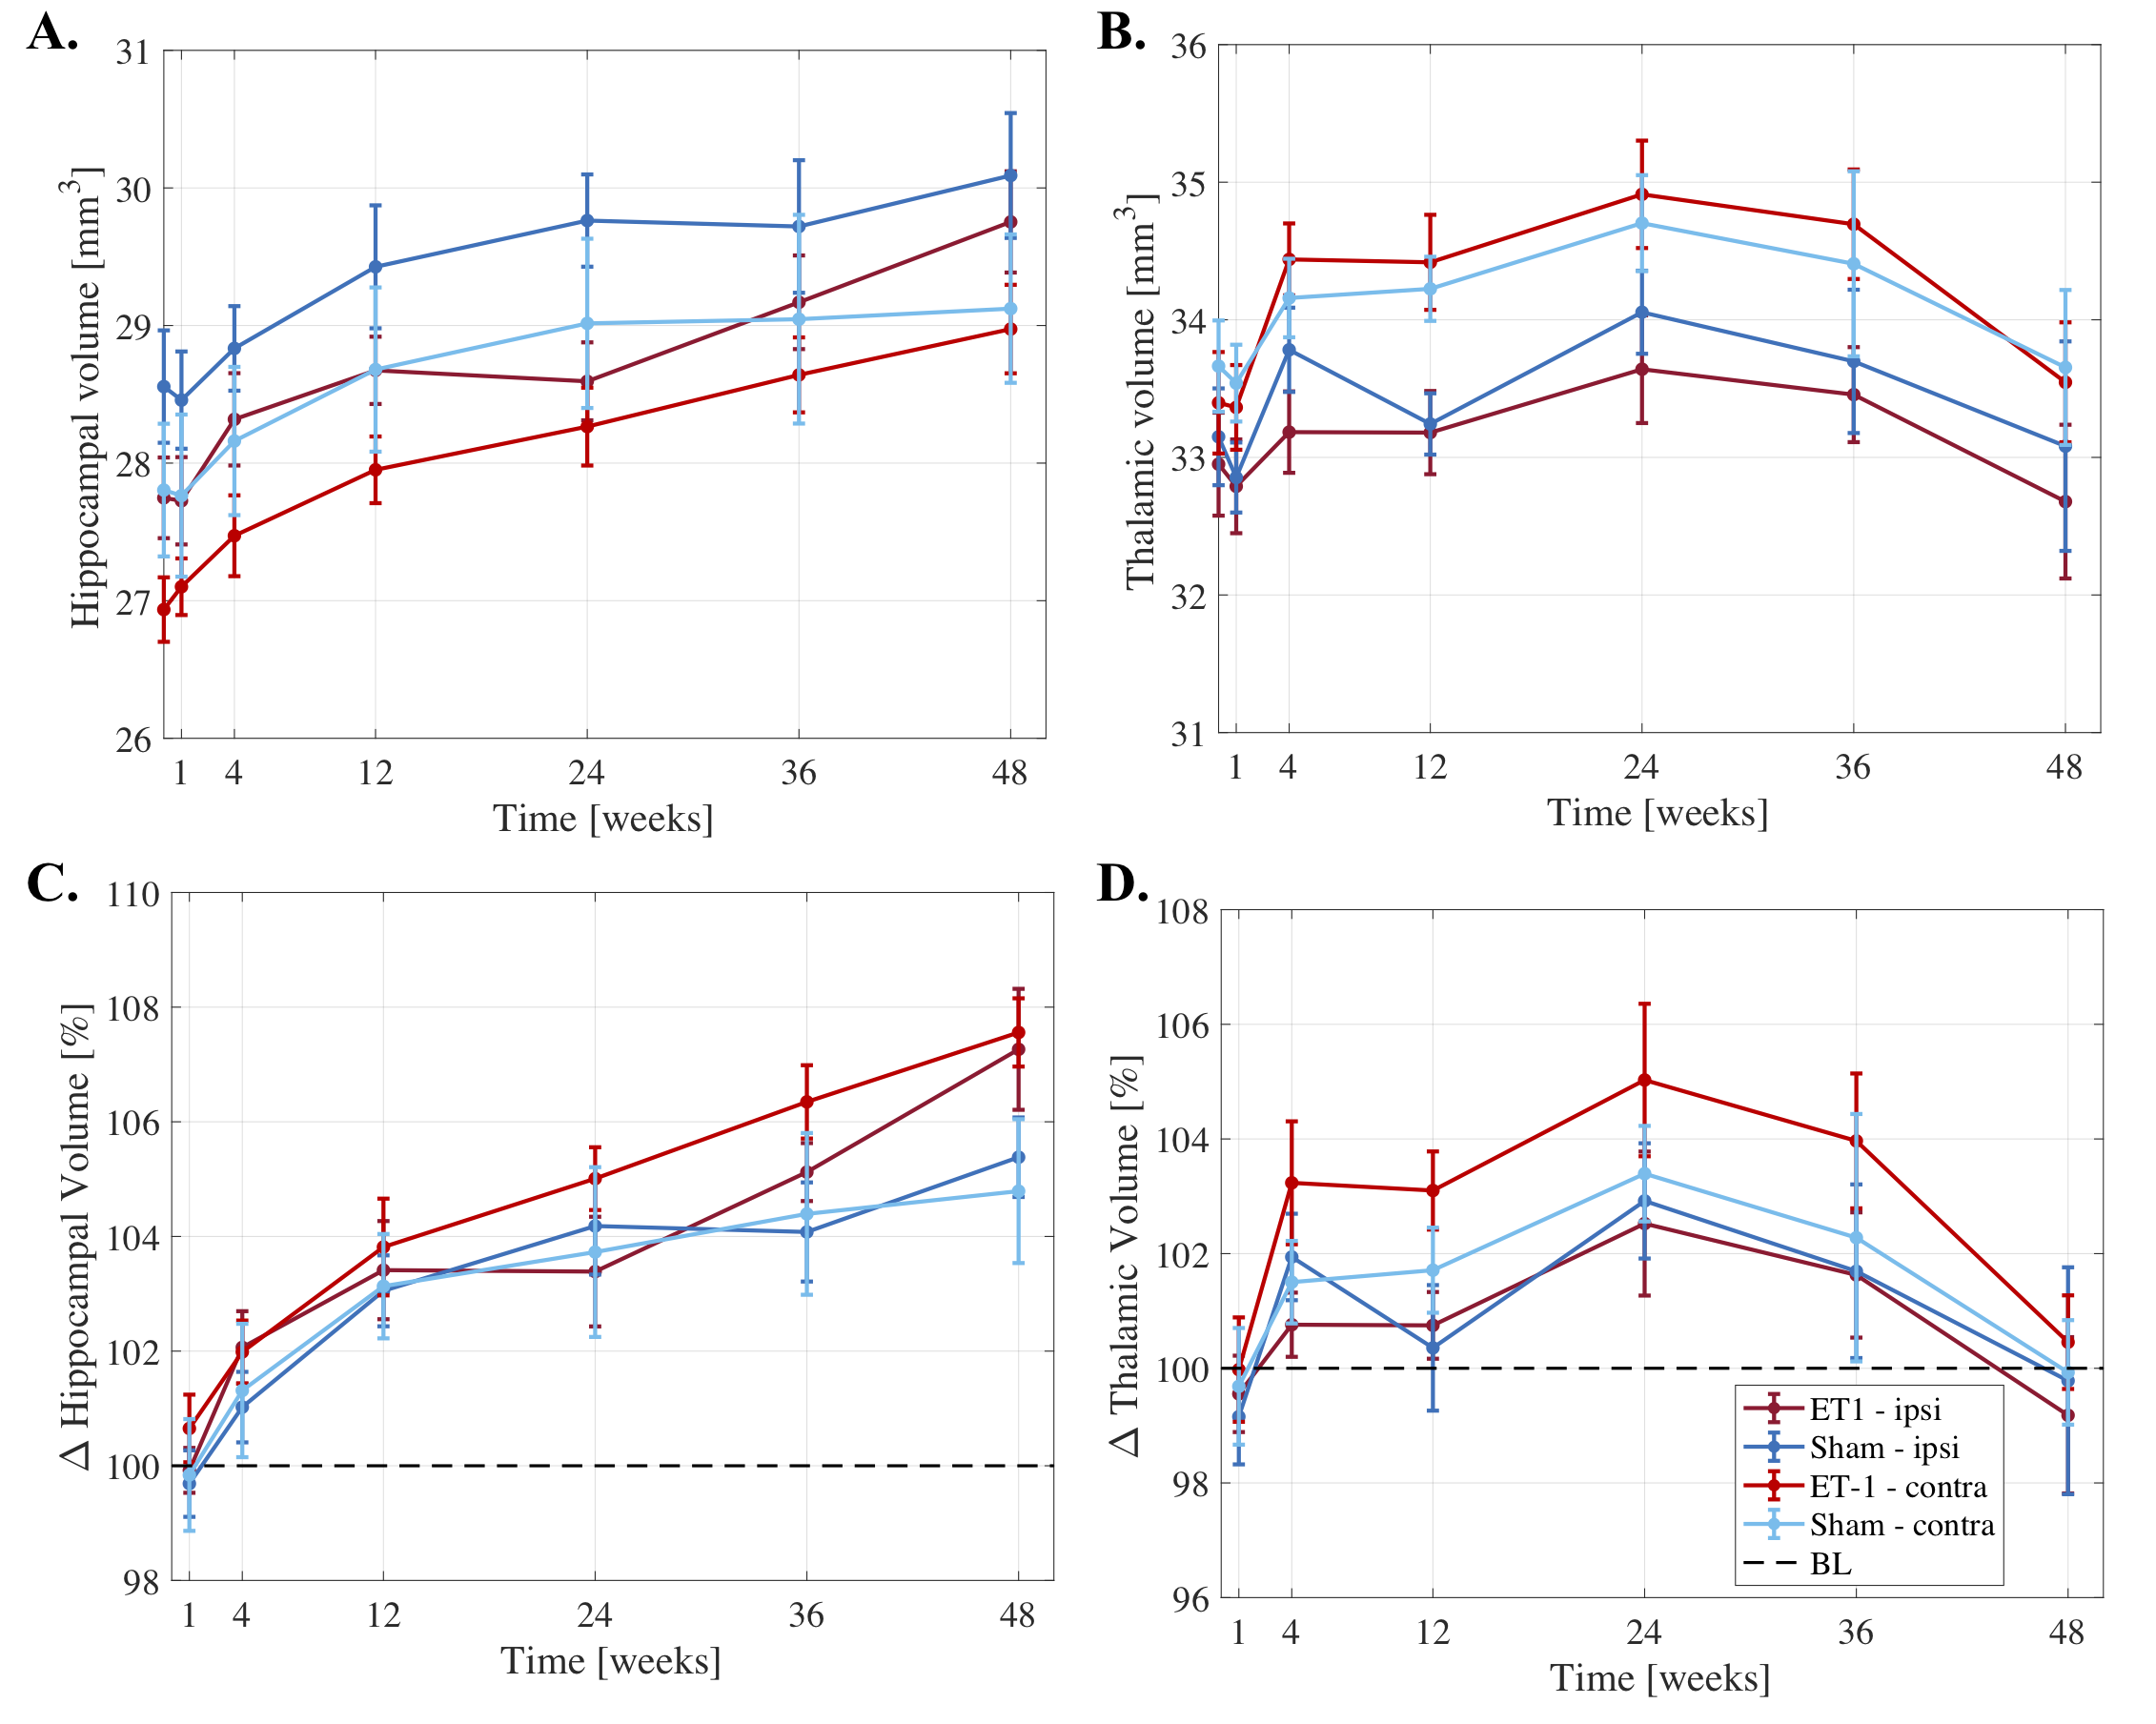
Significantly larger hippocampi were observed in both stroke and sham rats at weeks 12-48 (p<0.0001) compared to BLV (Fig.3A-B), potentially revealing developmental related hippocampal changes. At 48-weeks, stroke rats had significantly larger hippocampi than shams (~2% difference, p=0.019).
Larger thalamic volumes were observed in stroke and sham rats up to 24-weeks, with peak volume increase of ~4% compared to baseline (p=0.000253). After 24-weeks, decreasing thalamic volumes were observed, reaching baseline at 48-weeks.
Cross-sectional analyses revealed no significant differences between stroke and sham hippocampal/thalamic volumes at each timepoint (except hippocampus at 48-weeks).
FA changes after ischemic injury
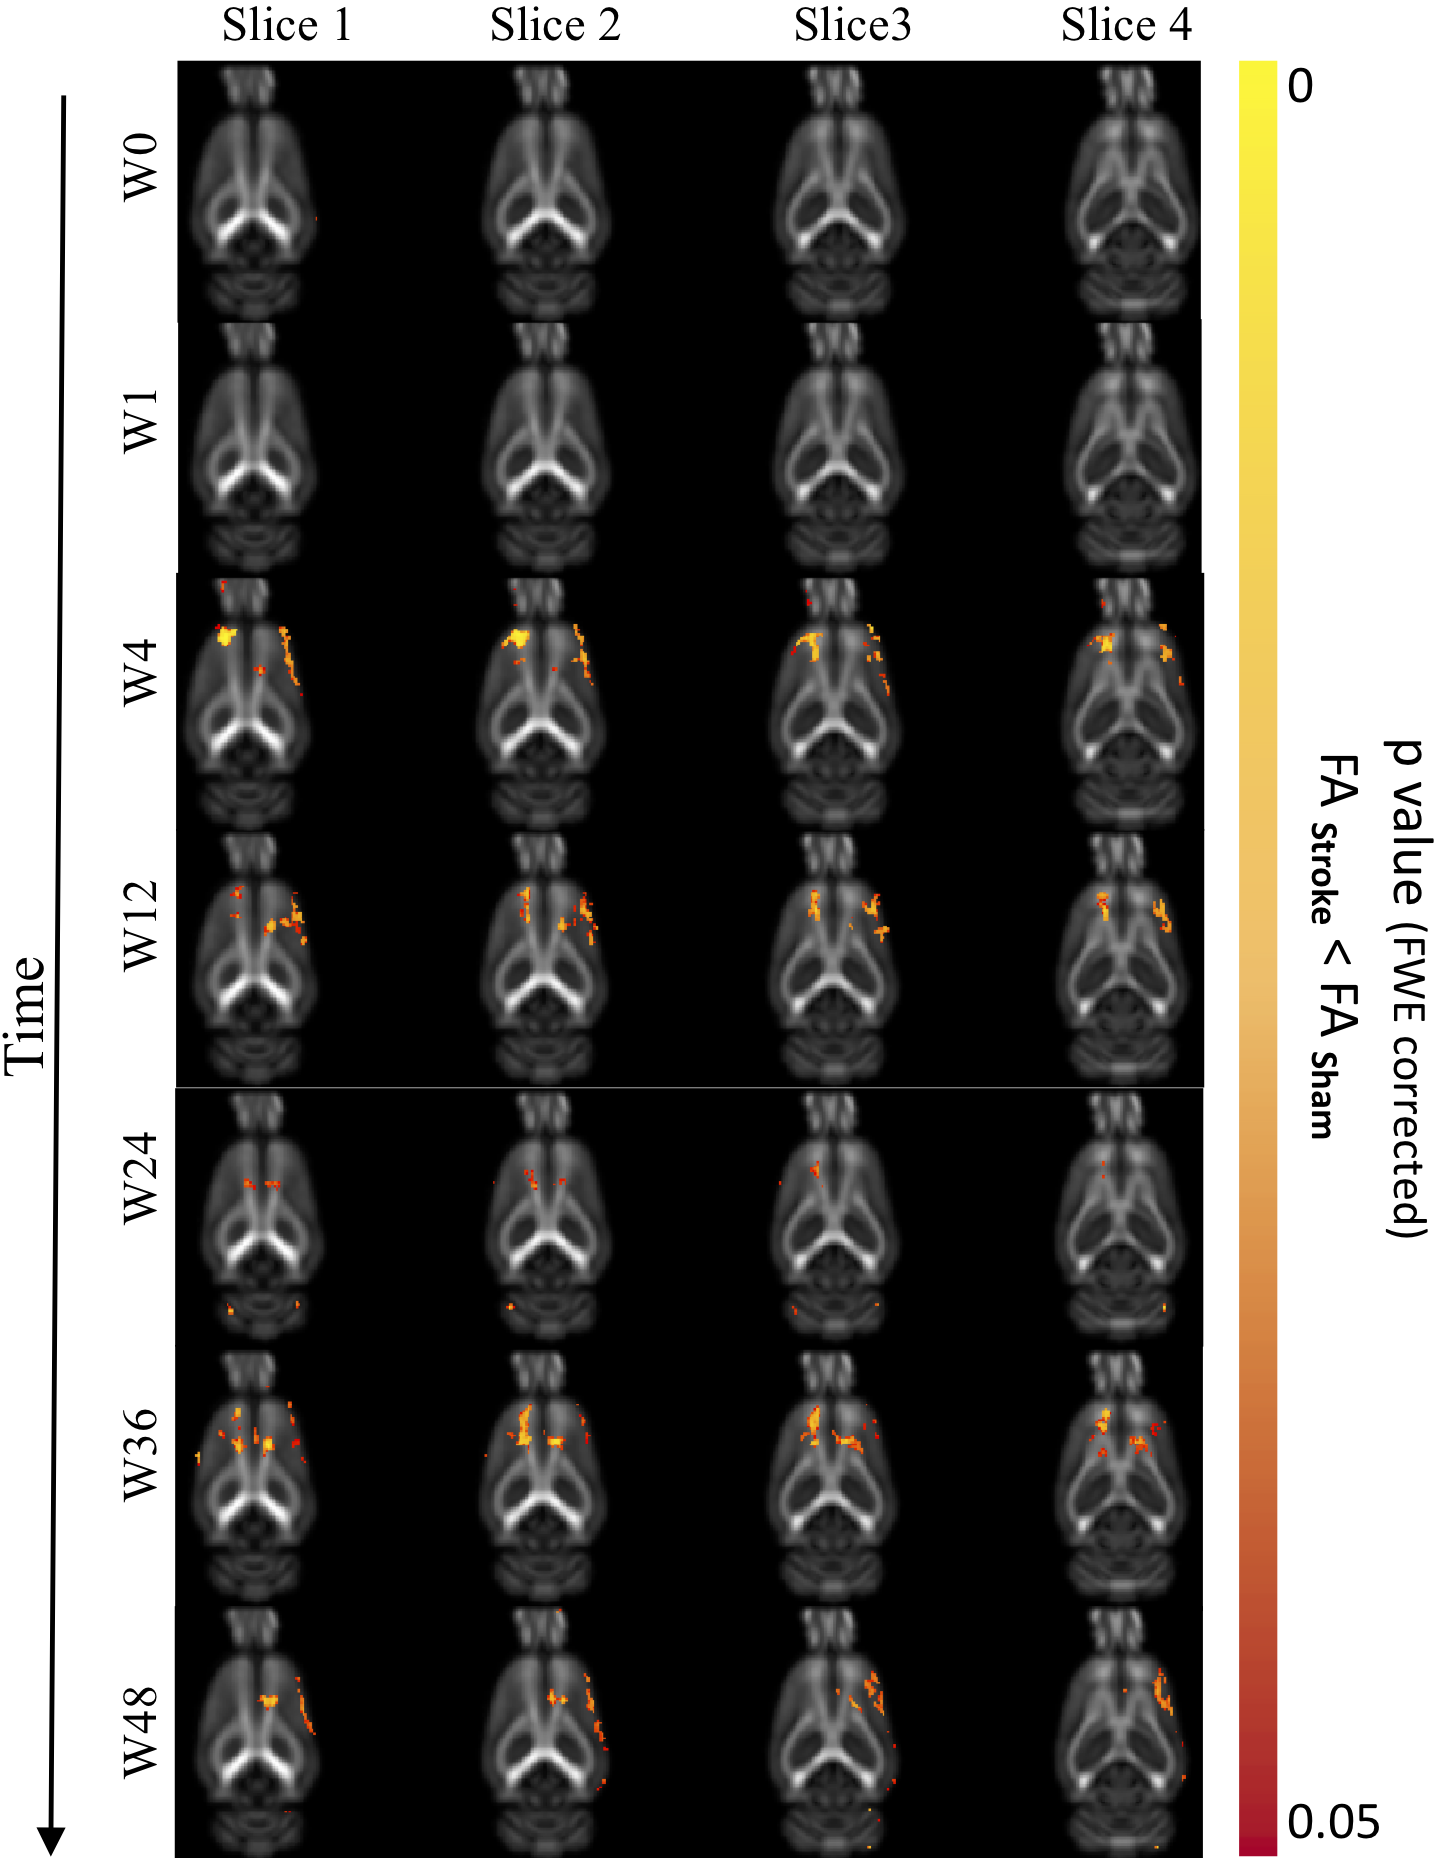
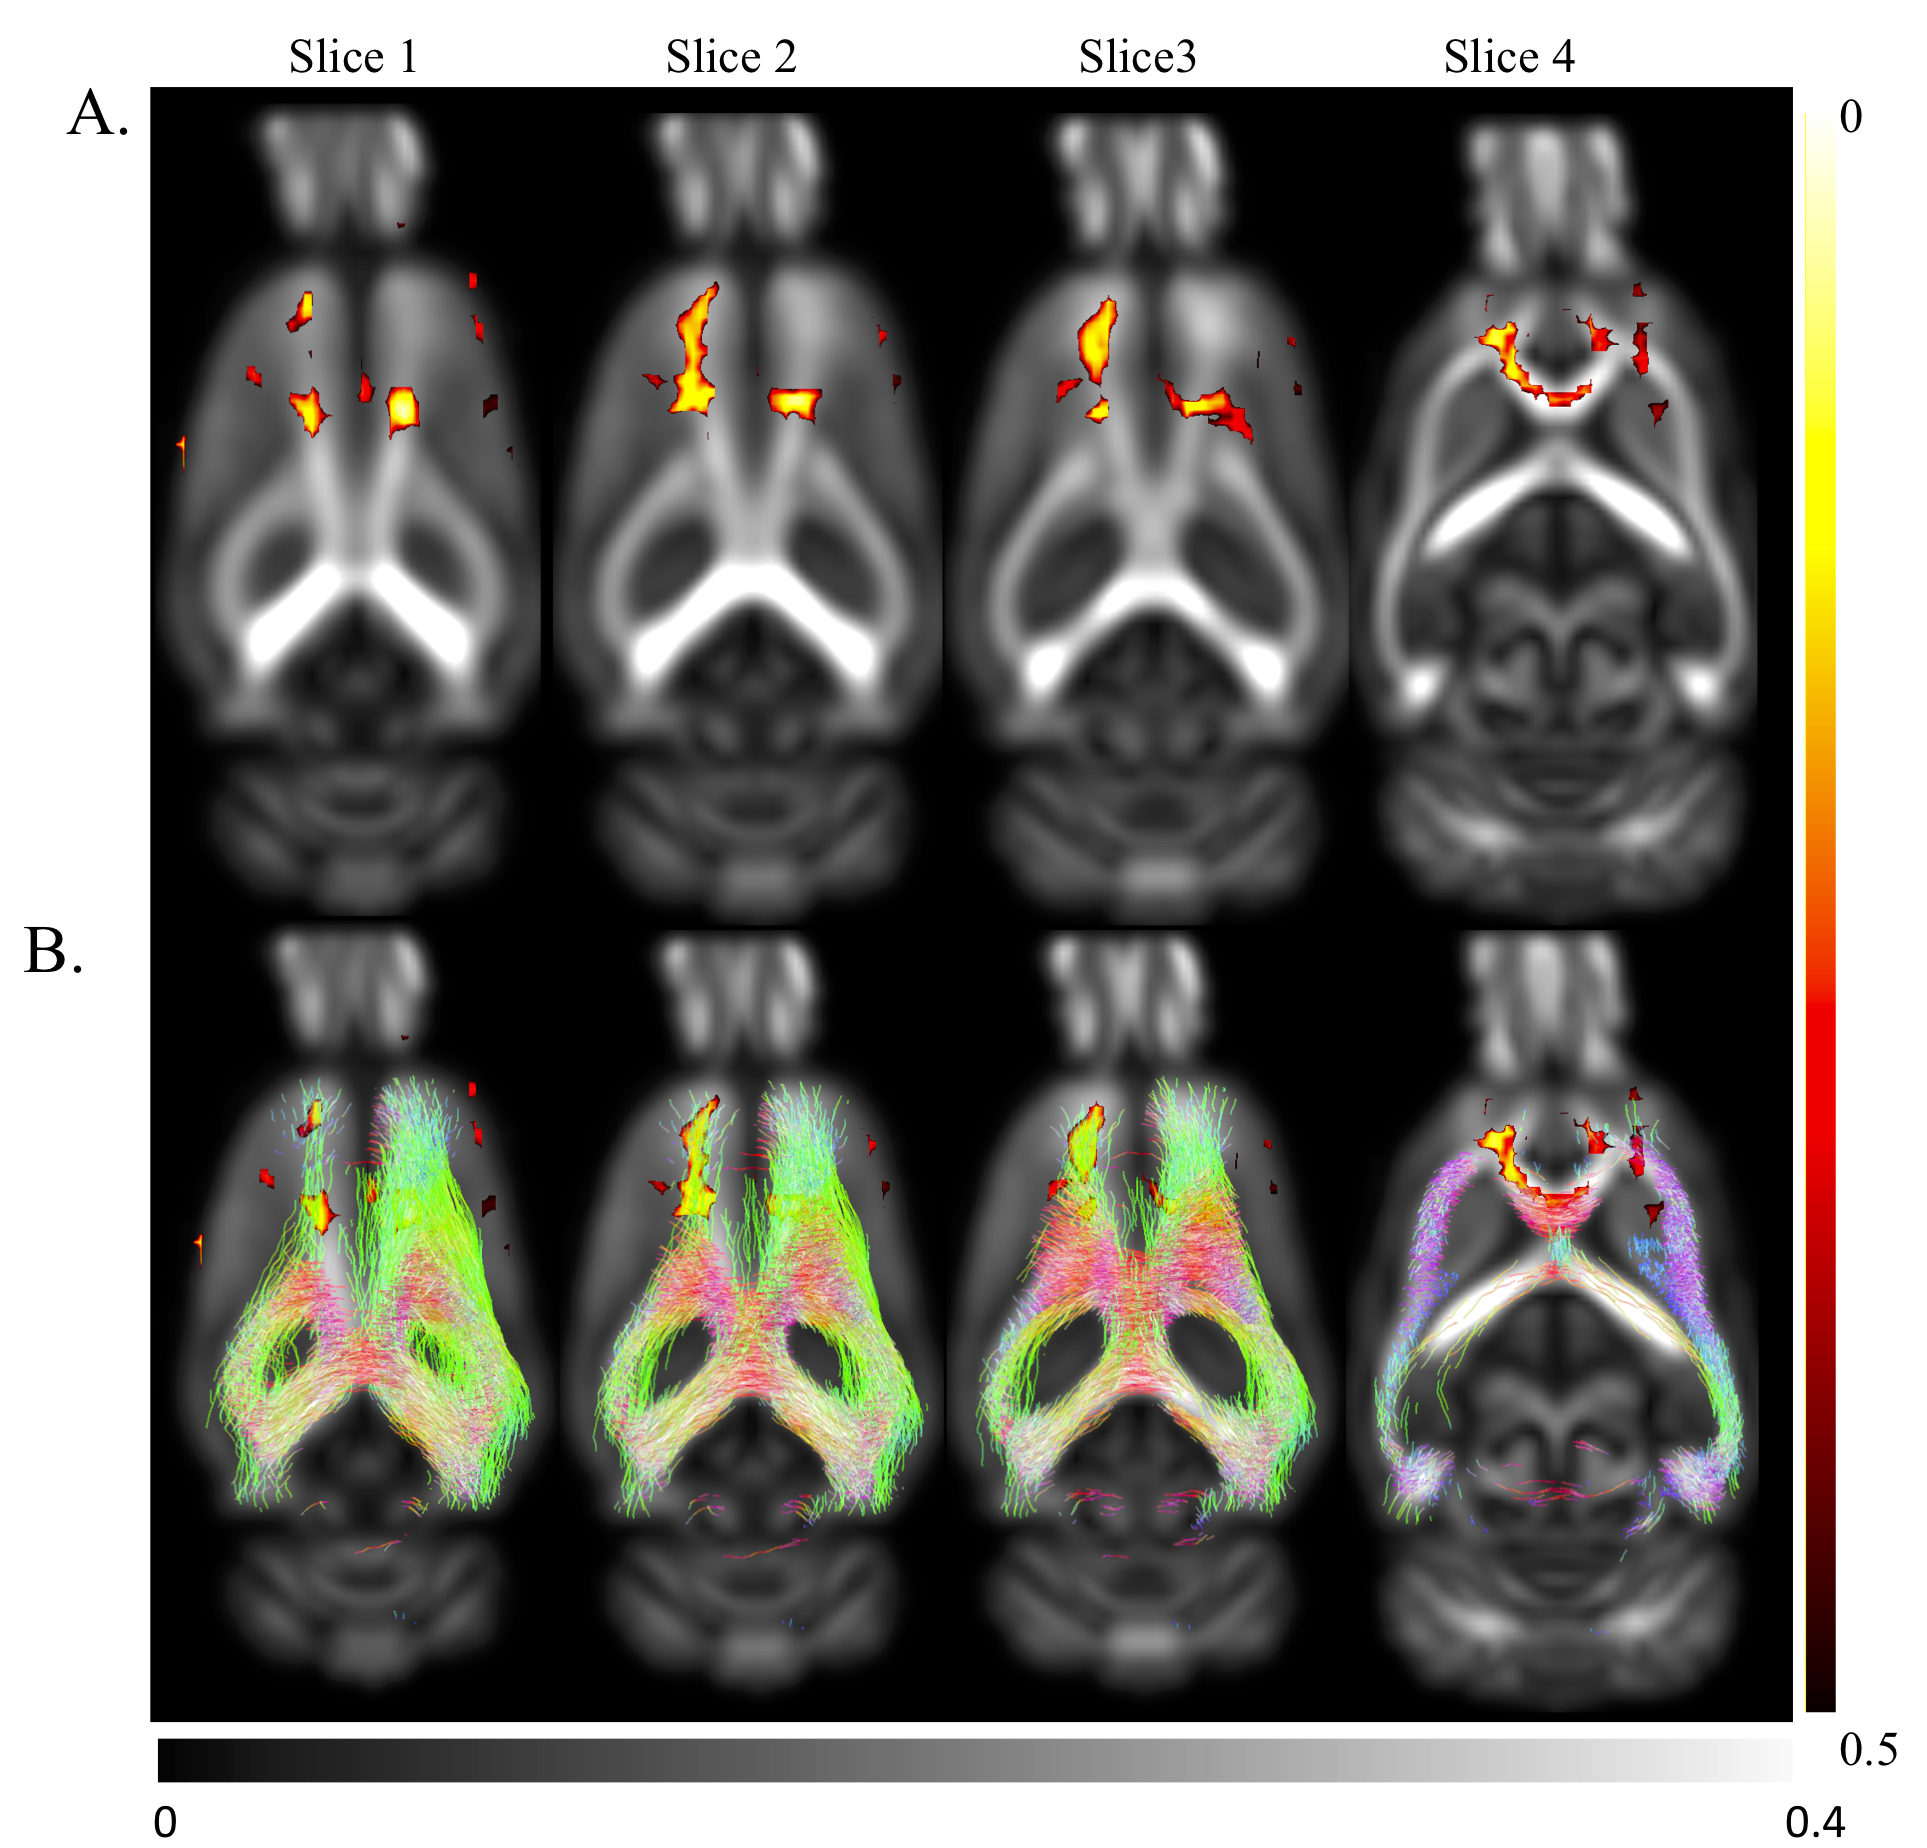
Significantly reduced FA in motor cortex and cingulum bundle regions of ischemic brains both ipsi- and contralesionally (p<0.05) from 4-36 weeks post-stroke suggest long-term compromised WM integrity in distant regions (Fig.4). At 48-weeks, only ipsilesional decrease in FA was observed. Regions of reduced FA were within motor networks (Fig.5). Human studies of neurological diseases (e.g. Alzheimer's disease, frontotemporal dementia) have reported reduced cingulum bundle FA11. No significant changes in MD/AD/RD.
Conclusion
Long-term cortical atrophy and WM changes were observed in an endothelin-1 model of ischemic stroke. Contralateral WM changes in regions connected to the initial infarction site provide evidence of secondary neurodegeneration. Future studies corroborating neuroimaging evidence with histology are warranted to investigate underlying neurodegenerative mechanisms.Acknowledgements
This work is supported by the National Health and Medical Research Council, Australia (Dementia Research Team Grant: APP1094974).References
1. Gennaro, M., A. Mattiello, and T. Pizzorusso, Rodent Models of Developmental Ischemic Stroke for Translational Research: Strengths and Weaknesses.Neural Plasticity, 2019.
2. Shi, K., et al., Global brain inflammation in stroke.The Lancet Neurology, 2019.
3. Baumgartner, P., et al., Sensorimotor stroke alters hippocampo-thalamic network activity.Scientific reports, 2018. 8(1): p. 15770.
4. Back, D.B., et al., Chronic cerebral hypoperfusion induces post-stroke dementia following acute ischemic stroke in rats.Journal of neuroinflammation, 2017. 14(1): p. 216.
5. Carmichael, S.T., Rodent models of focal stroke: size, mechanism, and purpose.NeuroRx, 2005. 2(3): p. 396-409.
6. Tustison, N.J., et al., N4ITK: improved N3 bias correction.IEEE transactions on medical imaging, 2010. 29(6): p. 1310.
7. Avants, B.B., et al., A reproducible evaluation of ANTs similarity metric performance in brain image registration.Neuroimage, 2011. 54(3): p. 2033-2044.
8. Papp, E.A., et al., Waxholm Space atlas of the Sprague Dawley rat brain.Neuroimage, 2014. 97: p. 374-386.
9. Veraart, J., et al., Denoising of diffusion MRI using random matrix theory.NeuroImage, 2016. 142: p. 394-406.
10. Zhang, H., et al., High-dimensional spatial normalization of diffusion tensor images improves the detection of white matter differences: an example study using amyotrophic lateral sclerosis.IEEE transactions on medical imaging, 2007. 26(11): p. 1585-1597.
11. Bubb, E.J., C. Metzler-Baddeley, and J.P. Aggleton, The cingulum bundle: Anatomy, function, and dysfunction.Neuroscience & Biobehavioral Reviews, 2018. 92: p. 104-127.
Figures