1919
Age-related hyperactivity of brain oxygen metabolism in a novel Tau-APP mouse model of Alzheimer’s disease1Russell H. Morgan Department of Radiology and Radiological Science, Johns Hopkins University School of Medicine, Baltimore, MD, United States, 2F.M. Kirby Research Center for Functional Brain Imaging, Kennedy Krieger Research Institute, Baltimore, MD, United States, 3Department of Pathology, Johns Hopkins University School of Medicine, Baltimore, MD, United States, 4Department of Biomedical Engineering, Johns Hopkins University School of Medicine, Baltimore, MD, United States
Synopsis
Alzheimer’s disease (AD) has been the leading cause of cognitive impairment and decline in elder individuals. Cross-sectional human studies have reported declined cerebral oxygen metabolism in AD patients tentatively attributed to reduced neuron cells. However, longitudinal change in oxygen metabolism remains unclear. We, therefore, performed a multi-modality (MRI, behavior test, and histology) study on a novel AD mouse model, dubbed as Tau4RΔK-AP, which largely mimics the pathological processes of tau-tangles and amyloid plaques as in human AD. Enhanced oxygen metabolism has been found in Tau4RΔK-AP mice, possibly indicating a compensatory response or an inefficiency of the brain energy consumption.
Introduction
Brain aging and neurodegeneration such as Alzheimer’s disease (AD) are thought to be two processes that are interrelated but also have distinctive features. The brain’s oxygen metabolism is the primary source of energy production supporting neural and glial cell activities, and is intricately related to brain function. Prior research has suggested that, with age, the brain’s cerebral metabolic rate of oxygen (CMRO2) was elevated1 but, with mild cognitive impairment (MCI), CMRO2 was reduced.2 However, because of the cross-sectional nature in most human studies, the longitudinal profile of cerebral oxygen metabolism during the development of AD pathology remains unclear.In this study, we performed a longitudinal study of oxygen metabolism and its related parameters, i.e., oxygen extraction fraction (OEF) and cerebral blood flow (CBF), in a novel AD mouse model. This model, dubbed Tau4RΔK-AP, largely mimics the pathological processes of human AD,3 in that amyloid plaques and tau tangles are formed in the brain and amyloid plaque mediates tau pathology.
Methods
A cohort of four Tau4RΔK-AP mice and six C57BL/6 wild-type mice were scanned at an 11.7T Bruker system longitudinally at the ages of 7~8, 9~10, and 11~12 months old.OEF is defined as the arteriovenous oxygenation difference, i.e., OEF=Ya-Yv. Ya is generally close to unity (assumed to be 0.99). Yv was assessed non-invasively by a T2-relaxation-under-spin-tagging (TRUST) technique4 (Figure 1a). CBF was evaluated with phase-contrast (PC) MRI covering four major feeding arteries,5 which was combined with brain volume information to yield CBF (in ml/100g/min) (Figure 1b). Finally, CMRO2 was computed from OEF and CBF using the Fick principle, i.e., CMRO2=Ca∙OEF∙CBF, where Ca denotes the oxygen carrying capacity of the blood. Aside from the physiological measures, a T2-weighted fast-spin-echo MRI was utilized to determine whole-brain volume.
After MRI session, each mouse underwent a behavior test utilizing Y-maze to assess the spatial working memory as an index for cognitive function.
After the final time point, mice were perfused for histological analyses. Brains were removed and weighed. Brain sections in 10 μm were stained with hematoxylin & eosin (H&E) and Cresyl violet (CV). Neuronal-cell count of CA1 region was measured on 3 consecutive sections stained with CV (ImageJ program). Hippocampus size was measured on 6 consecutive sections stained with H&E or CV (ImageJ program).
A mixed-effect model was used to analyze longitudinal measurements. Significance level was set as p<0.05.
Results and discussion
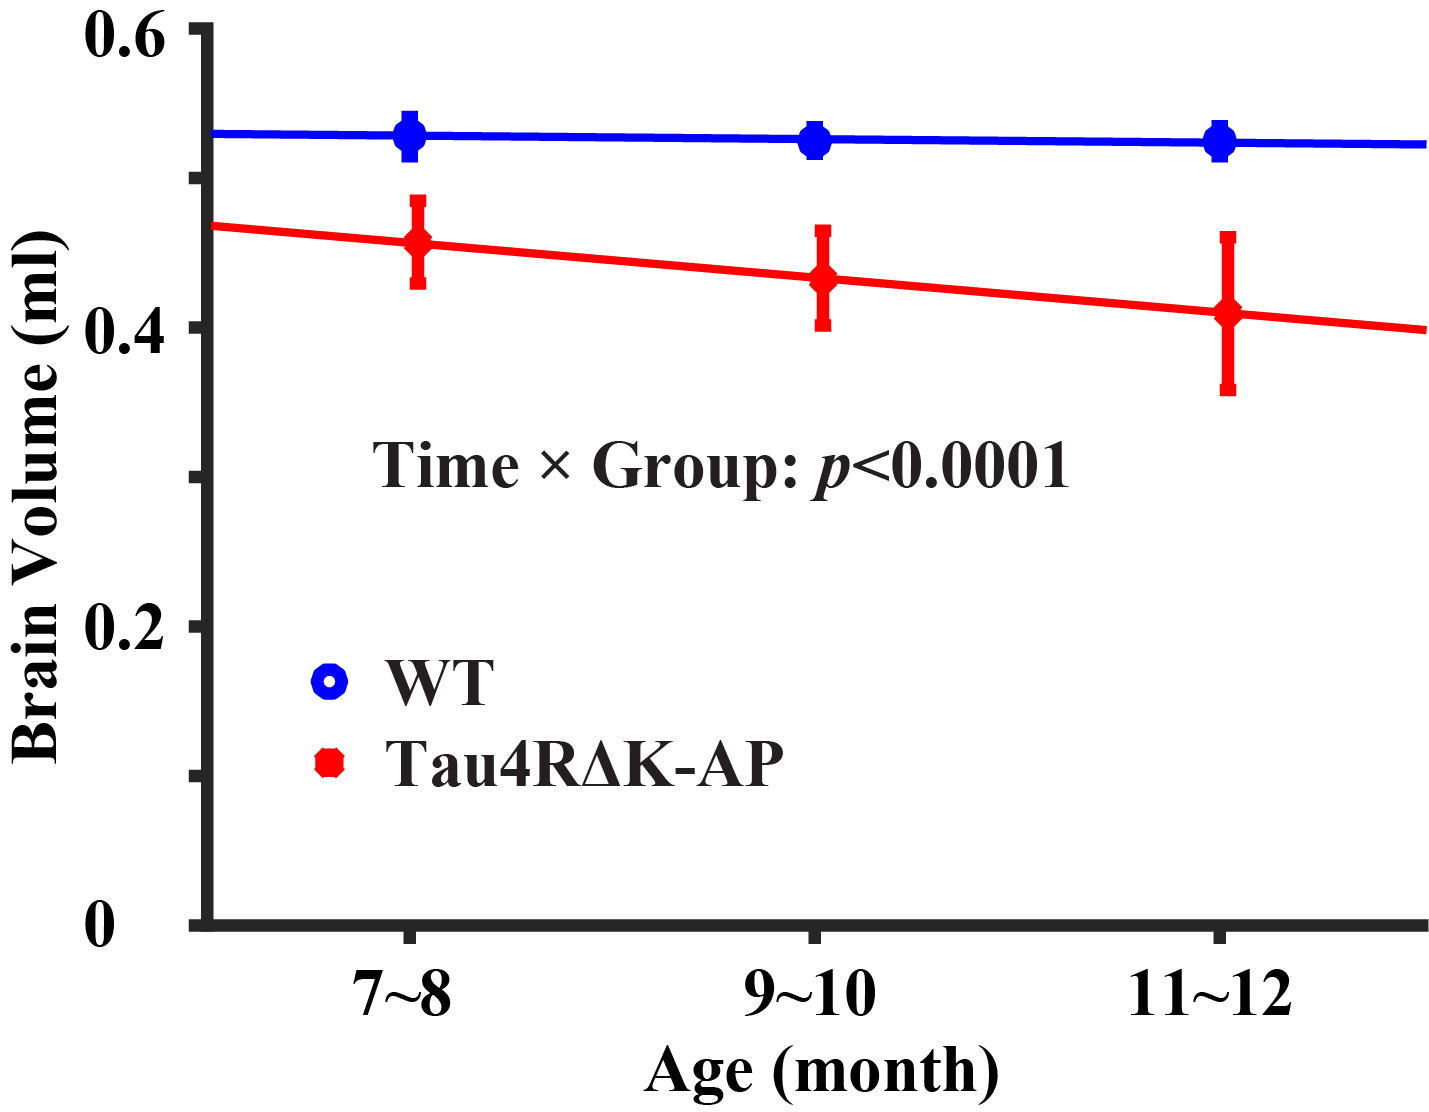
Figure 1 shows representative MRI data. As shown in Figure 1a, pair-wise subtraction yielded blood signals at different eTEs. The blood signals were fitted to estimate venous blood T2 and then converted into Yv to calculate OEF. As shown in Figure 1b, four separate PC MRIs were performed. ROIs (yellow polygons) were drawn in complex-difference images of PC MRI and then applied to velocity maps to calculate blood flows.Longitudinal changes in brain volume: Figure 2 shows brain volume changes as a function of age in Tau4RΔK-AP and wild-type mice. The Tau4RΔK-AP mice revealed an age-related decrease (p<0.0001) in brain volume at a rate of 2.62% per month. On the other hand, the wild-type mice did not show an age-change in brain volume (p=0.15). There was also an age-by-group interaction effect in brain volume, suggesting that Tau4RΔK-AP and wild-type mice have different brain atrophy rate. There was also a cross-sectional difference in brain volume between the two groups, at an age as early as 7 months (p=0.001).
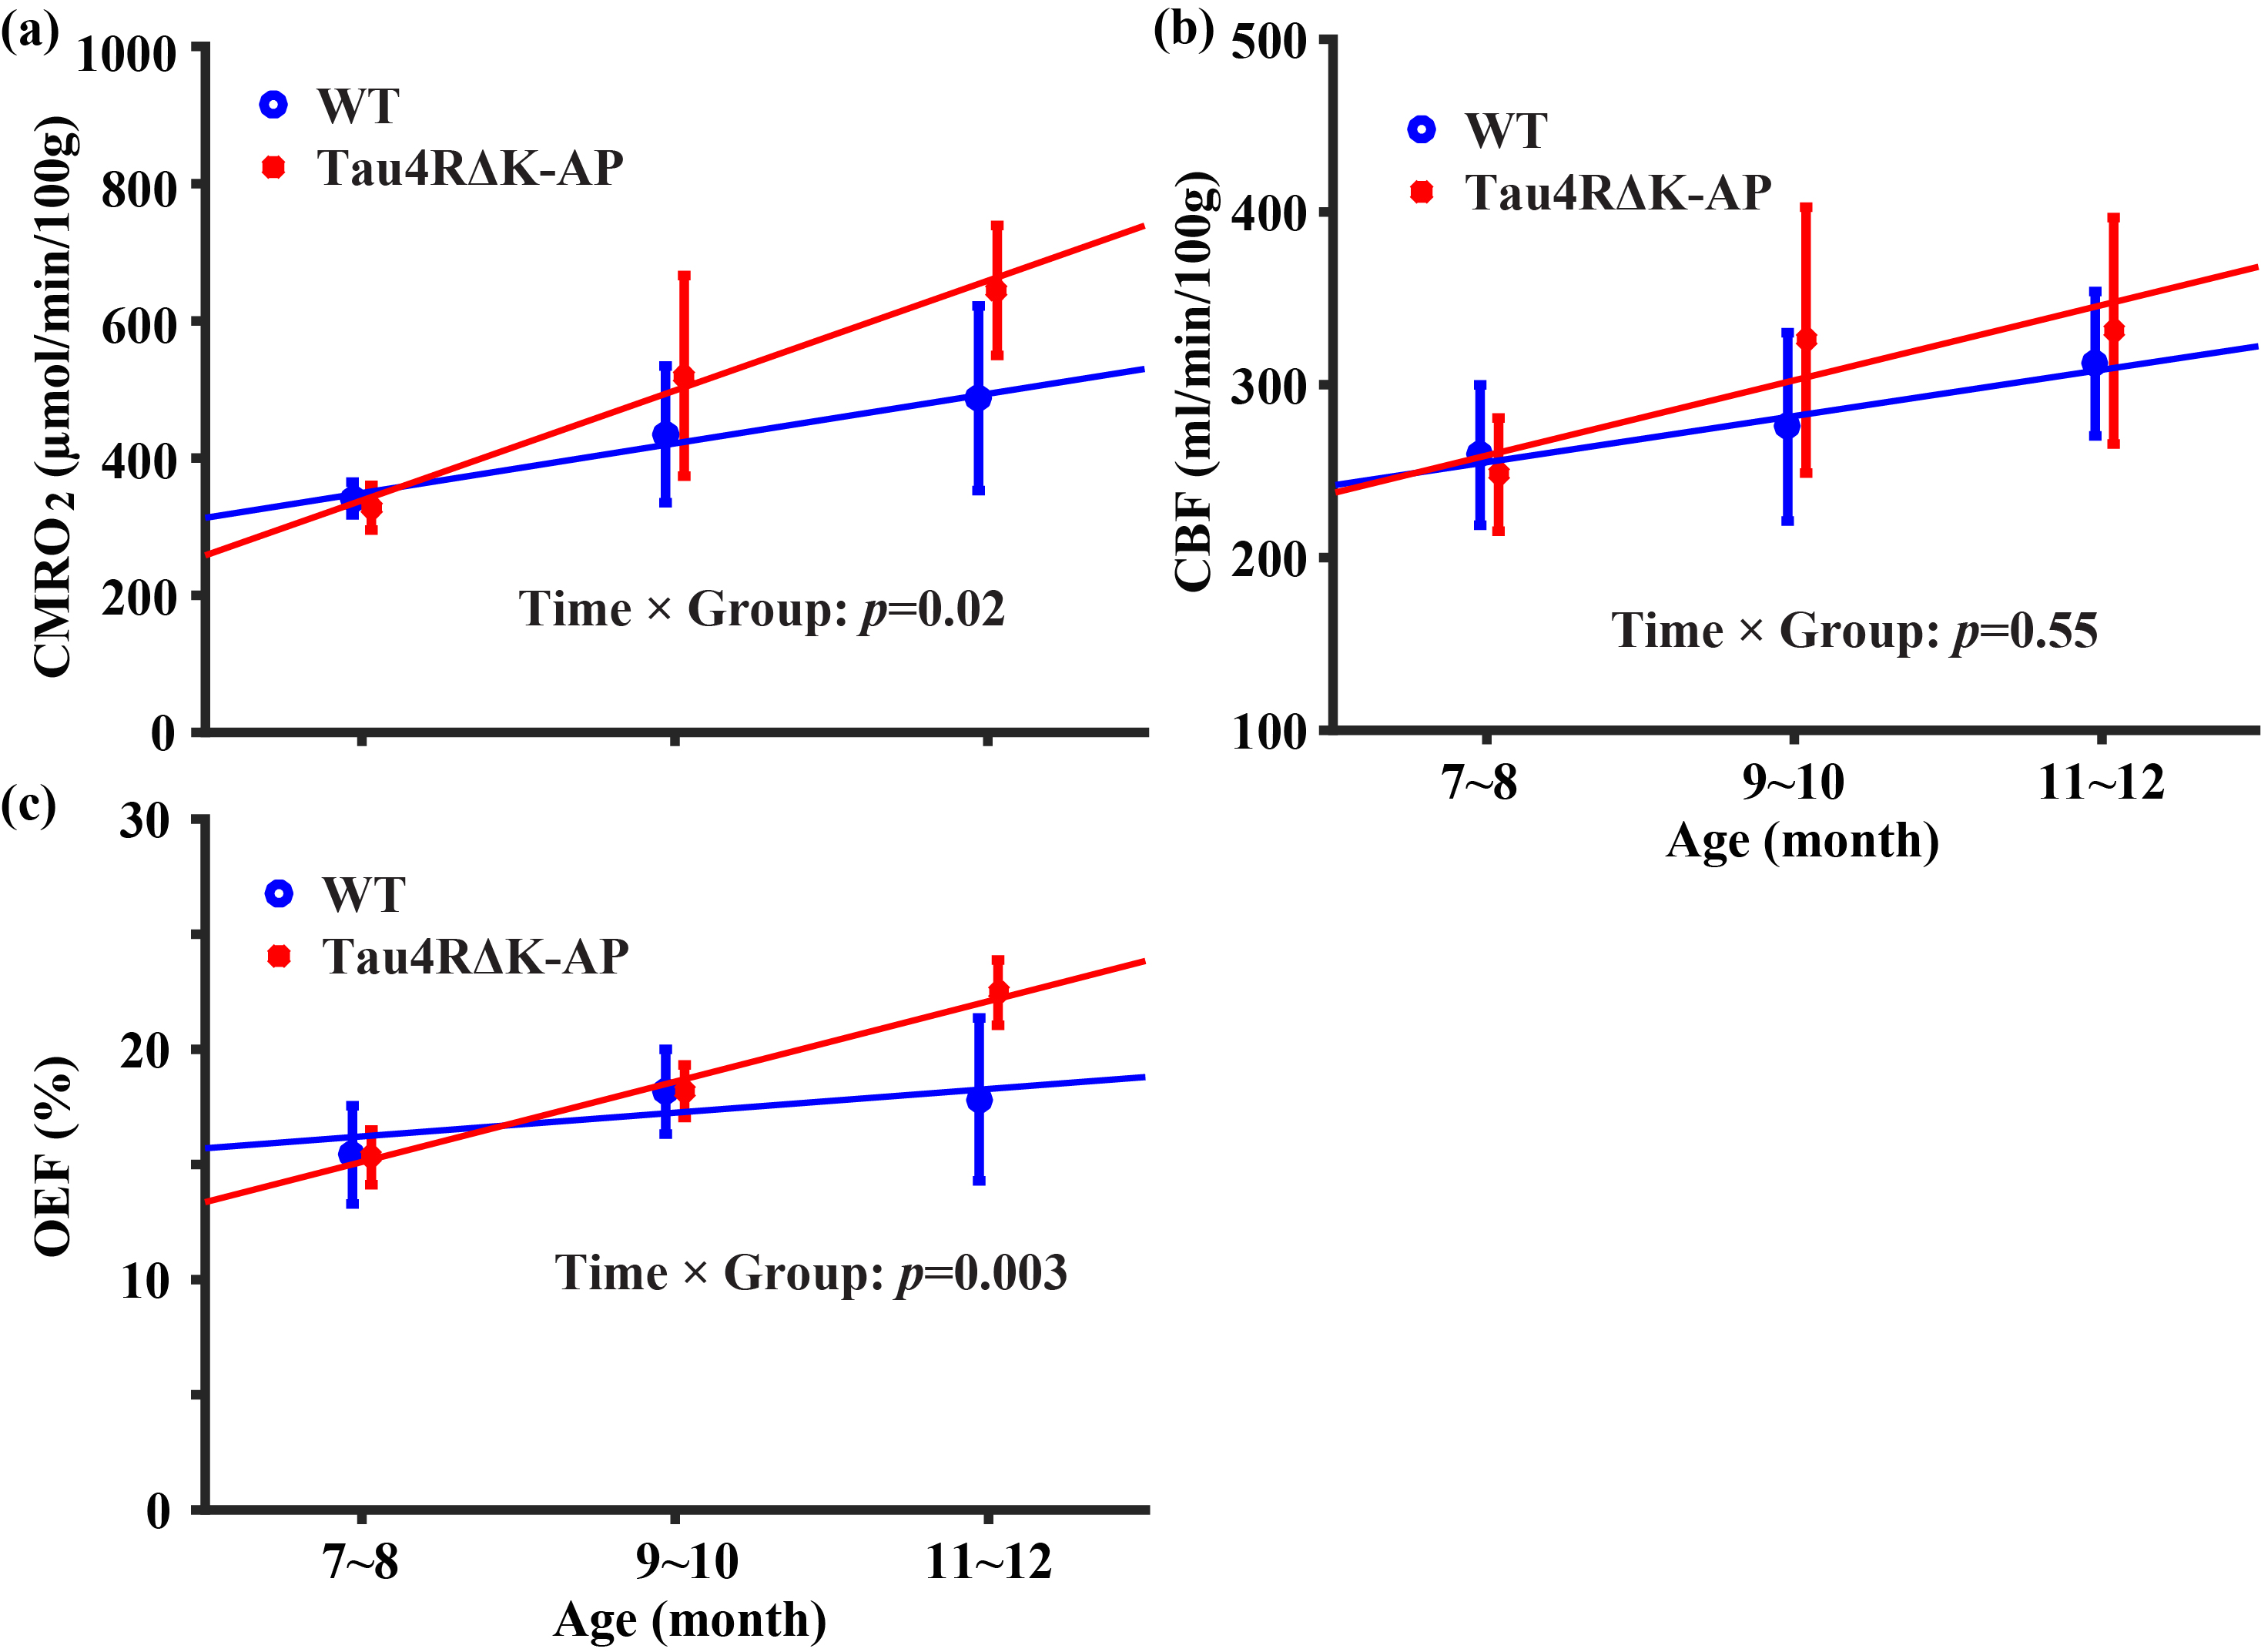
Longitudinal changes in brain physiology: Figure 3 shows age-related changes in brain physiological parameters. CMRO2 (Figure 3a) increased in both wild-type (p=0.02) and Tau4RΔK-AP mice (p=0.001), with the Tau4RΔK-AP mice having significantly faster rate of increase (p=0.02 for age-by-group interaction effect). In contrast, the age-changes in CBF appear to be similar (Age×Group: p=0.55) for the two groups (Figure 3b). OEF did not show an age-effect in wild-type mice (p=0.10), but showed an increase in Tau4RΔK-AP mice (Figure 3c, p<0.0001) with a significant Age×Group interaction effect (p=0.003). Therefore, brain aging appears to result in hypermetabolism in wild-type mice and this temporal pattern was considerably accelerated in Tau4RΔK-AP mice.
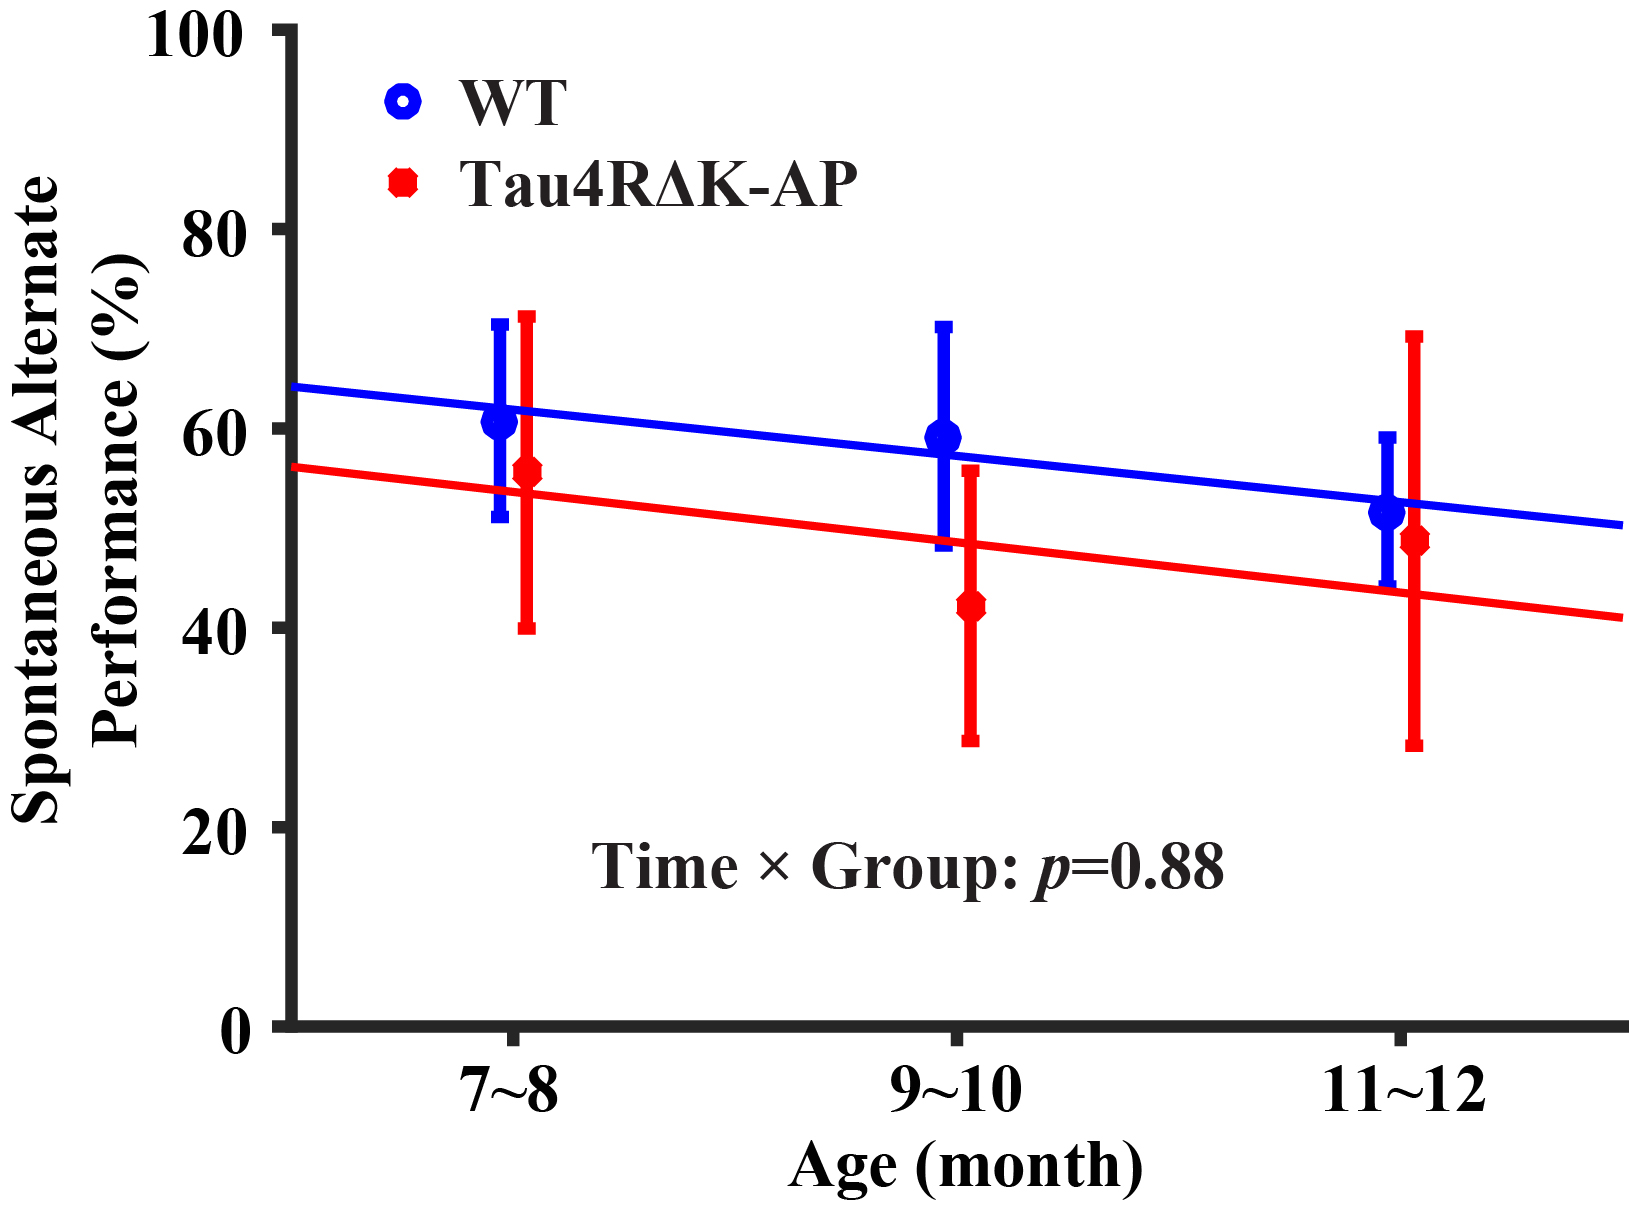
Longitudinal behavioral performance: As shown in Figure 4, there was a significant age-effect in behavioral performance in the wild-type (p=0.009) mice but not in the Tau4RΔK-AP (p=0.39) mice. There was not a difference between groups (interaction term p=0.88).
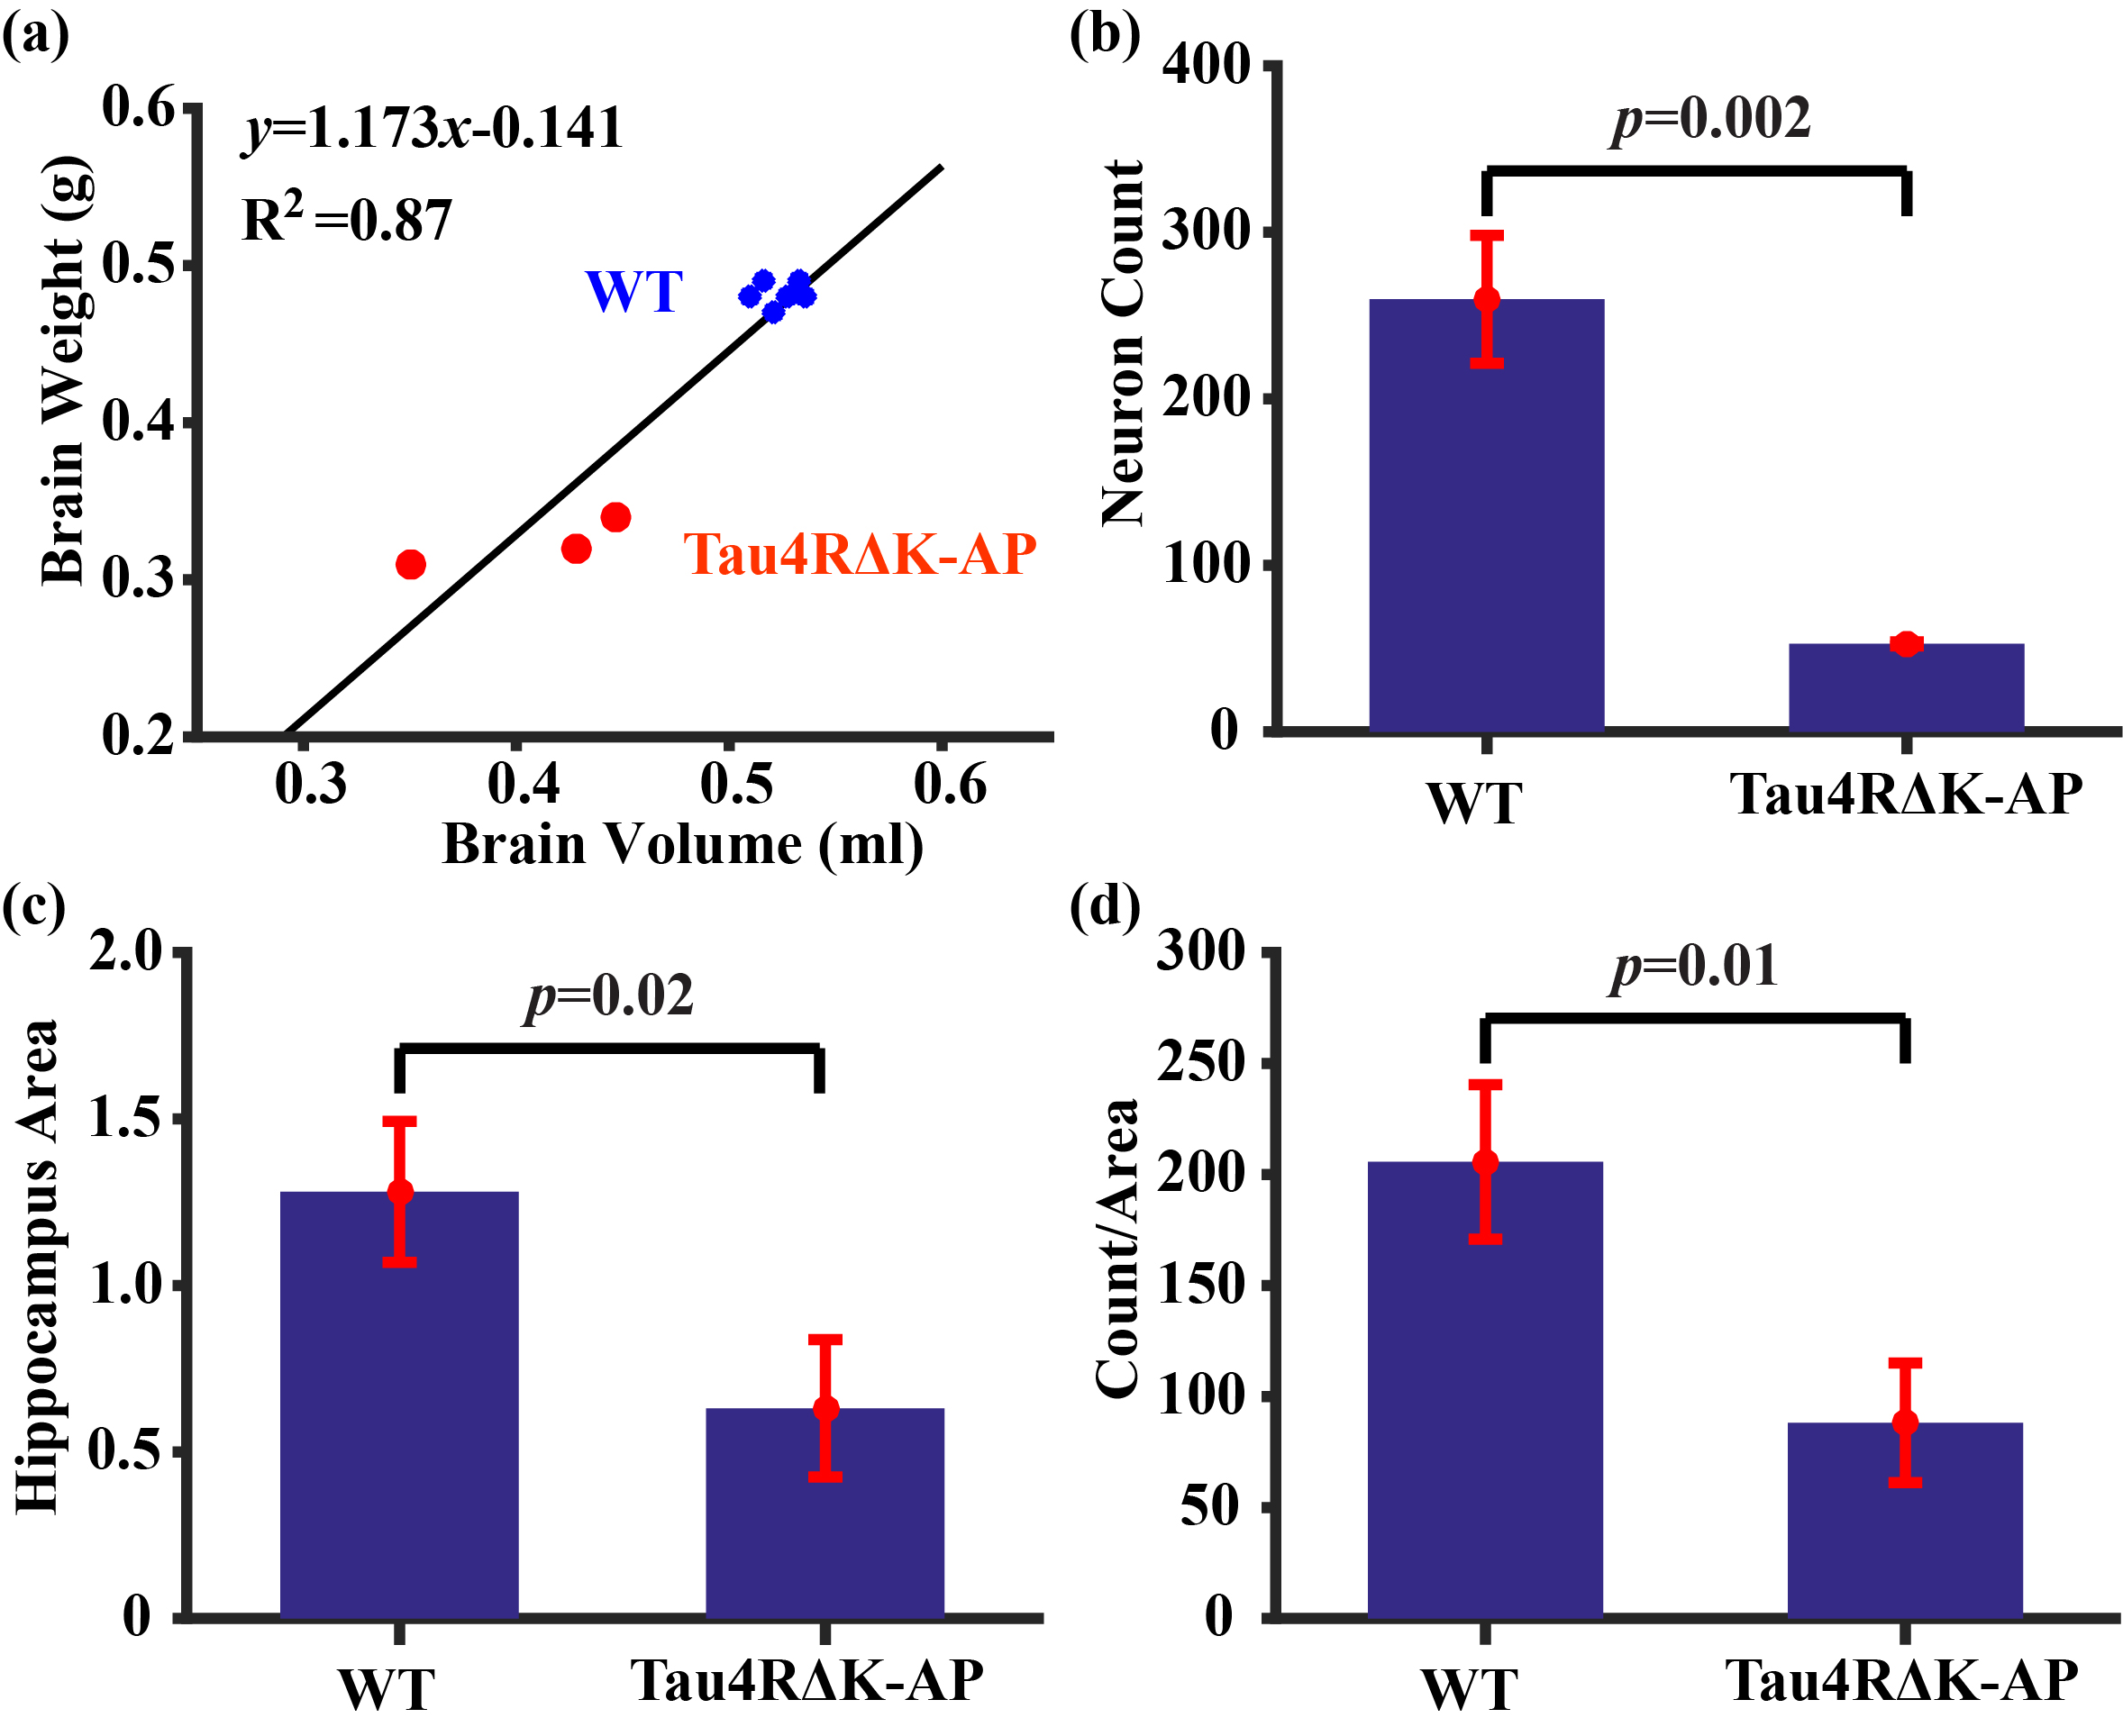
Histological results: Figure 5a shows brain weights and their correlation with the MRI volumetric measures (from the last imaging session), showing a strong correlation as expected. Figures 5b-d show histological results of neuron count, hippocampus area, and per-area neuron count, all showing a decrease in Tau4RΔK-AP mice relative to wild-type mice. These results verify the pathological hallmarks in this AD model.
Conclusions
In this longitudinal study, we revealed that early physiological changes in AD mice are characterized by hypermetabolism accompanied by unchanged or moderately increased CBF. This pattern is consistent with age-related change in brain metabolism, but at an accelerated rate. Given the histological findings of neuron loss and brain atrophy, the hypermetabolism may reflect a compensatory response (i.e., the remaining neurons have to “work harder”) or an inefficiency of the brain energy consumption (e.g., mitochondria’s O2 pathways may be inefficient or cell member may be leaky).Acknowledgements
No acknowledgement found.References
1. Lu H, Xu F, Rodrigue KM et al. Alterations in cerebral metabolic rate and blood supply across the adult lifespan. Cereb Cortex 2011; 21(6): 1426-1434.
2. Thomas BP, Sheng M, Tseng BY et al. Reduced global brain metabolism but maintained vascular function in amnestic mild cognitive impairment. J Cereb Blood Flow Metab 2017; 37(4): 1508-1516.
3. Li T, Braunstein KE, Zhang J et al. The neuritic plaque facilitates pathological conversion of tau in an Alzheimer's disease mouse model. Nat Commun 2016; 7: 12082.
4. Wei Z, Xu J, Liu P et al. Quantitative assessment of cerebral venous blood T2 in mouse at 11.7T: Implementation, optimization, and age effect. Magn Reson Med 2018; 80(2): 521-528.
5. Wei Z, Chen L, Lin Z et al. Optimization of phase-contrast MRI for the estimation of global cerebral blood flow of mice at 11.7T. Magn Reson Med 2019; 81(4): 2566-2575.
Figures