1915
Radiomics biomarker analysis for differentiating glioblastoma and brain solitary metastasis from lung cancer using T2-weighted imaging1The first affiliated Hospital of Xi’an Jiaotong University, Xi’an, China, 2Xi’an Jiaotong University, Xi’an, China, 3MR Research China, GE Healthcare,, Xi'an, China
Synopsis
Glioblastoma and brain solitary metastasis from lung cancer have similar peritumoral edema on T2-weighted imaging (T2WI). However, indistinguishable signs between these two tumors embarrass the radiologists and lead to high misdiagnosis rate. To address such issue, radiomics biomarkers were analyzed to detail the tumors’ histologic and morphologic characteristics. Results indicated that radiomics biomarkers including histogram of oriented gradient, shape and grey level co-occurrence matrix, which charaterize the lesion’s shape and signal showed good performance in differentiating these two tumors. Furthermore, using those radiomics biomarkers, a gradient-boosting machine learning model was established and showed good performance (Area under the curve=0.88).
Introduction
Glioblastoma is the most common primary malignant tumor of the brain [1]. Brain metastases are a frequent complication in patients with lung cancer and a significant cause of morbidity and mortality[2]. Differentiation of the two neoplasms is clinically crucial for prescribing the patients’ management and assessing the prognosis[3], especially for the brain solitary lesion. However, indistinguishable signs between two tumors on T2-weighted imaging (T2WI) always embarrass the radiologists and thus lead to high misdiagnosis rate, such as peritumoral edema[4]. Previous studies reported that the peritumoral edema of the two tumors was different in some functional magnetic resonance imaging (MRI) analysis. However, few studies reported the radiomics biomarker between the two tumors using T2WI. To address such issue, we extracted and analyzed series of T2WI radiomics features to detail the tumors’ histologic and morphologic characteristics. In addition, a gradient-boosting (GDBT) machine learning was used to serve for distinguishing the two tumors by the radiomics biomarkers.Methods
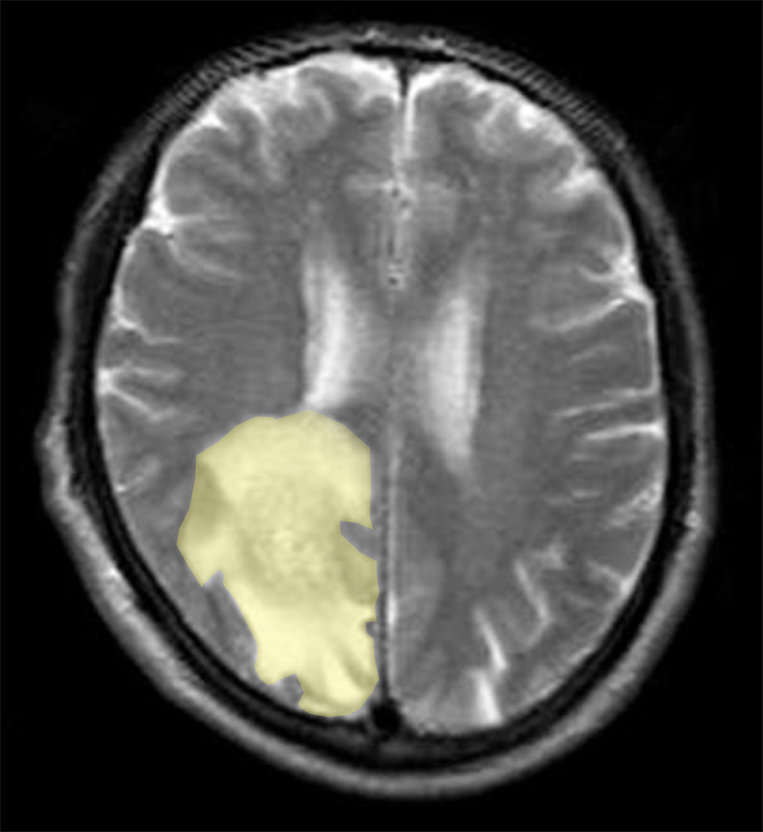
From May 2015 to May 2018, 37 patients who underwent T2WI were retrospectively enrolled. Inclusion criteria: 1) pathologically confirmed newly diagnosed gliomas; 2) pathologically or follow-up confirmed newly diagnosed brain metastasis; 3) availability of diagnostic-quality preoperative MR images with obvious brain tumor. The region of interest (ROI) of tumor segmentation was manually performed using the ITK-SNAP software (www.itk-snap.org) based on T2WI (Figure 1). A total of 155 radiomics features including histogram of oriented gradient (HOG), first order, grey level co-occurrence matrix (GLCM), gray level run length matrix (GLRLM), gray level size zone matrix (GLSZM), gray level dependence matrix (GLDM) and shape features were extracted from ROI on each slice[5-6]. Least absolute shrinkage and selection operator (LASSO) was used for dimension reduction of radiomics features. Multiple logistic regression (with stepwise forward) was used for selecting the radiomics biomarkers. Based on the radiomics biomarkers, GDBT machine learning model was established (70% data for training and 30% data for testing) in distinguishing glioblastoma and brain solitary metastasis from lung cancer. The area under receiver operating characteristic (ROC) curve was used to evaluate the diagnostic performance. Analyses were performed with R software (version 3.6.0; http://www.r-project.org).Results
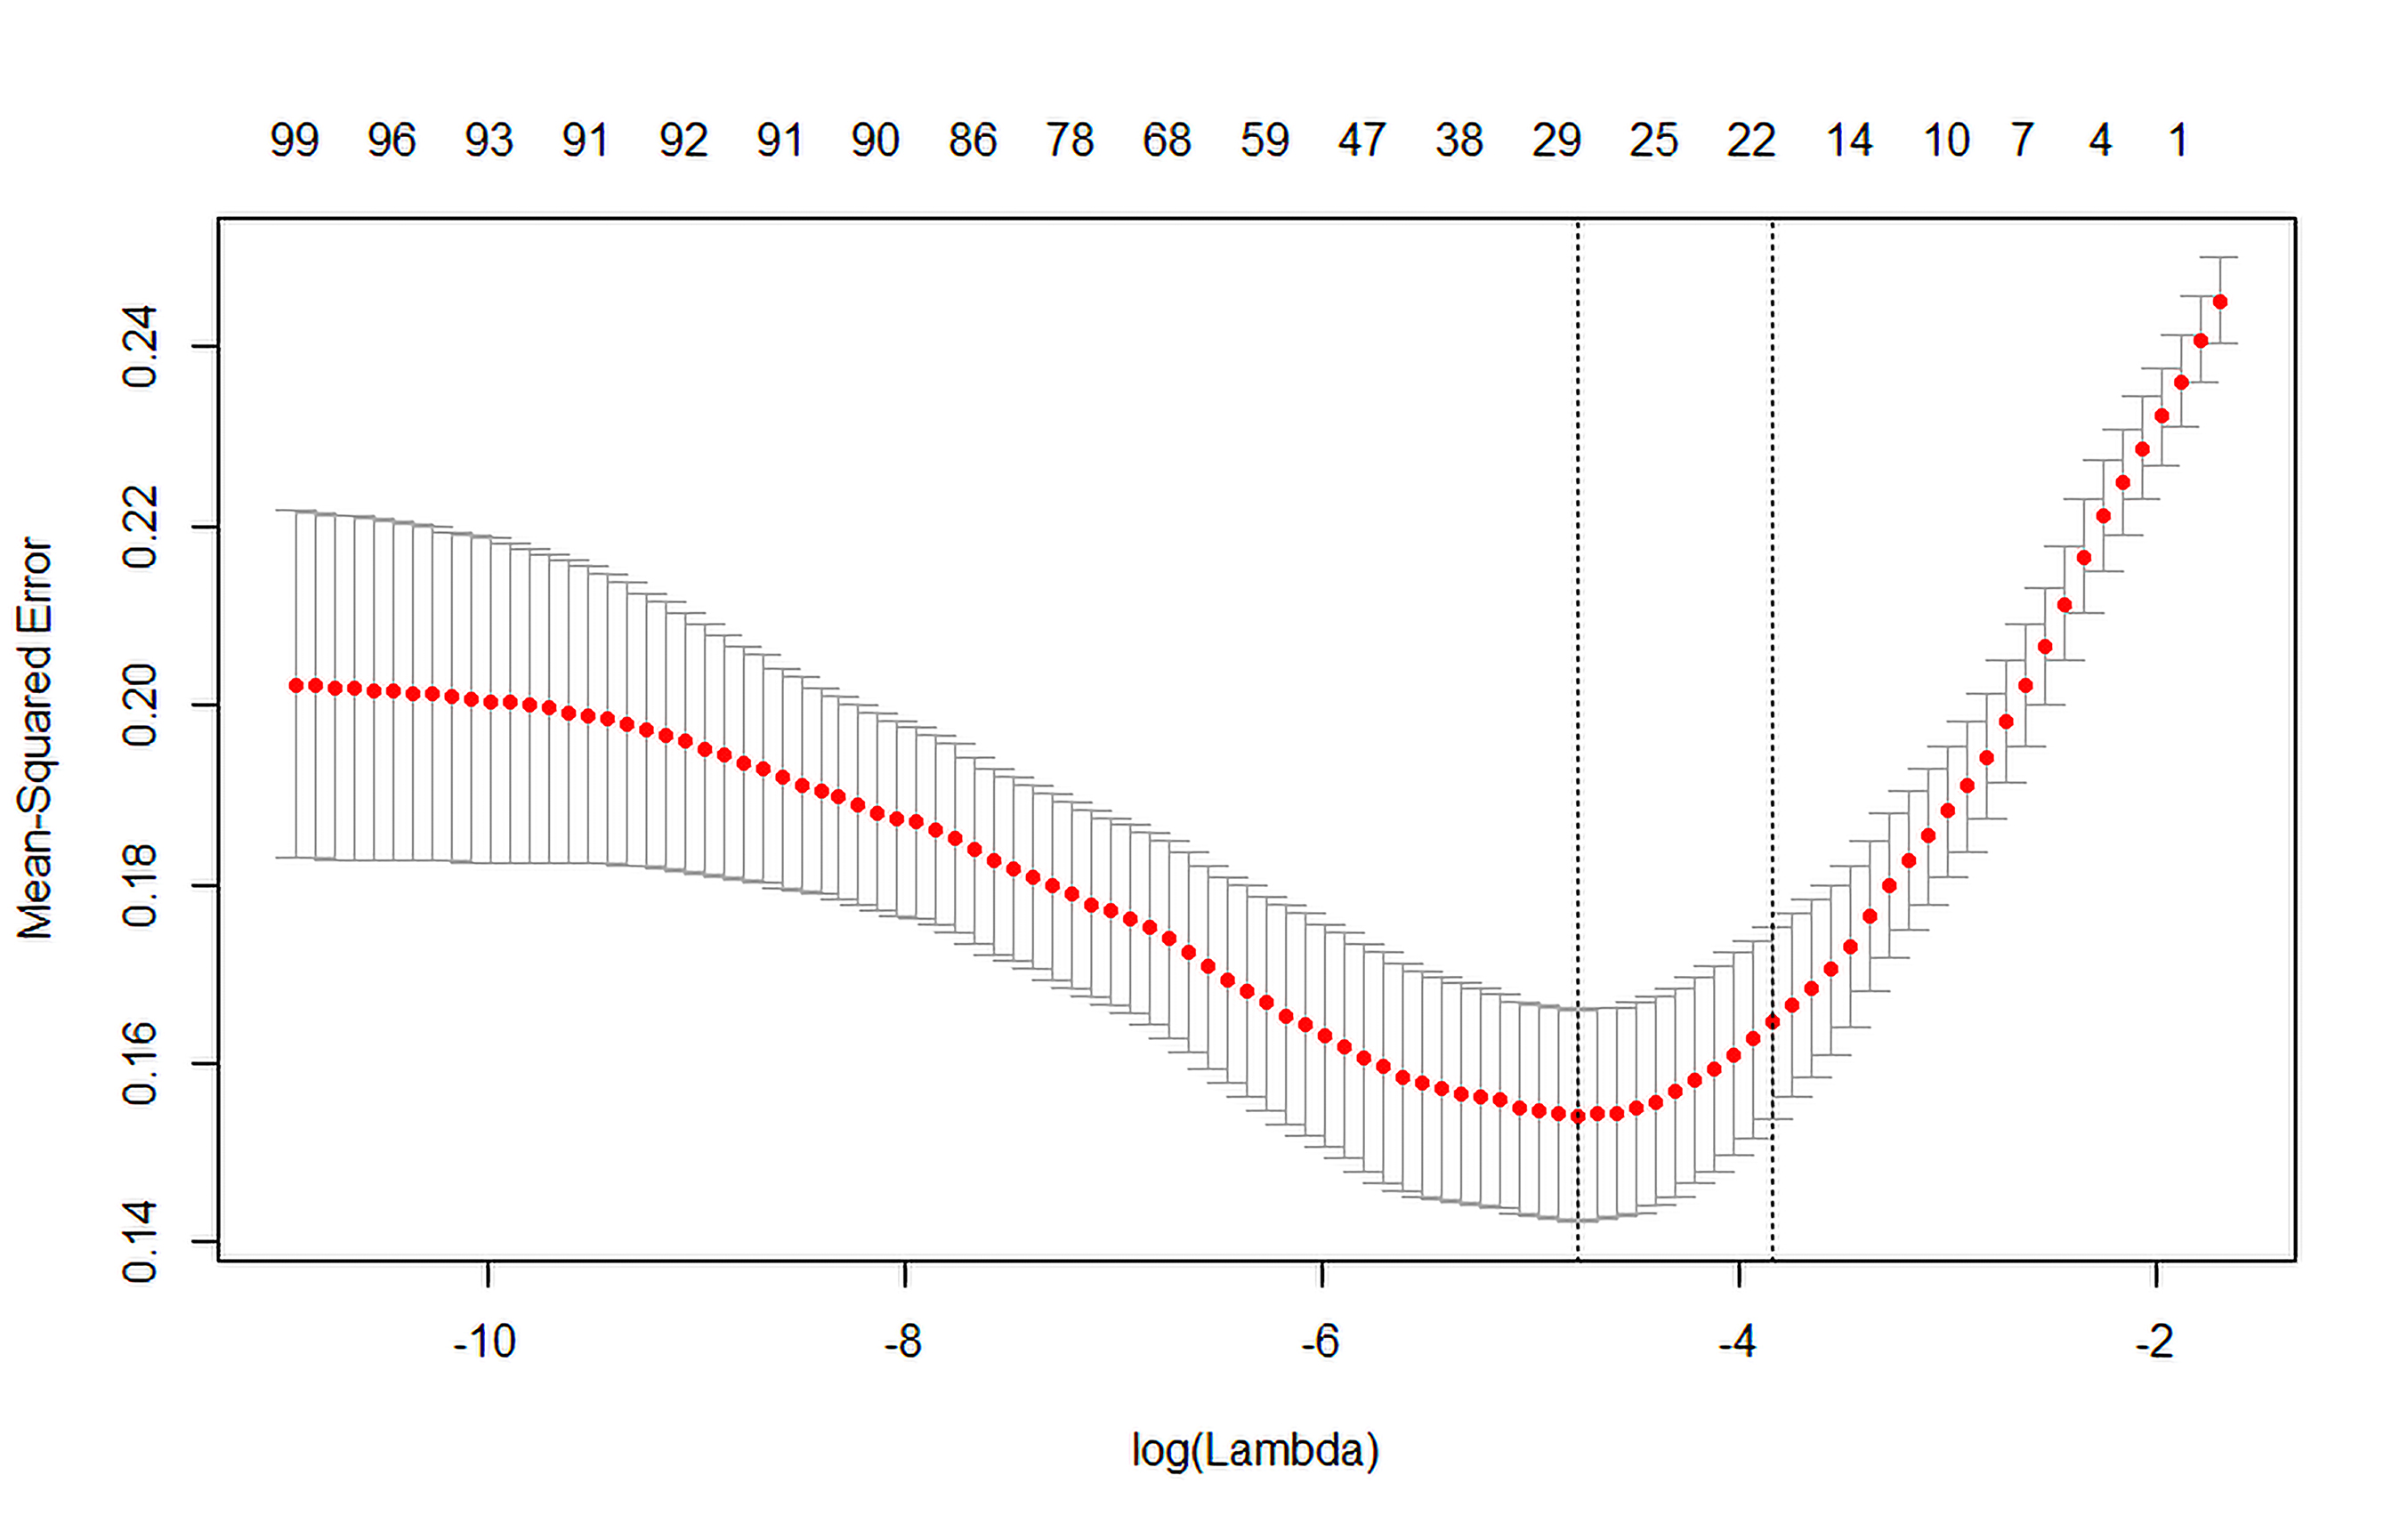
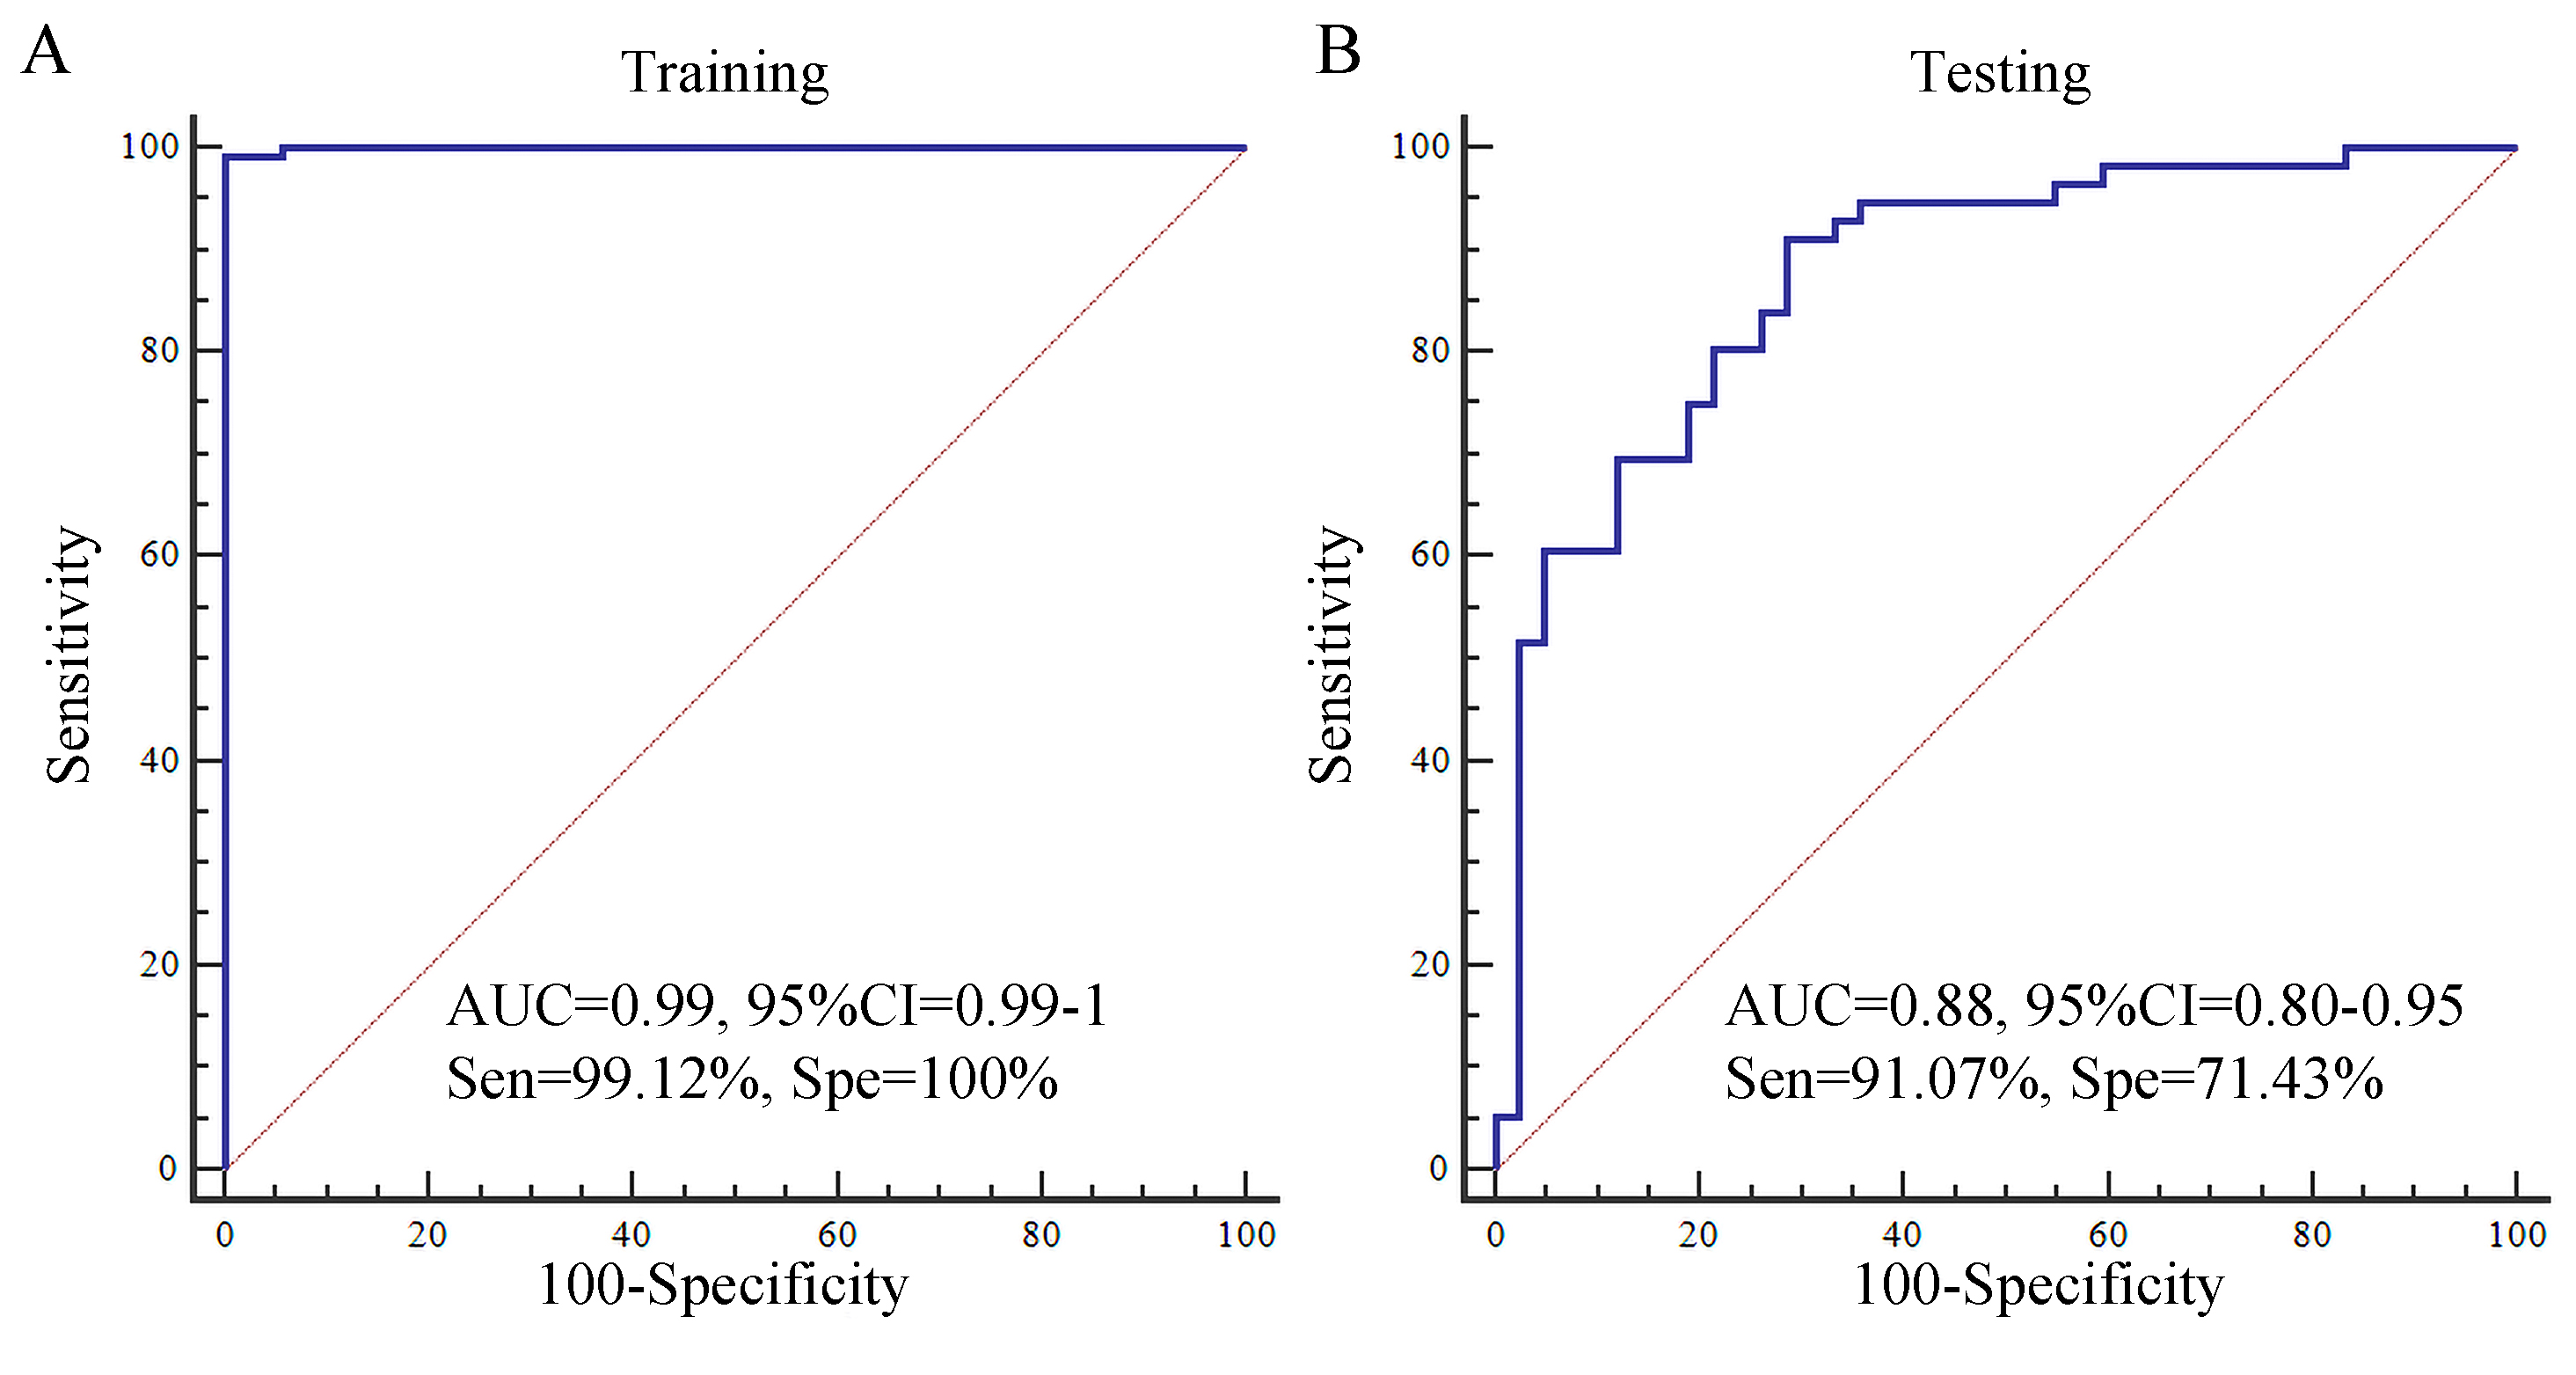
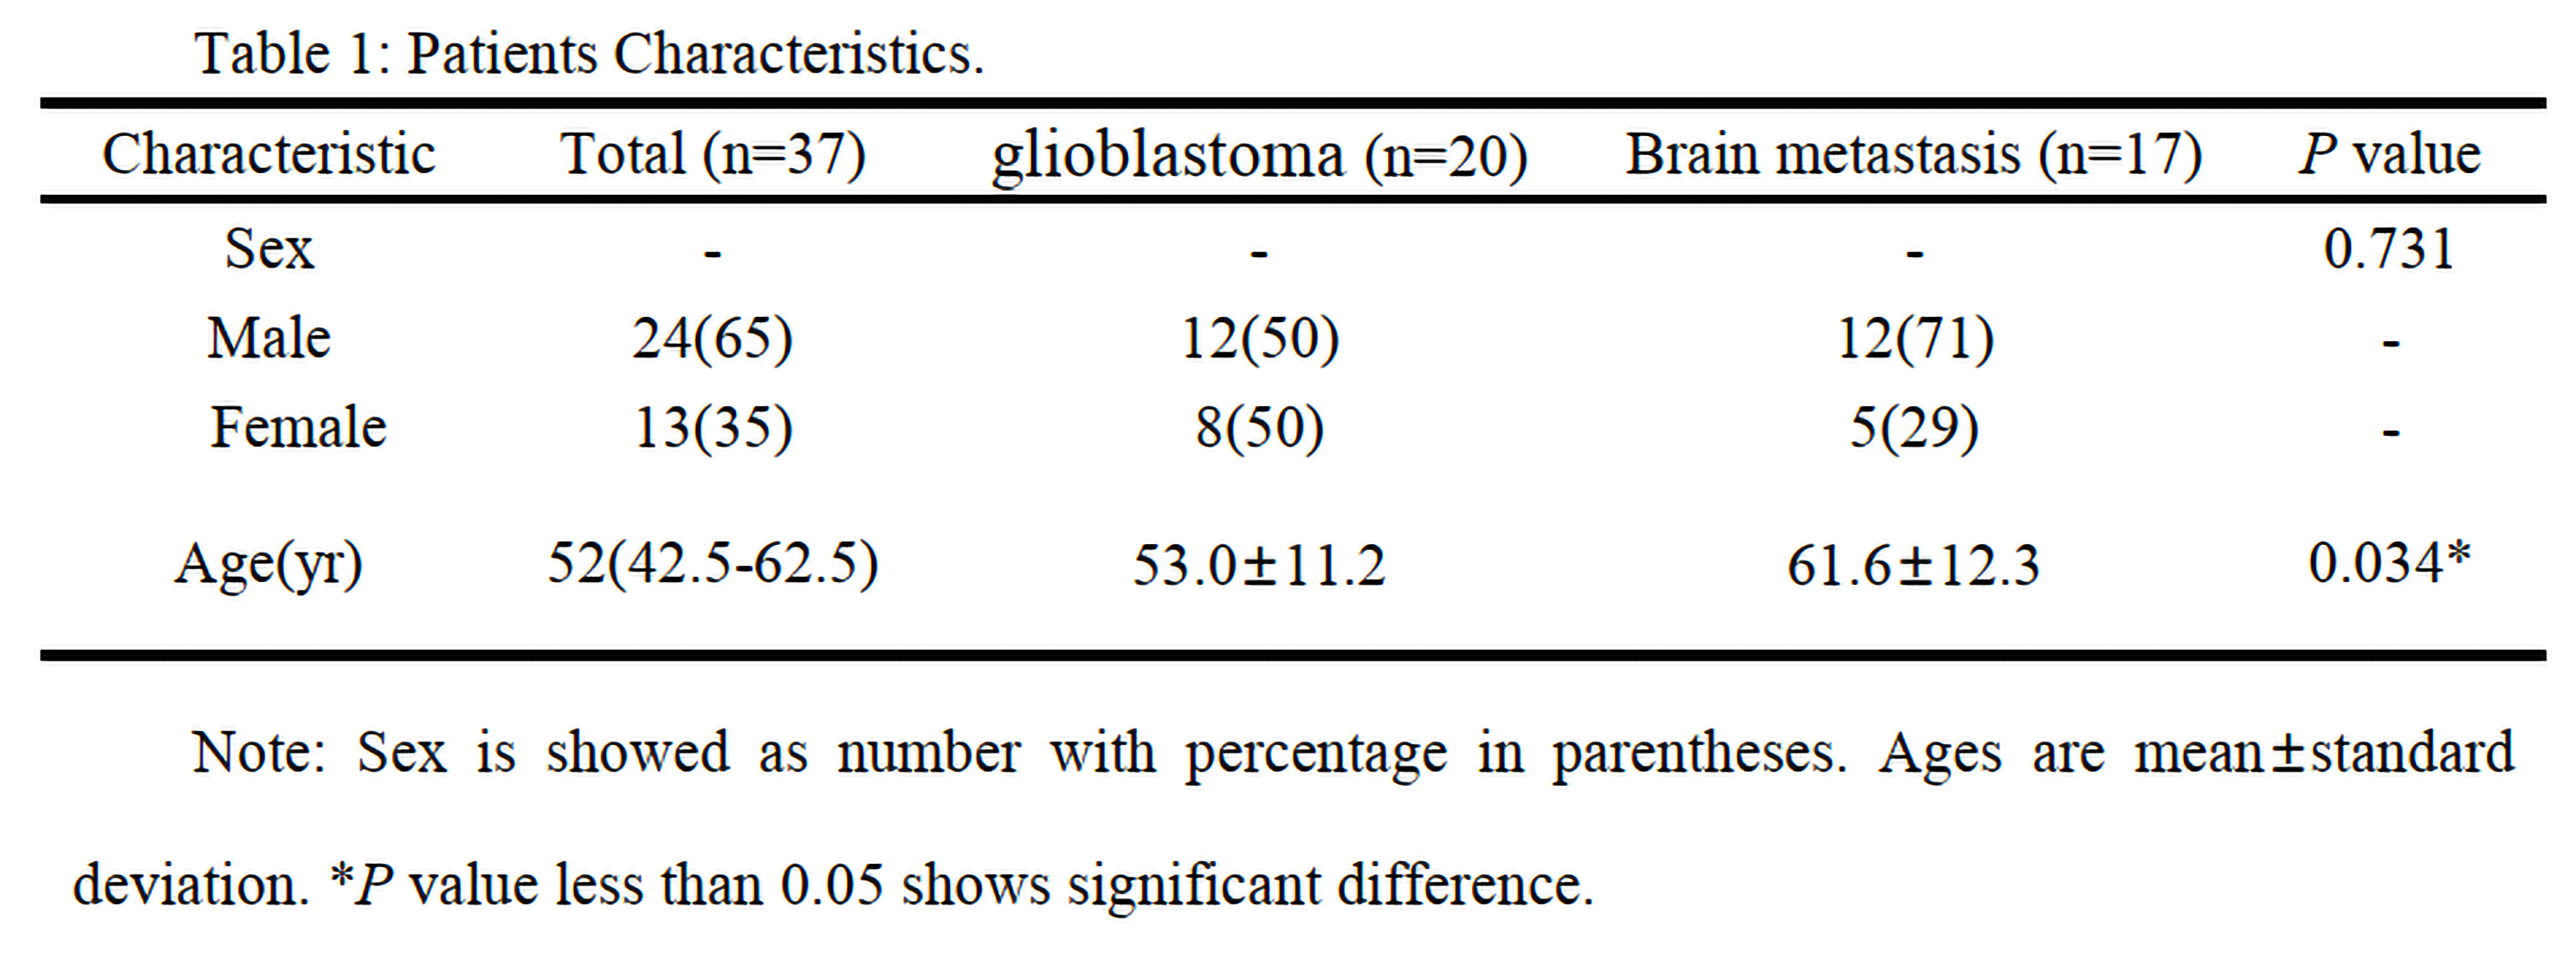
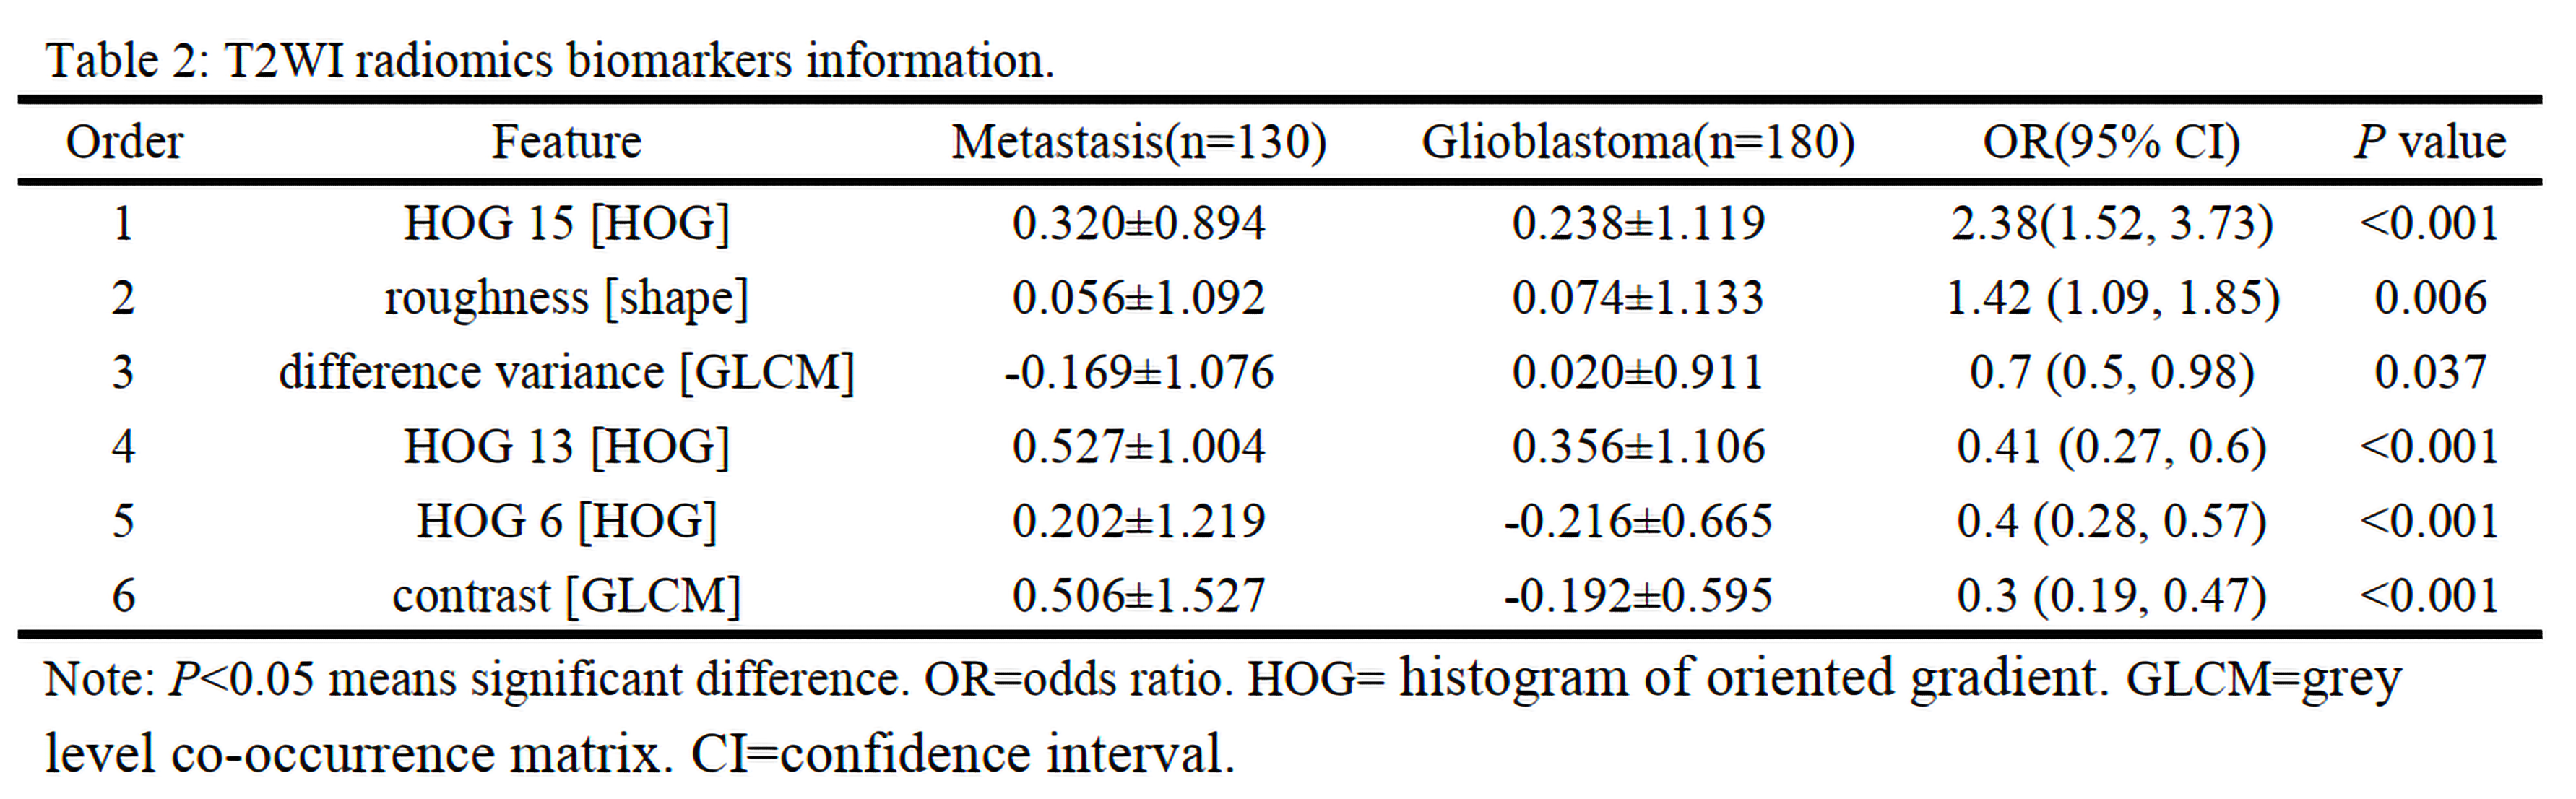
The clinical characteristics of 37 patients (20 glioblastomas with 180 slices and 17 brain metastases with 130 slices) were summarized in Table 1. No significant difference was found between two tumors for sex (P=0.731), while there was a significant difference for age (P=0.034). The LASSO regression showed that 29 features were significant important (Figure 2). Multiple logistic regression indicated that the HOG (HOG-6, HOG-13 and HOG-15 features), GLCM (contrast and difference variance features) and shape (roughness feature) were significant radiomics biomarkers between glioblastoma and brain solitary metastasis from lung cancer (Table 2). Using the radiomics biomarkers, the GBDT model showed good performance (Figure 3).Discussion
In this study, based on 155 radiomics features of T2WI detailing tumor pathology, we found that HOG, GLCM and shape features were significant important radiomics biomarkers for differentiating glioblastoma and brain solitary metastasis from lung cancer. Using those radiomics biomarkers, the GBDT model showed good diagnostic performance. This suggest the potential role of this method in clinical tumor diagnosis. Differently from brain solitary metastasis, glima presented peritumoral T2 prolongation on T2WI due to vasogenic edema and tumor infiltration [7]. In addition, shape of these two tumors showed remarkable difference. In detail, shape of glioma is complex, while brain solitary metastasis expands more homogeneously like a sphere [8]. Therefore, T2WI texture features may assisst the differentiation of the two tumors by quantifying the tumor’s pathologic characteristics. Previous studies has showed that the shape features may contribute to the distinguish ability between those two tumors[8]. The results of this study were also consistent with previous study. In addition, this study also found that GLCM and HOG also showed great potential for distinguishing the two tumors, which indicating the signal of the peritumoral edema was significant different. Finally, using those T2WI radiomics biomarkers, the GBDT model showed good diagnostic performance, which further confirming the importance of incorporating features to guide clinical applications. This result further indicated that it is convenient for some high-risk group patients (such as MR contrast agent allergy patients, pregnant women or infants) to use this model.Conclusion
This study indicated that the HOG, shape and GLCM features were the most important biomarkers for evaluating the T2WI differences between glioblastoma and brain solitary metastasis from lung cancer. The GBDT model based on the radiomics biomarker may provide an alternative way to assist the radiologists’ burdensome works in clinical practice.Acknowledgements
This study was supported by the National Key Research and Development Program of China (2016YFC0100300), National Natural Science Foundation of China (81471631, 81771810 and 51706178), the 2011 New Century Excellent Talent Support Plan of the Ministry of Education, China (NCET-11-0438) and the Clinical Research Award of the First Affiliated Hospital of Xi’an Jiaotong University (XJTU1AF-CRF-2015-004).References
1. Komori T. The 2016 WHO classification of tumours of the central nervous system: the major points of revision[J]. Neurologia medico-chirurgica, 2017, 57(7): 301-311.
2. Yamanaka R. Medical management of brain metastases from lung cancer[J]. Oncology reports, 2009, 22(6): 1269-1276.
3. Giese A, Westphal M. Treatment of malignant glioma: a problem beyond the margins of resection. Journal of cancer research and clinical oncology, 2001, 127(4): 217-225.
4. Bauer A H, Erly W, Moser F G, et al. Differentiation of solitary brain metastasis from glioblastoma multiforme: a predictive multiparametric approach using combined MR diffusion and perfusion[J]. Neuroradiology, 2015, 57(7): 697-703.
5. Van Griethuysen J J M, Fedorov A, Parmar C, et al. Computational radiomics system to decode the radiographic phenotype[J]. Cancer research, 2017, 77(21): e104-e107.
6. Dalal N, Triggs B. Histograms of oriented gradients for human detection[C]. IEEE. 2005. DOI : 10.1109/CVPR.2005.177.
7. Stummer W. Mechanisms of tumor-related brain edema[J]. Neurosurgical focus, 2007, 22(5): 1-7.
8. Blanchet L, Krooshof P W T, Postma G J, et al. Discrimination between metastasis and glioblastoma multiforme based on morphometric analysis of MR images[J]. American journal of neuroradiology, 2011, 32(1): 67-73.
Figures