1914
Identifying texture features that may serve as bio-markers of various subgroups of glioblastoma segmented using T1-perfusion MRI
Suhail Pathan Parvaze1, Mamta Gupta2, Anup Singh3, Rana Patir4, Sunita Ahlawat2, Madhura Ingalhalikar5, Neha Vats3, and Rakesh Kumar Gupta2
1Philips Innovation Campus, Bangalore, India, 2Fortis Memorial Research Institute, Gurgaon, India, 3Indian Institute of Technology, New Delhi, India, 4Department of Neurosurgery, Fortis Memorial Research Institute, Gurgaon, India, 5Symbiosis Center for Medical Image analysis, Symbiosis International University, Pune, India
1Philips Innovation Campus, Bangalore, India, 2Fortis Memorial Research Institute, Gurgaon, India, 3Indian Institute of Technology, New Delhi, India, 4Department of Neurosurgery, Fortis Memorial Research Institute, Gurgaon, India, 5Symbiosis Center for Medical Image analysis, Symbiosis International University, Pune, India
Synopsis
This work aimed at identifying radiomic signatures that discriminate glioblastoma sub-regions ( enhancing tumor, non-enhancing, necrosis and edema) using DCE T1 perfusion based post contrast MRI. Results demonstrated texture features that delineate the four regions as well as separate the tumoral region from normative white matter. These radiomic signatures can be further investigated to gain deeper understanding of tumor progression and recurrence.
Introduction
Glioblastoma (GBM) is the most common malignant brain tumor. Regardless of maximal safe surgery plus radiation therapy and chemotherapy, the prognosis of patients with GBM remains poor [1]. Since, the heterogeneity of GBM contributes to its poor diagnosis which can be, to some extent, attributed to its excessive heterogeneity. Biopsy samples only provide information about the tumor that is limited to the biopsy site and do not capture the complete spatial heterogeneity of the entire tumor. Non-invasive techniques can be developed to assess the heterogeneity that can reflect tumor biological properties more comprehensively. Investigations of texture variations in the tumor sub regions with emphasis on deriving radiomic signature reported to be challenging but essential in the diagnosis and prognostic studies involving multi-parametric MRI studies [2-3]. Machine learning approaches were used in diagnosis, prognosis, recurrence prediction and glioma grading studies [4-6]. Limited studies are available that depicts the prominent texture features in tumor sub regions. This work aims at identifying a radiomic signature to discriminate tumoral region from normative white matter (NAWM) as well as a radiomic differential marker for each sub-region of the tumor that can be pursued to assess progression and recurrence and in turn support treatment planning and optimization. Specifically, we aim to study the predictive potential of fully three-dimensional (3D) textural heterogeneity in perfusion driven segmented tumor sub-region masks on T1 post contrast image and 2) To identify any prominent texture based differential biomarker in the tumor sub region.Methods
In this study 40 Surgery naïve histological proven Glioblastoma (GBM) brain tumor subjects were considered. Multimodal image acquisition was performed on Philips Ingenia 3T scanner with a 15-channel head coil. DCE T1-perfusion MRI data analysis was done using in-house code. T1 perfusion parameters (CBV_NorrWM_Corr, CBF_Norr_WM, Ktrans, Ve, Vp) were computed [7]. Tumor subregions namely contrast enhancing tumor (ET) and Necrosis (NEC) was delineated with the aid of post contrast (T1GD) sequence and FLAIR images. Further, tumor subregions namely, non-enhancing tumor (NET) and edema (ED were delineated using FLAIR sequence and SVM classifier [7]. Further, a two dimensional binary masks was extracted for the whole tumor manually from the normal appearing region in all the tumor slices for each subject and considered as normative tissue. Radiomics based feature extraction was implemented using PyRadiomics 2.2.0 library [8]. 2D ROIs were converted to volumetric representation for radiomics feature extraction [9]. Radiomics features such as statistical features, Gray-Level Co-occurrence Matrix (GLCM), Gray-Level dependence matrix (GLDM), Gray Level Run Length Matrix (GLRLM), Gray Level Size Zone Matrix (GLSZM) and Neighboring Gray Tone Difference Matrix (NGTDM) along with shape features were computed. Shape features were not considered in this study as the prime focus is to understand the texture variations in the tumor sub regions. For each tumor region 106 radiomics features were computed. Same texture features were also extracted from the normative region [8]. Random forest based feature selection algorithm was implemented to extract most prominent features [10]. Random forest based classifier was further implemented to train 60% (24 subjects) of the data and the 40% (16 subjects) were held out for testing.Results
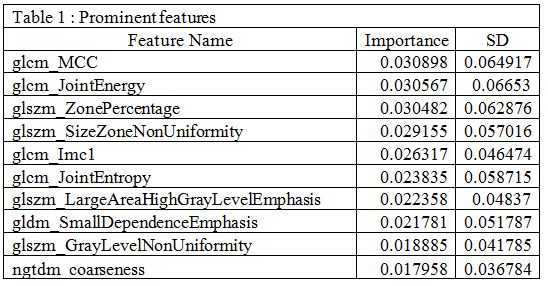
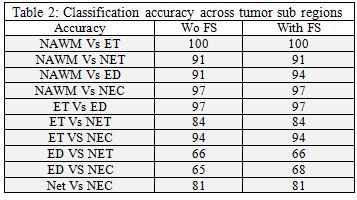
The pipeline of the work implemented as part of this study is demonstrated in Figure 1. The input sequences and feature maps overlaid on the representative images are shown in Figure 2. The overall test accuracy obtained was 73%. Table 1 displays the top ranked features, which were mainly texture based features. The classification accuracy across the tumor sub regions is shown in the Table 2. Texture features of the ET showed high accuracy from the ED and NEC regions, however, a subtle differentiation was observed from NET tumor region. Figure 3(a) represents comparison of NGTDM coarseness texture value. Higher values observed in the case of edema compared to NAWM and tumor sub regions. Especially ET and NET values seems to be very low suggesting uniformity is highly distorted. Figure 3(b) depicts GLCM joint entropy, which indicates ET region has highly randomized texture.Discussions and Conclusions
Results obtained in this study indicates that texture features obtained using PyRadiomics tool serve to differentiate the texture variation among the tumor subregions in glioblastoma. The increase in NGTDM coarseness in ED defines the uniformity in this particular region. A poor texture feature differentiation and low classification accuracy between ED and NEC regions might be due to the uniformity of features present in both the regions. However, the marginal accuracy between the ET and NET suggest that there exist common texture properties between the two which could be due to higher vascularisation. This study can be considered to be a first step in identifying radiomic biomarkers for GBM tissue types of texture features using Radiomics and machine learning approaches that appears to be differentiating tumor subregions from normal region and among themselves in the glioblastoma patients.Acknowledgements
No acknowledgement found.References
1. Blumenthal DT, Artzi M, Liberman G, et al. Classification of high-grade glioma into tumor and nontumor components using support vector machine. American Journal of Neuroradiology. 2017;38:908-14. 2. Kassner RE, Thornhill RE. Texture Analysis: A Review of Neurologic MR Imaging Applications. AJNR Am J Neuroradiol. 2010; 31: 809-816. 3. Galleno G, Bonilha L, Li LM, Cendes F. Texture analysis of medical images. Clin Radiol. 2004; 59:1061-1069. 4. Lasocki A, Gaillard F. Non-contrast-enhancing tumor: a new frontier in glioblastoma research. American Journal of Neuroradiology. 2019 ;40:758-65. 5. Ion-Mărgineanu A, Van Cauter S, Sima DM, Maes F et al. Classifying glioblastoma multiforme follow-up progressive vs. responsive forms using multi-parametric MRI features. Frontiers in neuroscience. 2017 ; 10:615. 6. Van der Voort SR, Incekara F, Wijnenga MM et al. Predicting the 1p/19q co-deletion status of presumed low grade glioma with an externally validated machine learning algorithm. Clinical Cancer Research. 2019;1127. 7. Sengupta A, Agarwal S, Gupta PK, et al. On differentiation between vasogenic edema and non-enhancing tumor in high-grade glioma patients using a support vector machine classifier based upon pre and post-surgery MRI images. European journal of radiology. 2018;106:199-208 8. Van Griethuysen JJ, Fedorov A, Parmar C, Hosny A, Aucoin N, Narayan V, Beets-Tan RG, Fillion-Robin JC, Pieper S, Aerts HJ. Computational radiomics system to decode the radiographic phenotype. Cancer research. 2017 ;77:104-7. 9. Xu J, Ma X, Tian Z et al. Glioblastoma Multiforme and Anaplastic Astrocytoma: Differentiation using MRI Texture Analysis. Frontiers in oncology. 2019; 9:876. 10. Beig N, Patel J, Prasanna P, Hill V et al. Radiogenomic analysis of hypoxia pathway is predictive of overall survival in Glioblastoma. Scientific reports. 2018;8:7.Figures
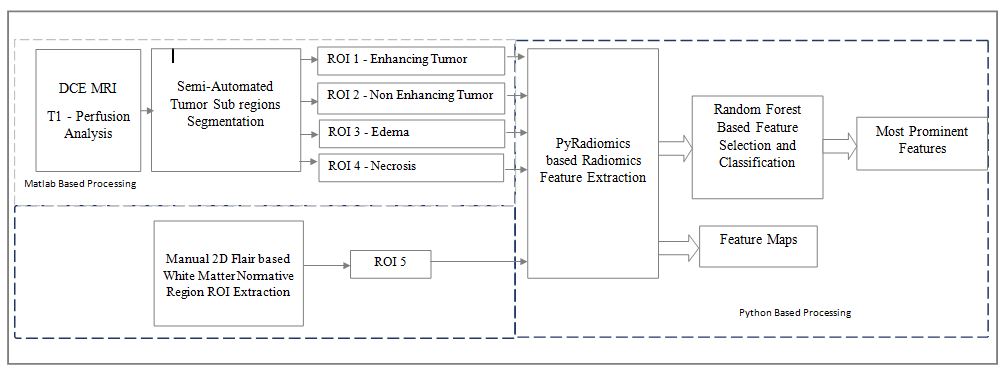
Figure 1: Block diagram representation of the pipeline
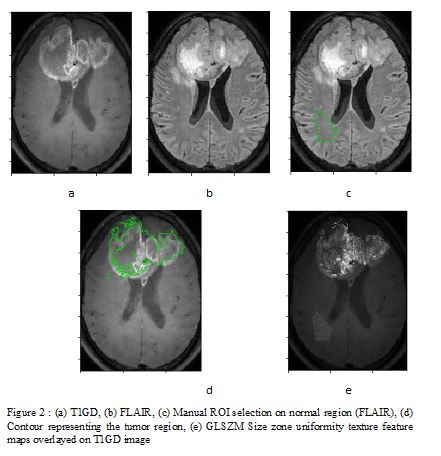
Figure 2 : (a) T1GD, (b) FLAIR, (c) Manual ROI selection on normal region (FLAIR), (d) Contour representing the tumor region, (e) GLSZM Size zone uniformity texture feature maps overlayed on T1GD image
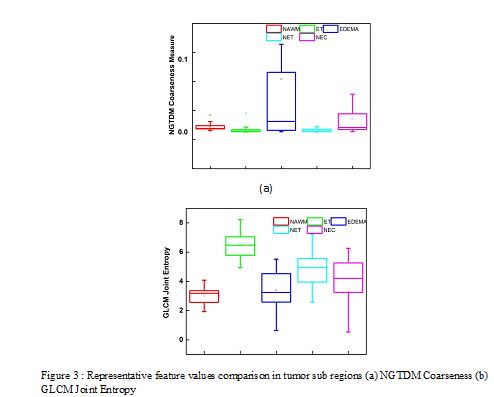
Figure 3 : Representative feature values
comparison in tumor sub regions (a) NGTDM Coarseness (b) GLCM Joint Entropy
Table
1 : Prominent features
Table
2: Classification accuracy across tumor sub regions