1911
A radiomics signature for supratentorial extra-ventricular ependymomas on multimodal MRI1Symbiosis Center for Medical Image Analysis, Symbiosis International University, Pune, India, 2Department of Radiology, National Institute of Mental Health and Neurosciences, Bengaluru, India
Synopsis
High grade supratentorial ependymomas in adults are rare neoplasms with imaging features that can often be confused for high grade gliomas. However, the pathogenesis of ependymoma’s differs significantly and it therefore crucial to determine pre-operative non-invasive markers for treatment planning and optimization. Our work creates a multi-variate 3-way classification framework based on multimodal MRI radiomics to discriminate supra-tentorial ependymomas, grade III and IV gliomas. Results demonstrate high accuracy with specific textures that evolve as the top discriminative features and can be pursued for clinical applicability.
Introduction
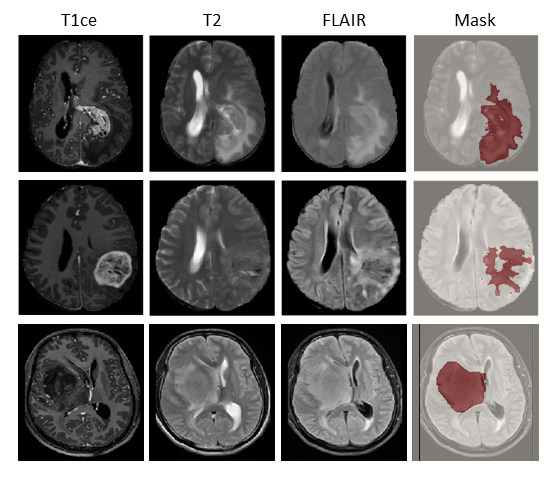
Supra-tentorial ependymomas are particularly rare neoplasms where more than 25% can be mis-diagnosed as high grade gliomas1. This is especially true for cerebral extra-ventricular ependymomas as the location may confound the diagnosis. The appearance of supra-tentorial, extra-ventricular ependymomas may closely resemble to that of high grade glioma with hypointense T1, hyperintense T2, intermediate to high signal on FLAIR, wreath like contrast enhancement on gadolinium enhanced T1, restricted diffusion in the solid mass in diffusion MRI and high blood volume on perfusion MRI2,3. Nonetheless, the pathogenesis and treatment strategy of ependymomas differs significantly. For example, chemotherapy as an adjuvant to resection for these patients is not included as part of the accepted standard of care4. It is therefore crucial to predict the tumor type preoperatively not only to support radiological prognosis and diagnosis non-invasively but also to optimize the treatment planning and its efficacy. This study aims to characterize supratentorial ependymomas using an underlying radiomics signature that not only predicts but also portrays the textural patterns that can mark the uniqueness of these neoplasms on MRI, discriminate these from grade III and grade IV gliomas and serve as a biomarker.Method
Our dataset included 14 patients (age 30.3 ± 13.6 yrs, M:F 8:6) with grade 2 and grade 3 supra-tentorial ependymomas (13 out of 14 were extra-ventricular in nature), 26 adult patients ( age 39.4 ± 10.97, M:F 16:10) with grade-4 gliomas and 35 adult patients (age 39.22 ± 12, M:F 21:14) with grade-3 gliomas (confirmed via histology). Multiple sequences were acquired as standard clinical MRI (on Philips 3T and Siemens 3T) however, we restricted our analysis to –gadolinium enhanced T1 weighted (T1ce), fluid attenuation inversion recovery (FLAIR) and T2 weighted imaging. (1) For T1ce scans: TR/TE= 8.7/3.1 ms was used with TFE sequence on Philips, and T1-MPRAGE with TR/TE=2200/2.3 on Siemens with 1*1*1 mm isotropic resolution (2) T2: TR/TE ranging from 3600-5500/80-90 ms and 0.5*0.5 mm resolution in the axial plane (3) FLAIR: TR/TE/T1= 11000/125/2800 ms with in plane resolution of 0.5x0.5mm. Pre-processing involved brain extraction, intensity normalization and bias correction followed by intra-subject inter-modality affine registration. Segmentation of tumoral region was performed using a convolutional auto-encoder (trained on BRATS-2018 data5) with 14 layers to identify FLAIR hyper-intensities regions from T2 and FLAIR images, and to identify enhancing and necrotic regions from T1ce images. The ROI masks predicted by the model were then corrected manually and cross-checked by an experienced neuro-radiologist. Radiomics feature extraction was performed using PyRadiomics 2.2.0 library6 and included shape, intensity, first order, and multiple textural features. Radiomic features were also computed on images that were filtered using Laplacian, wavelets, Gaussian, curvature flow, box mean and box sigma. A total number of 1409 features were extracted from each modality (4227 total- from 3 modalities). A 3-way random forest (RF) classifier7 was employed to train and 3-fold cross validate on 56 subjects and testing was carried out on remaining 19 subjects. Top 250 significant features were then computed using ANOVA F-value and feature importance was computed from the RF scores in each fold and aggregated across all folds.Results
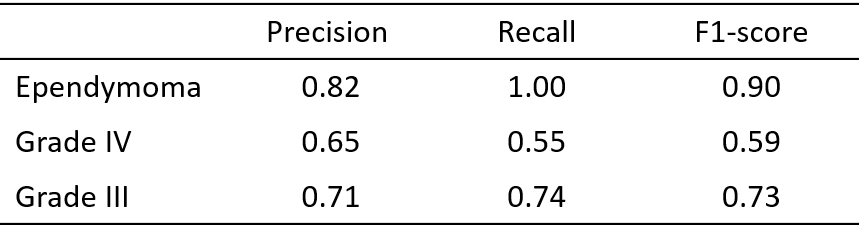
The RF classifier performed with a cross validation accuracy of 71.44% across 3 folds and a test accuracy of 73.1% (It is important to note that the baseline performance for three class classification is 33% and therefore 73.1% performance can be considered to be superior). The precision, recall and f1-scores corresponding to every class for three fold cross-validation are shown in table 1. The RF classifier had a recall score of 1.0 for the ependymoma class and hence was able to classify all the ependymoma cases accurately. The top twenty features based on the RF classifier score are shown in Fig. 3 with the mean and standard deviation values for the three groups under consideration. Most of these features extracted were textural-GLCM and GLDM; however, from the stationary wavelet transformed images.Conclusion
Our study facilitates a novel radiomics signature for supratentorial ependymoma’s in adults, which are rare and can be mis-diagnosed for high grade gliomas. In this study, thirteen of the fourteen cases of ependymomas located outside of the ventricles and therefore added to the complication in diagnosis. This work demonstrated that quantitatively we could create a signature for ependymoma’s using Radiomics and multi-variate classifiers to distinguish these from other simulating tumors such as grade IV and grade III gliomas with a high accuracy and sensitivity. Our framework can potentially support pre-operative clinical prognosis and aid in treatment planning.Acknowledgements
References
1. Leng, X., et al., Magnetic resonance imaging findings of extraventricular anaplastic ependymoma: A report of 11 cases. Oncol Lett, 2016. 12(3): p. 2048-2054.
2. Wu, J., T.S. Armstrong, and M.R. Gilbert, Biology and management of ependymomas. Neuro Oncol, 2016. 18(7): p. 902-13.
3. Shintaku, M. and K. Hashimoto, Anaplastic ependymoma simulating glioblastoma in the cerebrum of an adult. Brain Tumor Pathol, 2012. 29(1): p. 31-6.
4. Ruda, R., et al., EANO guidelines for the diagnosis and treatment of ependymal tumors. Neuro Oncol, 2018. 20(4): p. 445-456.
5. B.H. Menze, A. Jakab, S. Bauer et al., "The multimodal brain tumor image segmentation benchmark (BRATS)", IEEE Trans. Med. Imaging, vol. 34, no. 10, pp. 1993-2024, 2015.
6. van Griethuysen, J. J. M., Fedorov, A., Parmar, C., Hosny, A., Aucoin, N., Narayan, V., Beets-Tan, R. G. H., Fillon-Robin, J. C., Pieper, S., Aerts, H. J. W. L. (2017). Computational Radiomics System to Decode the Radiographic Phenotype. Cancer Research, 77(21), e104–e107.
7. Breiman, L., Random forests. Machine Learning, 2001. 45(1): p. 5-32.
Figures