1908
Radiomics Approach for Prediction of Recurrence in Pituitary Macroadenomas1Department of Medical Imaging, Chi Mei Medical Center, Tainan, Taiwan, 2Department of Pharmacy, Chia Nan University of Pharmacy and Science, Tainan, Taiwan, 3Department of Radiological Sciences, University of California, Irvine, CA, United States, 4E-Da Hospital/I-Shou University, Kaohsiung, Taiwan
Synopsis
A subset of nonfunctioning pituitary macroadenomas (NFMAs) show early progression/recurrence (P/R) after surgery. In clinical practice, one of the main challenges in the treatment of NFMAs is to determine factors that correlate with P/R. This study investigated the role of radiomics for the prediction of P/R in NFMAs. 50 patients diagnosed with benign NFMAs were studied. Totally 214 descriptors were extracted from the various MR sequences. The prediction accuracy of P/R was 82% and the AUC of the prediction model was 0.78.
Background and Purpose
Pituitary tumors constitute 10%-15% of all primary brain tumors [1]. Further, the nonfunctioning pituitary macroadenomas (NFMAs) (diameter larger than 10 mm) is the most frequent type of pituitary tumor [2]. Although most NFMAs are classified as benign adenoma based on the 2017 WHO classification system [3] , a subset of NFMAs have been shown to undergo early progression/recurrence (P/R) after surgical resection [4]. In clinical practice, gross-total resection (GTR) by a transsphenoidal approach (TSA) is the optimal treatment for NFMAs; however, this aim is often difficult to achieve for the NFMAs without apoplexy or cystic change [5]. Conventional MR imaging findings such as invasion of the cavernous sinus, tumor size, and absence of tumor apoplexy had been reported as the important parameters related to P/R in NFMAs [6]. However, the association of quantitative radiomics analysis for prediction of P/R in NFMAs has rarely been mentioned. In this study, we investigated the role of radiomics for the prediction of P/R in NFMAs.Materials and Methods
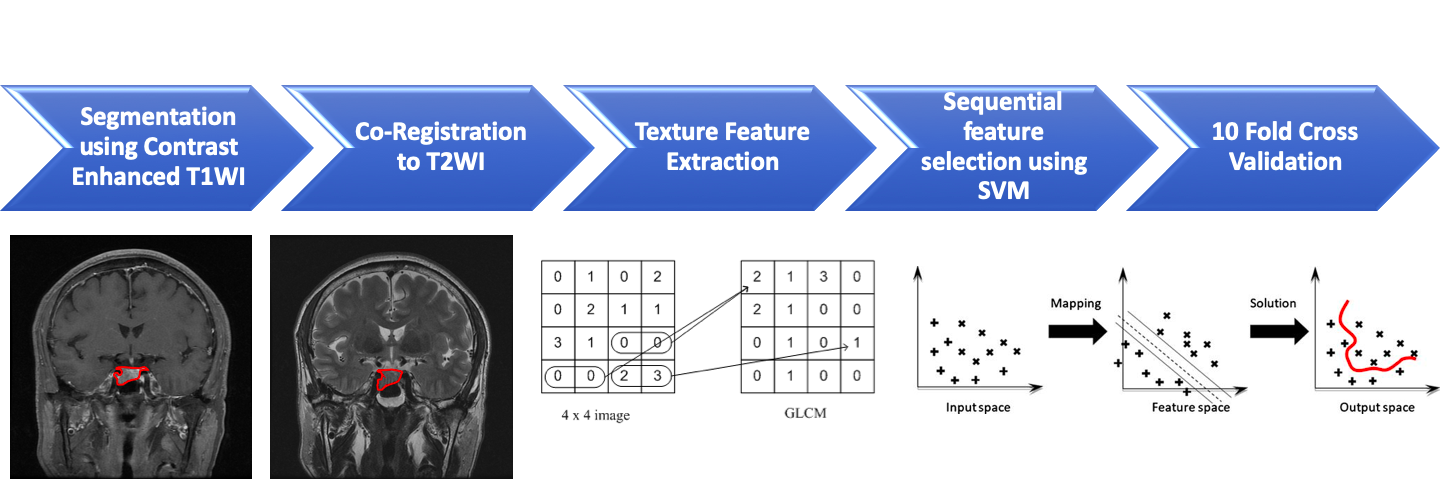
Fifty patients (age 19-80 years; median age, 52 years) included in this study were diagnosed with benign NFMAs by MRI and pathological confirmation. The median follow-up time was 38 months (range 12 - 129 months). Total of 28 patients were found to have P/R, and 22 patients remained stable disease. The MRI images were acquired using a 1.5T or a 3.0T scanner. The protocols of MR imaging included axial and sagittal spin echo T1-weighted imaging (T1WI), axial and coronal fast spin echo T2-weighted imaging (T2WI), axial fluid attenuated inversion recovery (FLAIR), and axial T2*-weighted gradient- recalled echo (GRE). Dynamic contrast-enhanced (CE) coronal T1WI images with a small field of view through the pituitary gland, as well as coronal and sagittal CE T1WI with fat saturation were performed. Figure 1 shows the workflow of the analysis process. The pituitary macroadenoma was segmented from the coronal post contrast enhancement images. For each lesion, the operator placed an initial rectangle region of interest (ROI) which can locate the lesion roughly, and also decided the beginning and ending slices that contained the lesion. Then the fuzzy c-mean (FCM) clustering based algorithm was developed to calculate the outline of the lesion ROI on each imaging slice [7]. After segmentation, the ROIs from all imaging slices containing this lesion were combined to obtain 3D information of the whole lesion. Then 3D connected-component labeling was applied to remove scattered voxels not connecting to the main lesion ROI, and hole-filling algorithm was applied to include all voxels contained within the main ROI which were labeled as non-lesion. The segmented tumor mask was co-registered to T2W images to localize the tumor location on corresponding images using affine transformation. This process was done by FLIRT [8]. Within segmented tumor on enhanced T1W images and T2W images , 32 first order features and 75 textural features were extracted on each modality. Thus, totally we obtained 214 descriptors. To evaluate the importance of these features in differentiate patients with and without tumor recurrence, sequential feature selection process was utilized via constructing multiple support vector machine (SVM) classifiers. 3 features with the highest importance, including T1 surface-to-volume ratio, T1 GLCM Informational Measure of Correlation, and T2 NGTDM Coarseness were selected to build the final SVM classification model with Gaussian kernel. 10 folds cross-validation method was applied to test the model performance. This procedure was implemented in MATLAB 2019b.Results
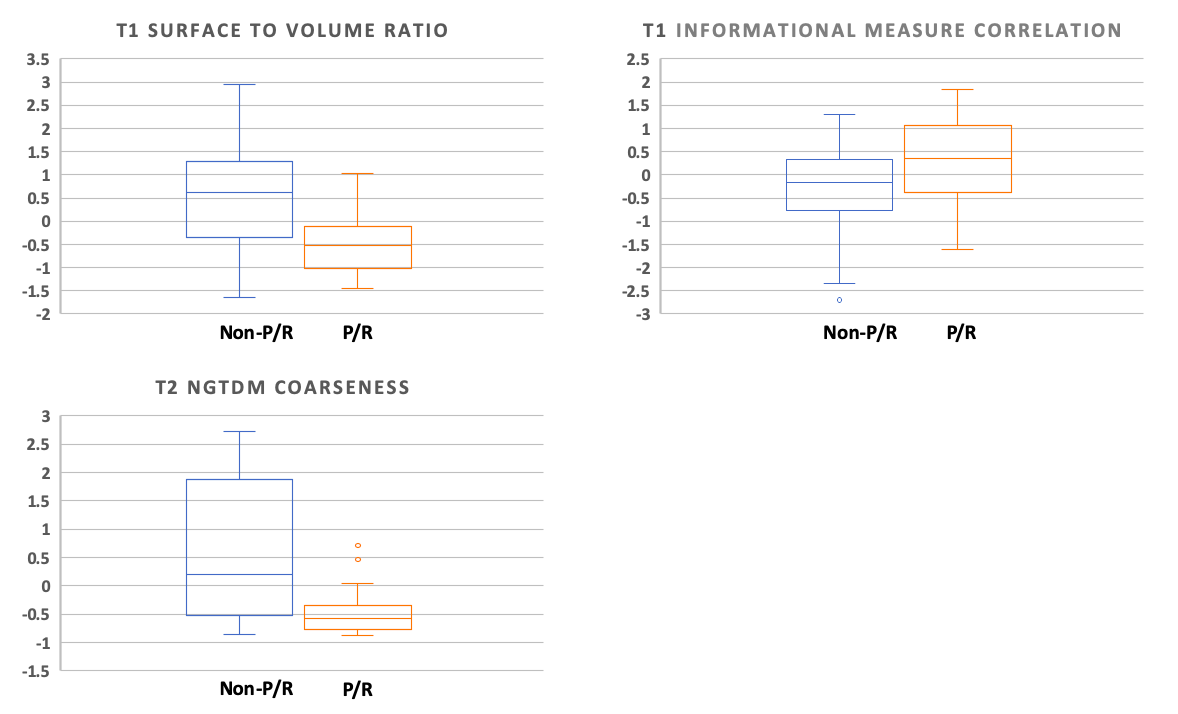
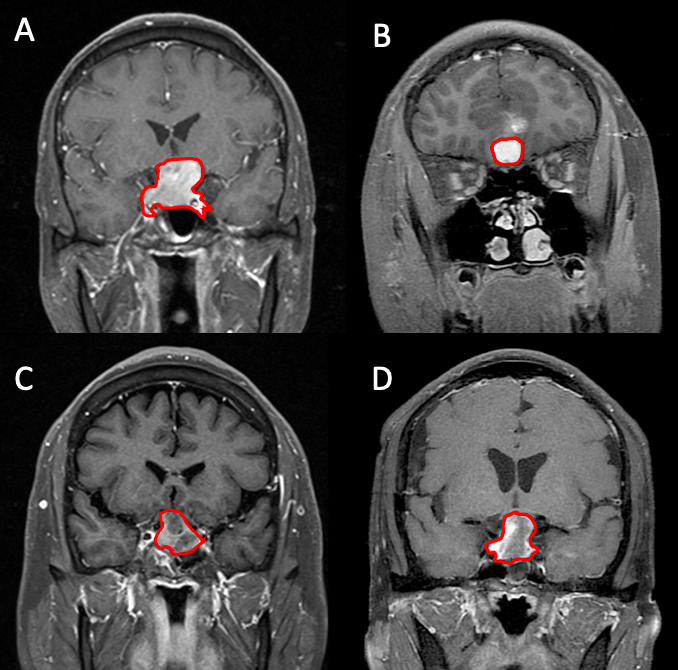
Of the 50 patients receiving TSA for pituitary macroadenoma, total 28 (28/50, 56%) patients had P/R in subsequent MRI follow up, and 22 (22/50, 44%) patients remained disease-free. The most significant three parameters selected by the final SVM prediction model for prediction of P/R were T1 surface-to-volume ratio, T1 GLCM Informational Measure of Correlation, and T2 NGTDM Coarseness. (Figure 2). The final SVM classification results showed 25 true positive cases, 16 true negative cases, 6 false positive cases, and 3 false negative cases (Figure 3). The overall prediction accuracy is 82% and the AUC of the prediction model is 0.78.Discussion
This study attempted to use radiomics approach in NFMAs for the prediction of P/R after operation. Our results showed that, with total 214 descriptors of first order features and textural features extracted from segmented tumor on contrast enhanced T1WI and T2W images, a prediction accuracy of 82% and an AUC of 0.78 of the prediction model were achieved.Acknowledgements
This study was supported in part by NIH/NCI Grant No. R01 CA127927, R21 CA170955, R21 CA208938 and R03 CA136071.References
1. Ostrom QT, Gittleman H, Farah P, Ondracek A, Chen Y, Wolinsky Y, Stroup NE, Kruchko C, Barnholtz-Sloan JS (2013) CBTRUS statistical report: Primary brain and central nervous system tumors diagnosed in the United States in 2006-2010. Neuro Oncol 15 Suppl 2:ii1-56. doi:10.1093/neuonc/not151
2. Molitch ME (2008) Nonfunctioning pituitary tumors and pituitary incidentalomas. Endocrinology and metabolism clinics of North America 37 (1):151-171, xi. doi:10.1016/j.ecl.2007.10.011
3. Lloyd RV, Osamura RY, Klöppel G, Rosai J (2017) WHO Classification of Tumours of Endocrine Organs ed
4. IARC Press, Lyon 4. Roelfsema F, Biermasz NR, Pereira AM (2012) Clinical factors involved in the recurrence of pituitary adenomas after surgical remission: a structured review and meta-analysis. Pituitary 15 (1):71-83
5. Boxerman JL, Rogg JM, Donahue JE, Machan JT, Goldman MA, Doberstein CE (2010) Preoperative MRI evaluation of pituitary macroadenoma: imaging features predictive of successful transsphenoidal surgery. AJR American journal of roentgenology 195 (3):720-728. doi:10.2214/ajr.09.4128
6. Brochier S, Galland F, Kujas M, Parker F, Gaillard S, Raftopoulos C, Young J, Alexopoulou O, Maiter D, Chanson P (2010) Factors predicting relapse of nonfunctioning pituitary macroadenomas after neurosurgery: a study of 142 patients. European journal of endocrinology 163 (2):193-200. doi:10.1530/eje-10-0255
7. Nasrabadi NM (2007) Pattern recognition and machine learning. Journal of electronic imaging 16 (4):049901
8. Jenkinson M, Bannister P, Brady M, Smith S (2002) Improved optimization for the robust and accurate linear registration and motion correction of brain images. Neuroimage 17 (2):825-841
Figures