1907
Radiomics and Machine Learning for Prediction of Recurrence in Meningiomas1Department of Medical Imaging, Chi Mei Medical Center, Tainan, Taiwan, 2Department of Pharmacy, Chia Nan University of Pharmacy and Science, Tainan, Taiwan, 3Department of Radiological Sciences, University of California, Irvine, CA, United States, 4E-Da Hospital/I-Shou University, Kaohsiung, Taiwan
Synopsis
A subset of benign meningiomas may show early progression/recurrence (P/R) after surgery. In clinical practice, one of the main challenges in the treatment of meningiomas is to determine factors that correlate with P/R. This study investigated the role of radiomics and machine learning for the prediction of P/R in meningiomas. 128 patients diagnosed with WHO grade I meningioma were studied. Total 214 descriptors were extracted from the various MR sequences. The prediction accuracy of P/R was 74% and the AUC of the prediction model was 0.80.
Background and Purpose
Meningiomas are the most common commonly diagnosed primary brain tumors [1]. Although most meningiomas are classified as benign tumors according to the 2016 WHO classification system [2], a subset of these tumors may show early progression/ recurrence (P/R) after surgical resection [3,4]. Further, the rate of P/R is relatively high in tumors difficulty in achieving gross total resection, such as for parasagittal and skull base meningiomas [5,6]. The conventional MR imaging findings such as tumor size, bone invasion, dural tail sign, and proximity to major sinuses had been reported as the important variables related to P/R [3,6]. However, quantitative radiomics analysis for prediction of P/R in meningiomas is rare. Thus, we investigated the role of radiomics and machine learning for the prediction of P/R in meningiomas in this study.Materials and Methods
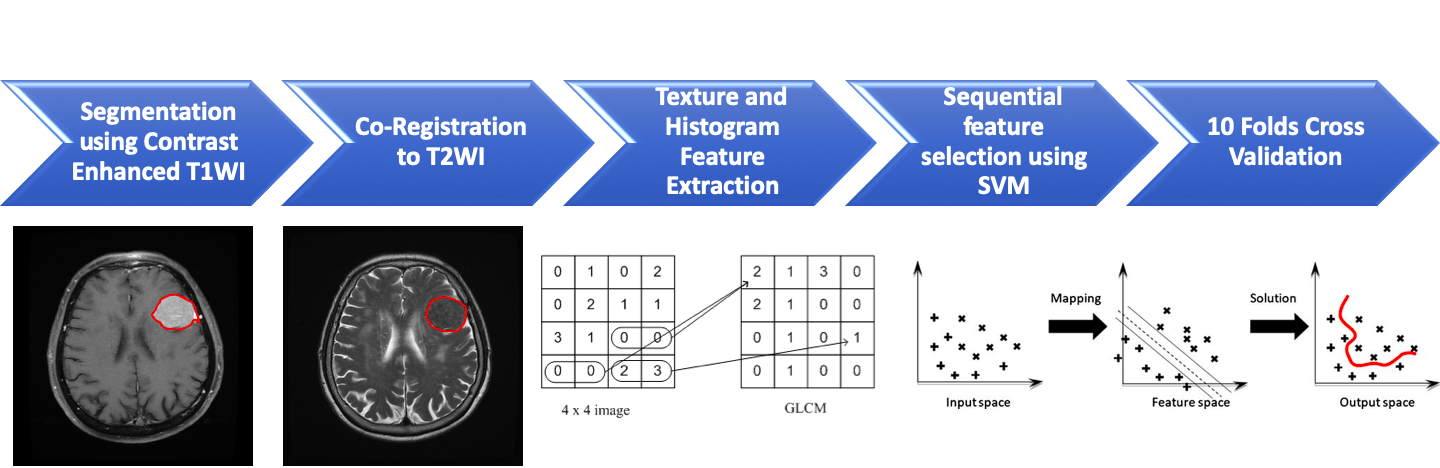
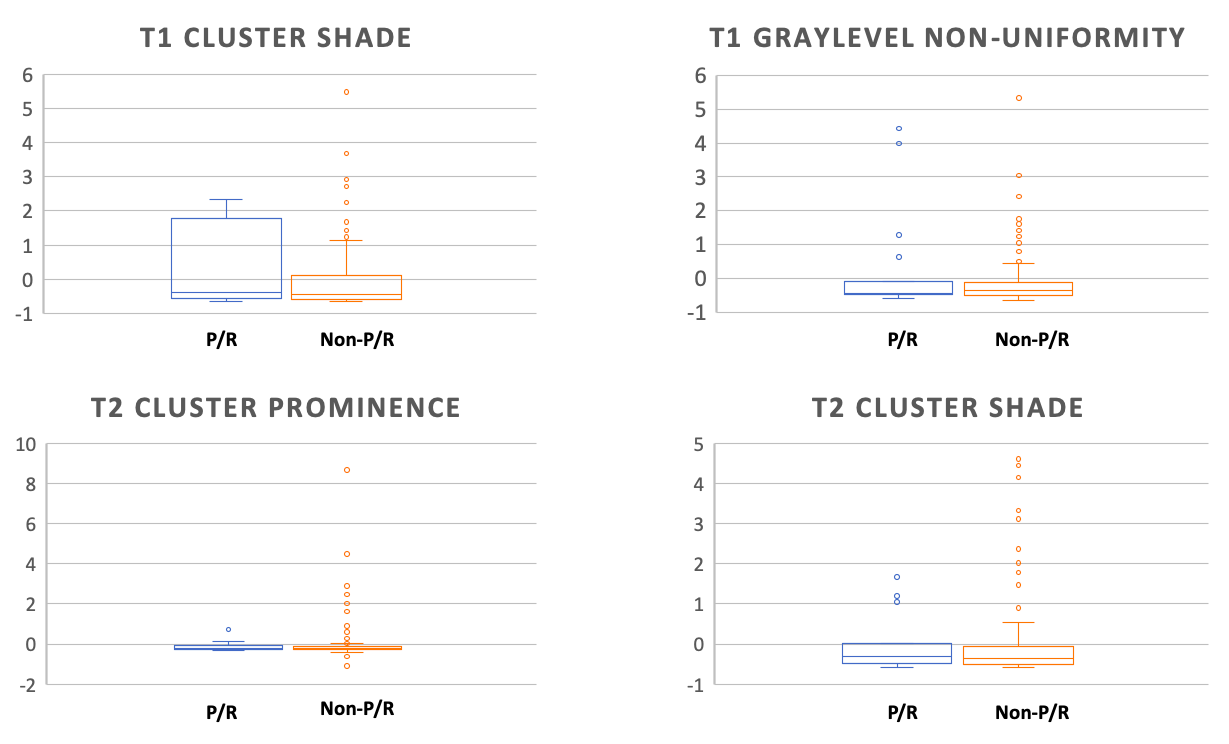
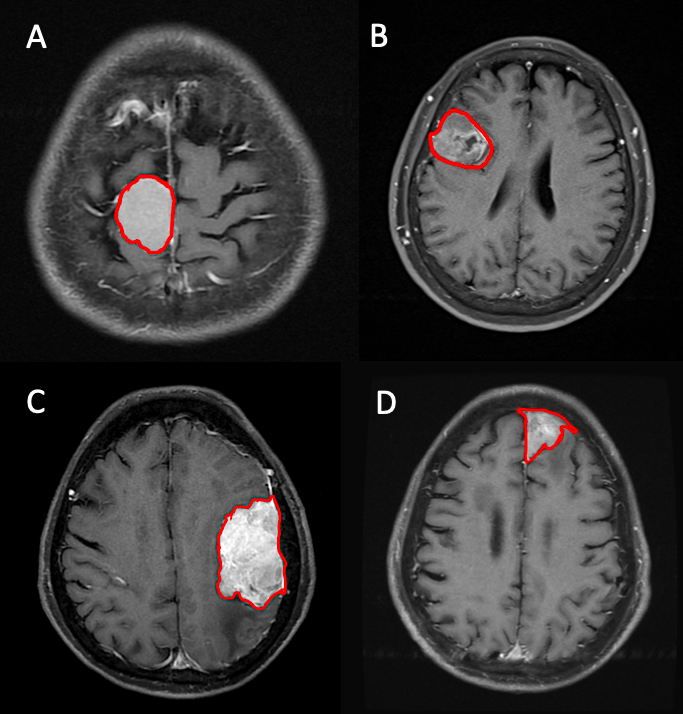
128 patients (age 26 – 84 years; median age, 57 years) included in this study were diagnosed with WHO grade I meningiomas by MRI and pathological confirmation. The median follow-up time was 40 months (range 12 - 118 months). A total of 19 (19/128, 14.8%) patients were found to have P/R, and 109 patients remained disease-free or without any sign of progression. The MRI images were acquired using a 1.5T or a 3.0T scanner. The protocols of MR imaging included axial and sagittal spin echo T1-weighted imaging (T1WI), fast spin-echo T2-weighted imaging (T2WI), fluid attenuated inversion recovery (FLAIR), T2*-weighted gradient-recalled echo (GRE), contrast-enhanced (CE) T1WI in axial and coronal sections, and diffusion weighted imaging (DWI). Figure 1 shows the flowchart of the analysis process. The lesion was segmented from subtracted contrast enhancement images. Then the outline of the lesion ROI on each imaging slice was automatically obtained using the fuzzy c-means (FCM) clustering based algorithm [7]. The ROIs from all imaging slices containing this lesion were combined to obtain 3D information of the whole lesion. Then 3D connected-component labeling was applied to remove scattered voxels not connecting to the main lesion ROI, and hole-filling to include all voxels contained within the main ROI which were labeled as non-lesion. The segmented tumor mask was co-registered to T2W images to localize the tumor location on corresponding images using affine transformation. This process was done by FLIRT [8]. Within segmented tumor on enhanced T1W images and T2W images , 32 first order features and 75 textural features were extracted on each modality. Thus, totally we obtained 214 descriptors. To evaluate the importance of these features in differentiate patients with and without recurrence, sequential feature selection process was utilized via constructing multiple support vector machine (SVM) classifiers. 4 features with the highest importance, including T1 GLCM cluster shade, T1 GLSZM grey level non-uniformity, T2 GLCM cluster prominence, and T2 GLCM cluster shade were selected to build the final SVM classification model with Gaussian kernel [9]. 10 folds cross-validation method was applied to test the model performance [10]. This procedure was implemented in MATLAB 2019b.Results
Of the 128 patients, 19 (19/128, 14.8%) patients were found to have P/R, and 109 (109/128, 85.2%) patients remained disease-free. The most significant four parameters selected by the SVM prediction model for differentiation of P/R were T1 GLCM cluster shade, T1 GLSZM grey level non-uniformity, T2 GLCM cluster prominence, and T2 GLCM cluster shade (Figure 2). The final classification results showed 14 true positive cases, 81 true negative cases, 28 false positive cases, and 5 false negative cases (Figure 3). The overall prediction accuracy is 74% and the AUC of the prediction model is 0.80.Discussion
This study attempted to use radiomics and machine learning for prediction of P/R in meningiomas after surgery. Our results showed that, with total 214 descriptors of first order features and textural features extracted from segmented tumor on contrast enhanced T1WI and T2W images, a prediction accuracy of 74% and an AUC of 0.80 of the prediction model were achieved.Acknowledgements
This study was supported in part by NIH/NCI Grant No. R01 CA127927, R21 CA170955, R21 CA208938 and R03 CA136071.References
1. Wiemels J, Wrensch M, Claus EB (2010) Epidemiology and etiology of meningioma. J Neurooncol 99 (3):307-314. doi:10.1007/s11060-010-0386-3
2. Louis DN, Perry A, Reifenberger G, Von Deimling A, Figarella-Branger D, Cavenee WK, Ohgaki H, Wiestler OD, Kleihues P, Ellison DW (2016) The 2016 World Health Organization classification of tumors of the central nervous system: a summary. Acta neuropathologica 131 (6):803-820
3. Ildan F, Erman T, Gocer AI, Tuna M, Bagdatoglu H, Cetinalp E, Burgut R (2007) Predicting the probability of meningioma recurrence in the preoperative and early postoperative period: a multivariate analysis in the midterm follow-up. Skull base : official journal of North American Skull Base Society [et al] 17 (3):157-171. doi:10.1055/s-2007-970554
4. Maillo A, Orfao A, Espinosa AB, Sayagues JM, Merino M, Sousa P, Lara M, Tabernero MD (2007) Early recurrences in histologically benign/grade I meningiomas are associated with large tumors and coexistence of monosomy 14 and del(1p36) in the ancestral tumor cell clone. Neuro Oncol 9 (4):438-446. doi:10.1215/15228517-2007-026
5. Savardekar A, Patra D, Bir S, Thakur J, Mohammed N, Bollam P, Georgescu M, Nanda A (2017) Differential tumor progression patterns in skull base versus non-skull base meningiomas: A critical analysis from a long-term follow-up study and review of literature. World neurosurgery
6. Escribano Mesa JA, Alonso Morillejo E, Parron Carreno T, Huete Allut A, Narro Donate JM, Mendez Roman P, Contreras Jimenez A, Pedrero Garcia F, Masegosa Gonzalez J (2018) Risk of Recurrence in Operated Parasagittal Meningiomas: A Logistic Binary Regression Model. World neurosurgery 110:e112-e118. doi:10.1016/j.wneu.2017.10.087
7. Nasrabadi NM (2007) Pattern recognition and machine learning. Journal of electronic imaging 16 (4):049901
8. Jenkinson M, Bannister P, Brady M, Smith S (2002) Improved optimization for the robust and accurate linear registration and motion correction of brain images. Neuroimage 17 (2):825-841
9. Tong S, Chang E (2001) Support vector machine active learning for image retrieval. Proceedings of the ninth ACM international conference on Multimedia: p. 107-118.
10. Friedman J, Hastie T, Tibshirani R (2001) The elements of statistical learning: Springer series in statistics New York, NY, USA.
Figures