1903
Automatic feature extraction and machine learning prediction of stroke functional outcome based on histogram information of baseline ADC1Clinical Research Institute, Samsung Medical Center, Sungkyunkwan Univ. Sch. of Med., Seoul, Republic of Korea, 2Department of Neurology, Samsung Medical Center, Sungkyunkwan Univ. School of Medicine, Seoul, Republic of Korea
Synopsis
This study demonstrates an automatic method that predicts favorable/unfavorable clinical outcome based on pre-treatment DWI data and machine learning (ML) in acute ischemic stroke. We present the use of ADC histogram information in the brain tissue as features for the ML prediction. In the histogram analysis, the 5 or 10 percentile value of the ADC distribution was indicative of clinical outcome regardless of success/failure of recanalization. The ROC analysis in unseen test subjects resulted in an area under the curve (AUC) of 0.79 with the proposed feature extraction, which was greater than 0.71 with the DWI lesion volume only.
Introduction
Baseline acute stroke neuroimaging data provide important clinical information in selecting patients for treatment and in predicting clinical outcome.1, 2 Conventionally, diffusion weighted imaging (DWI) and perfusion weighted imaging (PWI) lesion volumes are measured, based on fixed thresholds (e.g., ADC < 600*10-6 mm2/s and Tmax > 6 s), and the (PWI-DWI) mismatch volume is a good indicator of how much ischemic tissue would be salvageable via revascularization. The threshold values often depend on sequence parameters, scanner vendors, and software tools, and may vary depending on research centers.Recently, machine learning methods were developed to promote supervised learning, overcome the issue of the validity of the chosen thresholds, and improve clinical outcome prediction.3, 4 A recent study relevant to our work investigated the use of DWI and PWI image data for predicting thrombolysis outcome based on machine learning models.5 However, it required computational complexity, especially in processing dynamic PWI data. In this study, we present an automatic method that extracts the histogram information of ADC in the tissue and uses the trained model to predict favorable/unfavorable clinical outcome.
Methods
Data AcquisitionA total of 116 subjects with anterior circulation stroke underwent MRI scans within 24-hour from symptom onset, and were considered for this study. MRI scan parameters were as follows: Philips 3 Tesla, repetition time = 3 s, echo time = 81 to 88 ms, number of slices = 22, image matrix size = 256 x 256, pixel spacing = 0.9375 x 0.9375 mm2, and spacing between slices = 6.5 mm. DWI imaging was performed at two different b-values, 0 and 1000 s/mm2. Apparent diffusion coefficient (ADC) images were computed based on pixel-wise fitting.
Image Pre-Processing
Brain tissue extraction was automatically performed slice-by-slice (i.e., center out slice ordering) by taking the DWI b=1000 images and using level set segmentation in which the initial level set function is an outer circle enclosing the brain tissue. We excluded the CSF regions by thresholding ADC values greater than 1,200*10-6 mm2/s and setting them to 0.
Machine Learning
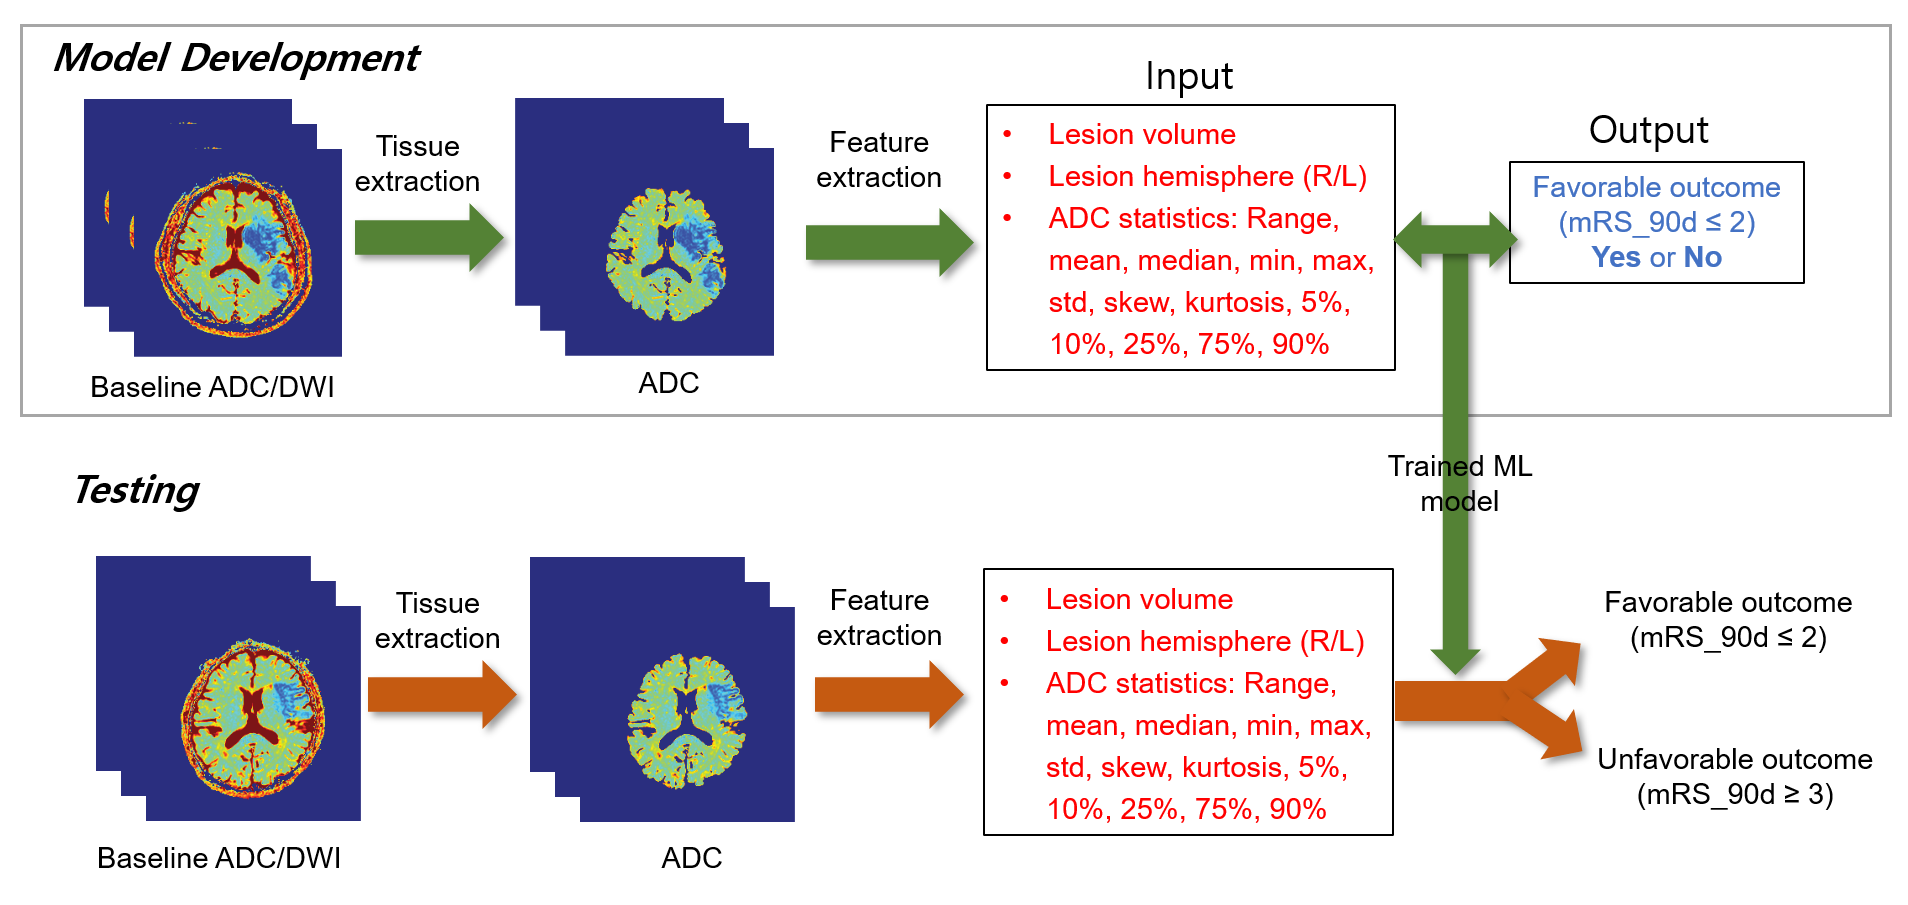
The ADC values within the brain tissue were obtained from all the slices except for the start and end slices. Diffusion lesion volume was estimated using a pre-trained U-Net model6 and was used as a feature. Favorable clinical outcome was defined as a modified Rankin Scale (mRS) at 90 days of 0 – 2, while unfavorable clinical outcome was defined as an mRS at 90 days of 3 – 6. Of the 116 subjects, 81 subjects were used for model development, while 35 subjects were reserved for testing. Three-fold cross-validation was performed using randomized search for hyperparameter optimization of a random forest classifier in Scikit-learn.7 Figure 1 illustrates a schematic of the proposed feature extraction and machine learning method for outcome prediction.
Results
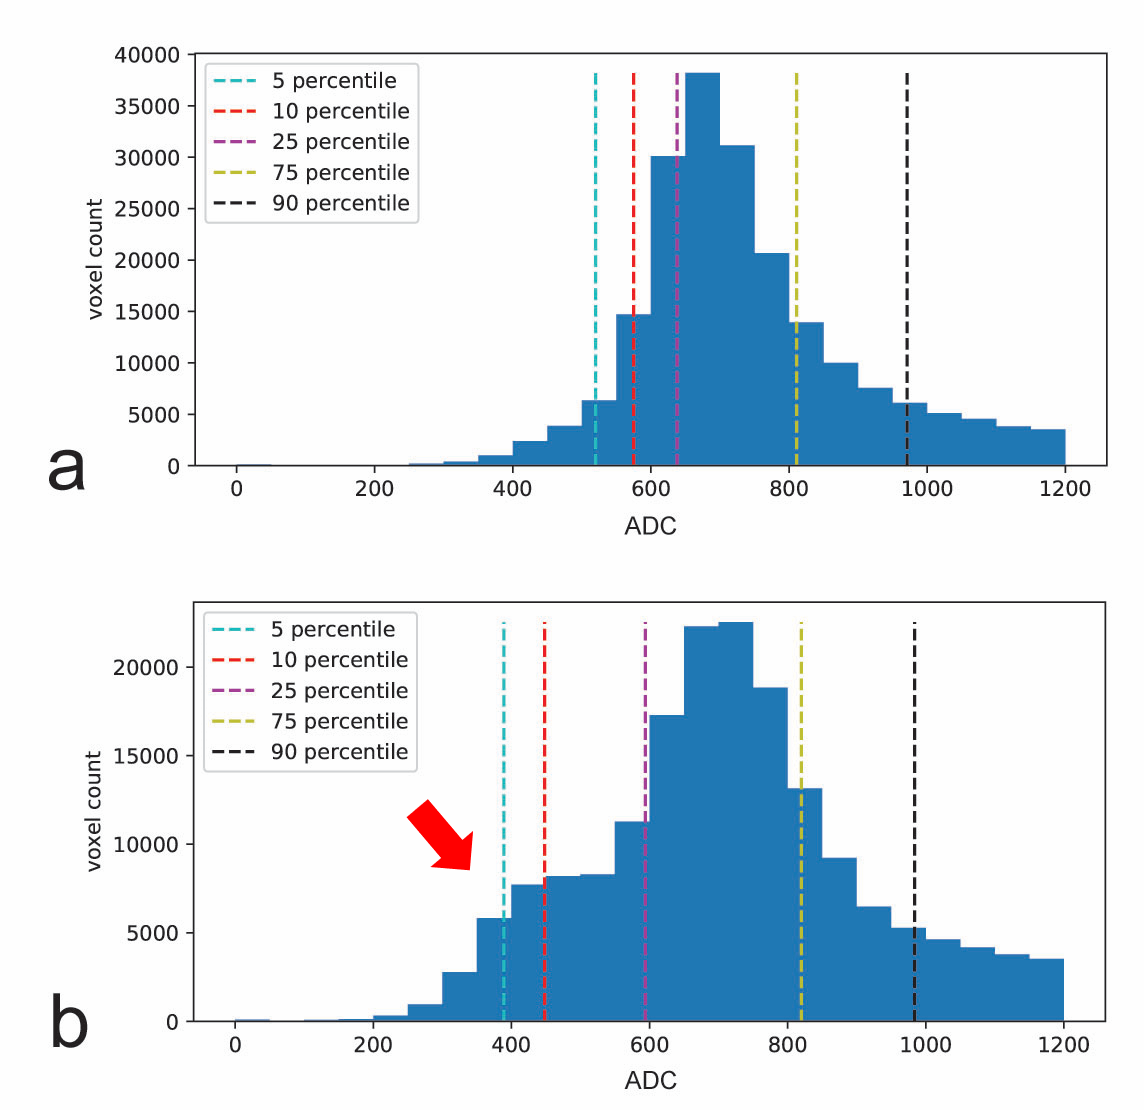
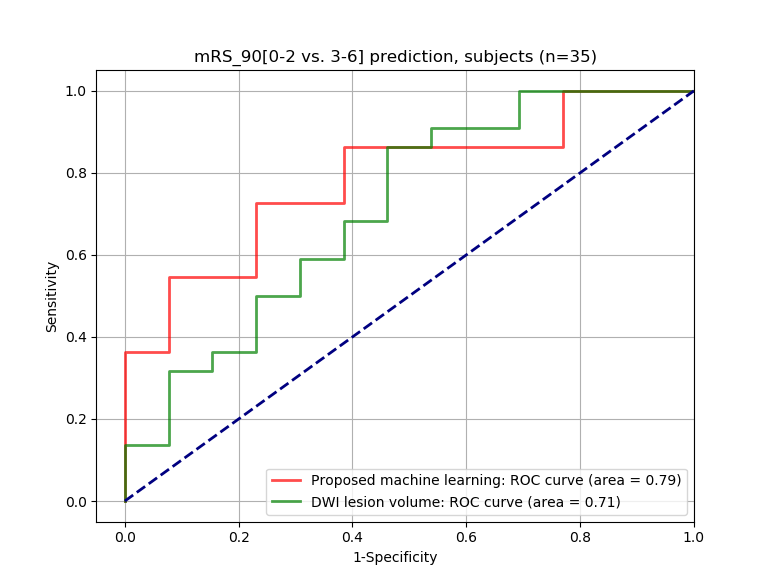
The cross validation of the optimized random forest classifier model resulted in an accuracy of 0.62 ± 0.03. The validation score of the entire training data using the optimized random forest classifier model was 0.85, while the validation score of the unseen test data was 0.69. Figure 2 highlights a comparative example between a subject with favorable outcome and a subject with unfavorable outcome. The histogram of a typical unfavorable case is shown in Figure 2b, as characterized by a bulge (indicated by the red arrow) in the range of low ADC values. Both subjects had similar diffusion lesion volumes. The comparison of the ROC curves shown in Figure 3 indicates that the proposed machine learning approach with ADC statistics as features resulted in an area under the curve (AUC) higher than the diffusion lesion volume alone (0.78 vs. 0.71).Discussion
This study suggests that the ADC statistics can improve clinical outcome predictability over the diffusion lesion volume alone. Compared to a recent study by Tang et al.,5 where the PWI-related parameters were also extracted as features, our work only involves DWI data and thus has a computational gain because of its simplicity only involving brain tissue extraction and feature extraction, followed by machine learning prediction. Notably, the traditional threshold-based method does not consider the distribution of ADC values, and we hypothesized that this distribution information may provide additional value in improving outcome prediction.It is important to note that clinical outcome is also affected by the success/failure of recanalization. In our study, recanalization status (e.g., thrombolysis in cerebral infarction (TICI) score) was not considered in model development and prediction, but it may be helpful in improving model development as well as model prediction accuracy. Another limitation is that our method was not compared against a traditional approach that considers both DWI and PWI data for outcome prediction. This will be investigated in a future study.
Conclusion
The proposed method utilizes a machine learning classifier developed solely based on features derived from baseline DWI data, and is rapid and automatic in predicting favorable/unfavorable functional outcomes.Acknowledgements
This work was supported by the Basic Science Research Program through the National Research Foundation of Korea (NRF-2019 R1A2C2008788, NRF-2018 R1D1A1B07042692).References
1. Albers GW, Marks MP, Kemp S, Christensen S, Tsai JP, Ortega-Gutierrez S, et al. Thrombectomy for stroke at 6 to 16 hours with selection by perfusion imaging. N Engl J Med. 2018;378:708-718
2. Bang OY, Chung JW, Son JP, Ryu WS, Kim DE, Seo WK, et al. Multimodal mri-based triage for acute stroke therapy: Challenges and progress. Front Neurol. 2018;9:586
3. McKinley R, Hani L, Gralla J, El-Koussy M, Bauer S, Arnold M, et al. Fully automated stroke tissue estimation using random forest classifiers (FASTER). J Cereb Blood Flow Metab. 2017;37:2728-2741
4. Nielsen A, Hansen MB, Tietze A, Mouridsen K. Prediction of tissue outcome and assessment of treatment effect in acute ischemic stroke using deep learning. Stroke. 2018;49:1394-1401
5. Tang TY, Jiao Y, Cui Y, Zeng CH, Zhao DL, Zhang Y, et al. Development and validation of a penumbra-based predictive model for thrombolysis outcome in acute ischemic stroke patients. EBioMedicine. 2018;35:251-259
6. Kim YC, Lee JE, Yu I, Song HN, Baek IY, Seong JK, et al. Evaluation of diffusion lesion volume measurements in acute ischemic stroke using encoder-decoder convolutional network. Stroke. 2019;50:1444-1451
7. Pedregosa F, Varoquaux G, Gramfort A, Michel V, Thirion B, Grisel O, et al. Scikit-learn: Machine learning in python. Journal of machine learning research. 2011;12:2825-2830
Figures