1901
Can MRI of the lumbar spine identify neurogenic claudication patients reliably? - Comparison of single variable and machine learning approaches.1Populations, Evidence and Technology, Warwick Medical School, University of Warwick, Coventry, United Kingdom, 2Imaging, University Hospital Covenry and Warwickshire, Coventry, United Kingdom
Synopsis
A case-referant type study assessing the performance of MRI lumbar spine based measurements of the spinal canal in classifying participants as either having neurogenic claudication or non-specific low-back pain. Three measurements of the central lumbar canal are assessed: the dural-sac cross-sectional area, anteroposterior canal diameter and A-D grading system proposed by Schizas et al. The performance of these measurements is compared to a machine learning model incorporating a range of other MRI measurements and demographic information.
Introduction
Neurogenic claudication (NC) is a syndrome of radiating low back pain that is exacerbated by upright exercise and relieved by adoption of a flexed posture.1 In 1954, H. Verbiest published a case series linking NC to stenosis of the lumbar spinal canal2 with NC presumed to be caused by posture related compression of the cauda equina roots.3 Symptomatic LSS is now the most common common cause for spinal surgery in the elderly.4The link between NC symptoms and the anatomical changes of LSS remains far from clear cut. Patients with severe stenosis are frequently asymptomatic5 and some patients with symptoms have no apparent stenosis.1 Several hypothesis to explain this have been put forward, including a requirement for two level nerve root compression6 or symptoms from root compression at sites outside the central canal.7
Previously published work has focused on single measurements of spinal canal anatomy.(e.g. 8,9) Machine learning (ML) algorithms provide a way to combine anatomical measurements into a single model. This abstract aims to asses whether an ML approach can improve classification of NC and non-specific low back pain patients from MRI based data, compared to the performance of single anatomical measurements.
Methodology
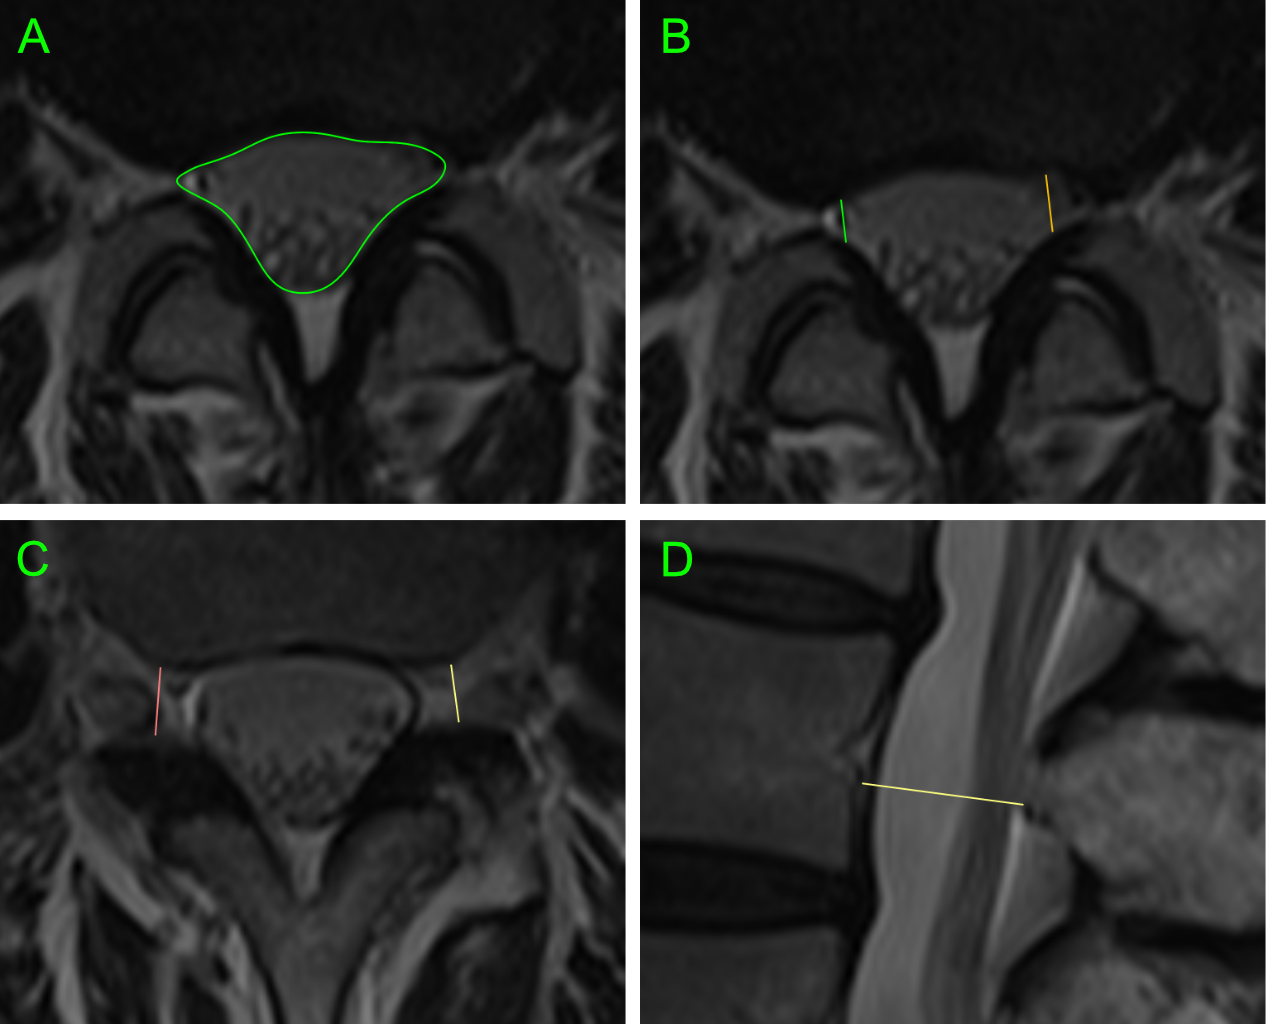
438 patients were recruited as part of Better Outcomes in Older People with Spinal Troubles (BOOST), a randomised controlled trial of physiotherapy in NC.10 Individuals over 65, not on a surgical waiting list, were recruited from secondary care clinics and a related community based study. MRIs of the lumbar were available for 355 participants. 63 patients referred by their general practitioner for MRI investigation of non-radiating low-back pain without NC were recruited as a control group.Standard MRI lumbar spines were collected. For each spinal level the following measurements were taken: dural-sac cross-sectional area (DS-CSA),8 AP canal diameter,11 A-D grading of central stenosis,12 lateral recess nerve root impingement (NRI),13 lateral recess depth,14 neural exit foramina NRI,15 foramina depth,16 spondylolisthesis grade,17 presence of disc protrusion, and the presence of scoliosis. All studies were assessed by a single observer and a subset of studies were reassessed by the main observer and two further observers to allow assessment of intra- and inter-observer reliability (fig 5A).
All statistical analysis was performed in the R environment for statistical computing.18,19,20,21 Receiver operator characteristic (ROC) curves were calculated for the measurements of central canal stenosis. The ML classifiers were trained using all MRI measurements and demographic data from the 63 LBP participants and 100 randomly selected NC participants. This data-set was split into a training set (75%) and a test set (25%), the latter withheld for final assessment of model accuracy. The full data set was not used in order to reduce any effect of asymmetry between case and control numbers on the training processes.
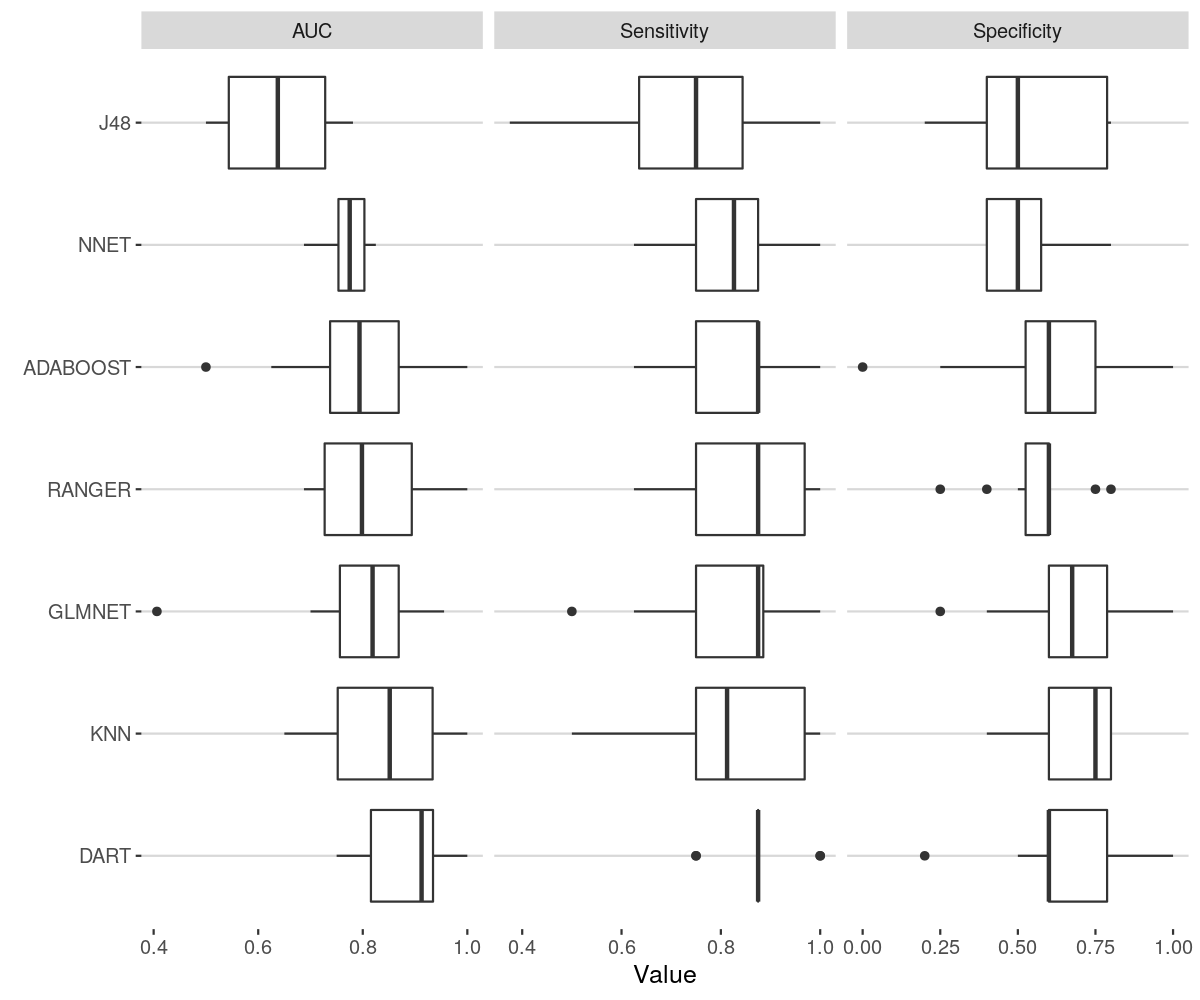
Classification algorithms included: glmnet,22 J4823, ranger,24 adaboost,25 xgbDART,26 and nnet.27 Training was performed using 10 fold cross-validation, tuning classifier hyper-parameters to maximise the area under the curve (AUC) for each classifier. A general linear model based ensemble classifier using the prior trained algorithms was developed. The performance of the best two classifiers and the ensemble was calculated for the test set.
Results
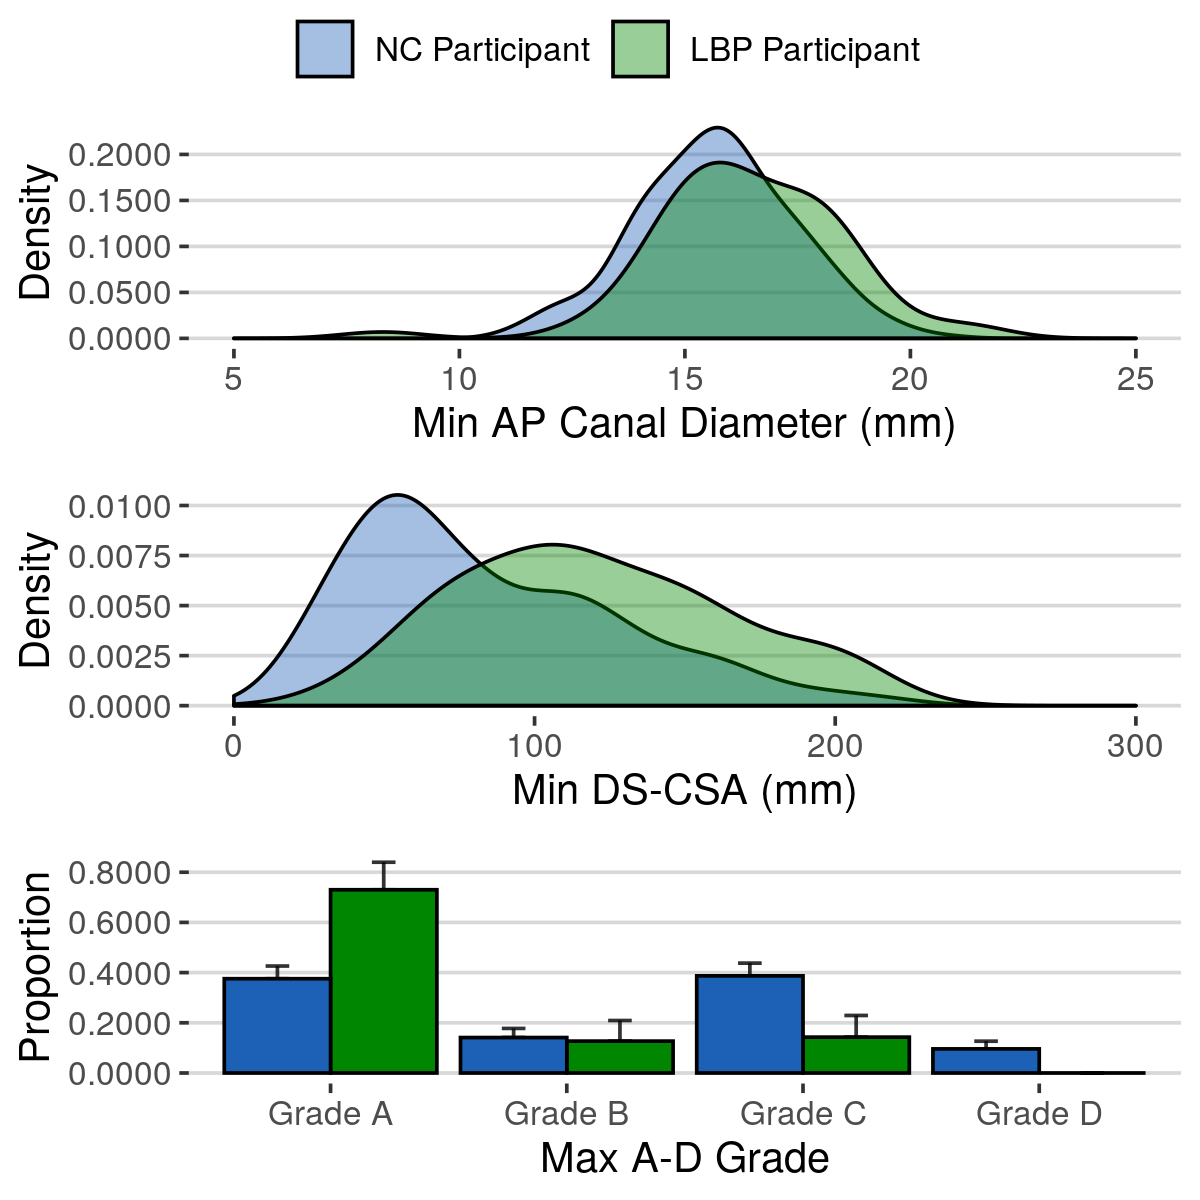
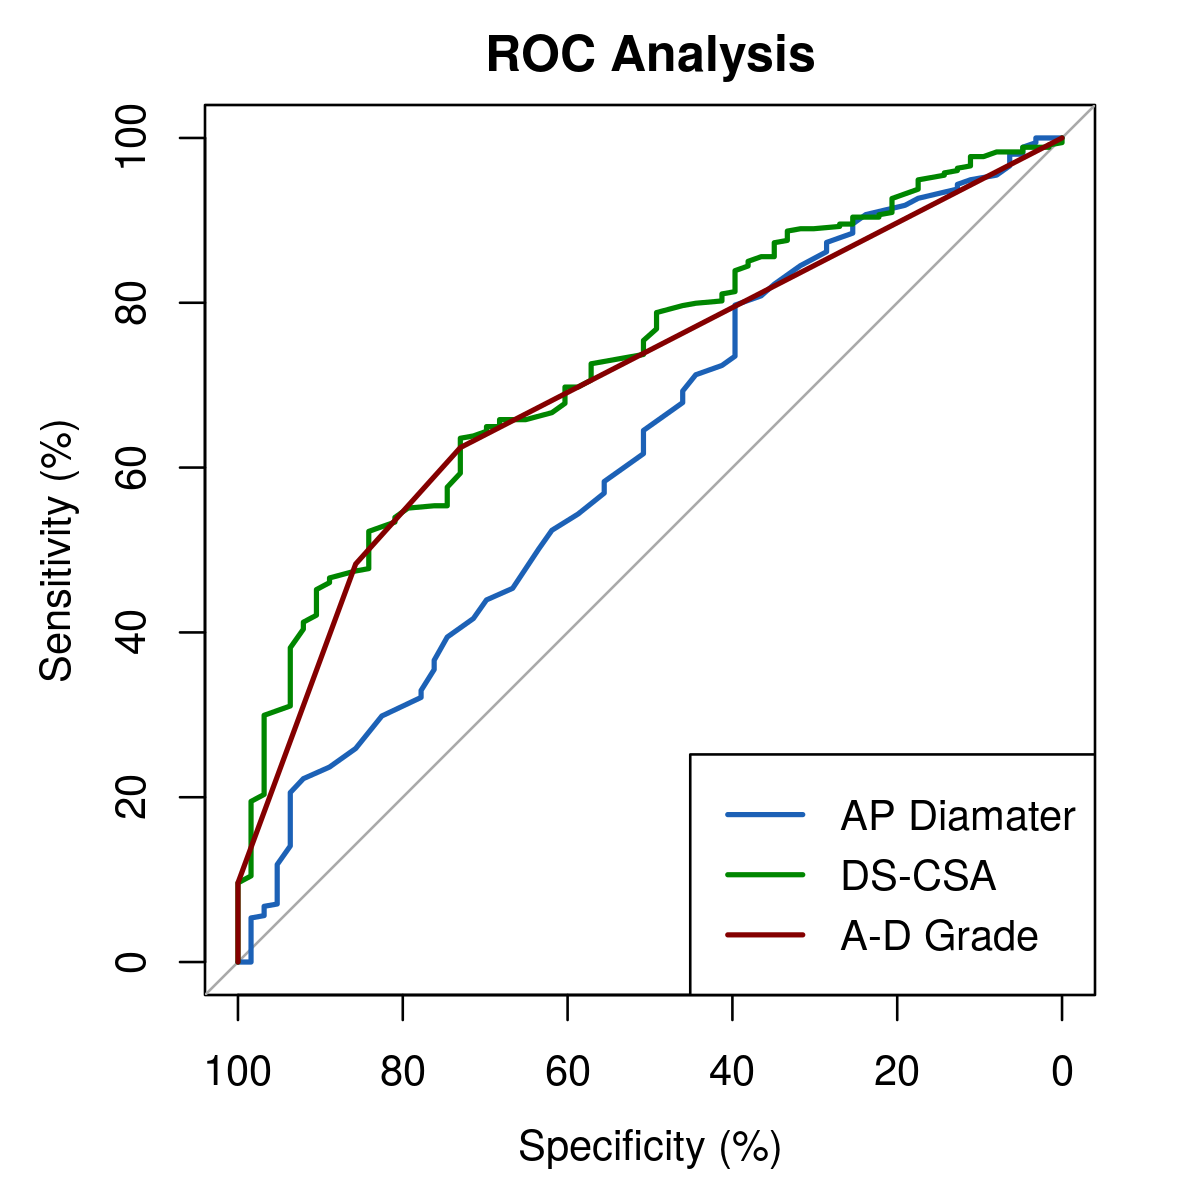
Demographic data: No significant differences between mean age, BMI or gender distribution was identified between NC and LBP participants. NC participants were on average 3 cm shorter than controls (p<0.01). The NC group had a higher number of white British individuals (88.3% vs 85.7%, p<0.01). There were no significant differences in demographic variables between NC participants with and without an MRI scan.Single measurements of central canal stenosis: Significantly smaller minimum AP diameters (p=0.01), DS-CSAs (p<0.001) and higher maximum A-D grades (p<0.001) were seen in NC compared to LBP participants (fig 2). AUC for these measurements ranged between 0.62 and 0.73 (fig 3 and 5B). The DS-CSA had a significantly higher AUC than the AP diameter (p=0.03). No significant difference was identified between any other measurement combination. Multi-level central stenosis (two levels with DS-CSA < 100 mm2) had an AUC of 0.62 for NC participants (sensitivity: 39.4%, specificity: 84.1%) .
ML Classifier performance: The cross-fold training performance of each classifier is presented in figure 4. AUCs ranged between 0.64-0.88. Performance of the top two classifiers and the ensemble classifier on the test set was however much poorer (AUC: 0.54-0.68, figure 5B).
Discussion
NC participants had significantly smaller canals compared to LBP participants, but measurements of central stenosis only had moderate power to separate the two groups. DS-CSA and A-D grades performed equally well, the former with a best diagnostic threshold of 91.5 mm2 - close to the 100 mm2 definition of stenosis commonly used in the literature.28Classification based on multi-level stenosis had poorer sensitivity but better specificity than the single measurements. The suggestion that two level nerve root compression is of importance in the pathophysiology NC may be consistent with this data if second level compression outside the central canal can explain the poor sensitivity. Unfortunately the ML models aiming to incorporate such data did not perform well. The drop in AUC from training cross-folds to test set suggests over-fitting of the models, perhaps due to the small control sample. We hope to improve upon this performance in subsequent work.
Acknowledgements
We would like to thank the following individuals who have contributed to this work: Dr Esther Williamson, Prof Sally Lamb, Mrs Angela Garret, Mr Robert Sneath and the numerous other contributors to the BOOST randomised controlled trial. We would also like to thank Dr Caron Parsons, Dr Terry Jones, Dr Ruth Hartley and the MRI radiographers of the University Hospital Coventry and Warwickshire for their ongoing support.References
1. Kreiner DS, Shaffer WO, Baisden JL, et al. An evidence-based clinical guideline for the diagnosis and treatment of degenerative lumbar spinal stenosis (update). The Spine Journal. 2013;13(7):734-743. doi:10.1016/j.spinee.2012.11.059
2. Verbiest H. A RADICULAR SYNDROME FROM DEVELOPMENTAL NARROWING OF THE LUMBAR VERTEBRAL CANAL. The Journal of Bone and Joint Surgery British volume. 1954;36-B(2):230-237. doi:10.1302/0301-620X.36B2.230
3. Verbiest H. Fallacies of the Present Definition, Nomenclature, and Classification of the Stenoses of the Lumbar Vertebral Canal. Spine. 1976;1(4):217-225.
4. Ciol MA, Deyo RA, Howell E, Kreif S. An Assessment of Surgery for Spinal Stenosis: Time Trends, Geographic Variations, Complications, and Reoperations. Journal of the American Geriatrics Society. 1996;44(3):285-290. doi:10.1111/j.1532-5415.1996.tb00915.x
5. Brinjikji W, Luetmer PH, Comstock B, et al. Systematic Literature Review of Imaging Features of Spinal Degeneration in Asymptomatic Populations. AJNR Am J Neuroradiol. 2015;36(4):811-816. doi:10.3174/ajnr.A4173
6. Porter RW. Spinal stenosis and neurogenic claudication. Spine. 1996;21(17):2046-2052.
7. Penning L, Wilmink JT. Biomechanics of lumbosacral dural sac. A study of flexion-extension myelography. Spine. 1981;6(4):398-408.
8. Hamanishi C, Matukura N, Fujita M, Tomihara M, Tanaka S. Cross-sectional area of the stenotic lumbar dural tube measured from the transverse views of magnetic resonance imaging. J Spinal Disord. 1994;7(5):388-393.
9. Burgstaller JM, Schüffler PJ, Buhmann JM, et al. Is There an Association Between Pain and Magnetic Resonance Imaging Parameters in Patients With Lumbar Spinal Stenosis?: SPINE. 2016;41(17):E1053-E1062. doi:10.1097/BRS.0000000000001544
10. Williamson E, Ward L, Vadher K, et al. Better Outcomes for Older people with Spinal Trouble (BOOST) Trial: a randomised controlled trial of a combined physical and psychological intervention for older adults with neurogenic claudication, a protocol. BMJ Open. 2018;8(10):e022205. doi:10.1136/bmjopen-2018-022205
11.
Kalichman L, Cole R, Kim DH, et al. Spinal stenosis prevalence and
association with symptoms: the Framingham Study. The Spine
Journal. 2009;9(7):545-550. doi:10.1016/j.spinee.2009.03.005
12. Schizas C, Theumann N, Burn A, et al. Qualitative Grading of Severity of Lumbar Spinal Stenosis Based on the Morphology of the Dural Sac on Magnetic Resonance Images: Spine. 2010;35(21):1919-1924. doi:10.1097/BRS.0b013e3181d359bd
13. Bartynski WS, Lin L. Lumbar Root Compression in the Lateral Recess: MR Imaging, Conventional Myelography, and CT Myelography Comparison with Surgical Confirmation. 2003:13.
14. Papp T, Porter RW, Aspden RM. Trefoil configuration and developmental stenosis of the lumbar vertebral canal. J Bone Joint Surg Br. 1995;77(3):469-472.
15. Lee S, Lee JW, Yeom JS, et al. A Practical MRI Grading System for Lumbar Foraminal Stenosis. American Journal of Roentgenology. 2010;194(4):1095-1098. doi:10.2214/AJR.09.2772
16. Santiago F, Milena G, Herrera R, Romero P, Plazas P. Morphometry of the lower lumbar vertebrae in patients with and without low back pain. Eur Spine J. 2001;10(3):228-233. doi:10.1007/s005860100267
17.
Meyerding, Henry W. "Spondylolisthesis." JBJS 13.1
(1931): 39-48
18. R Core Team. R: A Language and Environment for Statistical Computing. Vienna, Austria: R Foundation for Statistical Computing; 2013. http://www.R-project.org/.
19. Wickham H. Tidyverse: Easily Install and Load the “Tidyverse.”; 2017. https://CRAN.R-project.org/package=tidyverse.
20. Robin X, Turck N, Hainard A, et al. pROC: an open-source package for R and S+ to analyze and compare ROC curves. BMC Bioinformatics. 2011;12(1):77. doi:10.1186/1471-2105-12-77
21. Max Kuhn et al. (2019). caret: Classification and Regression Training. R package version 6.0-84. https://CRAN.R-project.org/package=caret
22. Jerome Friedman, Trevor Hastie, Robert Tibshirani (2010). Regularization Paths for Generalized Linear Models via Coordinate Descent. Journal of Statistical Software, 33(1), 1-22. URL http://www.jstatsoft.org/v33/i01/.
23. Hornik K, Buchta C, Zeileis A (2009). “Open-Source Machine Learning: R Meets Weka.” Computational Statistics, *24*(2),225-232. doi: 10.1007/s00180-008-0119-7
24. Marvin N. Wright, Andreas Ziegler (2017). ranger: A Fast Implementation of Random Forests for High Dimensional Data in C++ and R. Journal of Statistical Software, 77(1), 1-17. doi:10.18637/jss.v077.i01
25. Sourav Chatterjee (2016). fastAdaboost: a Fast Implementation of Adaboost. R package version 1.0.0. https://CRAN.R-project.org/package=fastAdaboost
26. Tianqi Chen, Tong He, Michael Benesty et a. (2019). xgboost: Extreme Gradient Boosting. R package version 0.90.0.2. https://CRAN.R-project.org/package=xgboost
27. Venables, W. N. & Ripley, B. D. (2002) Modern Applied Statistics with S. Fourth Edition. Springer, New York. ISBN 0-387-95457-0
Figures
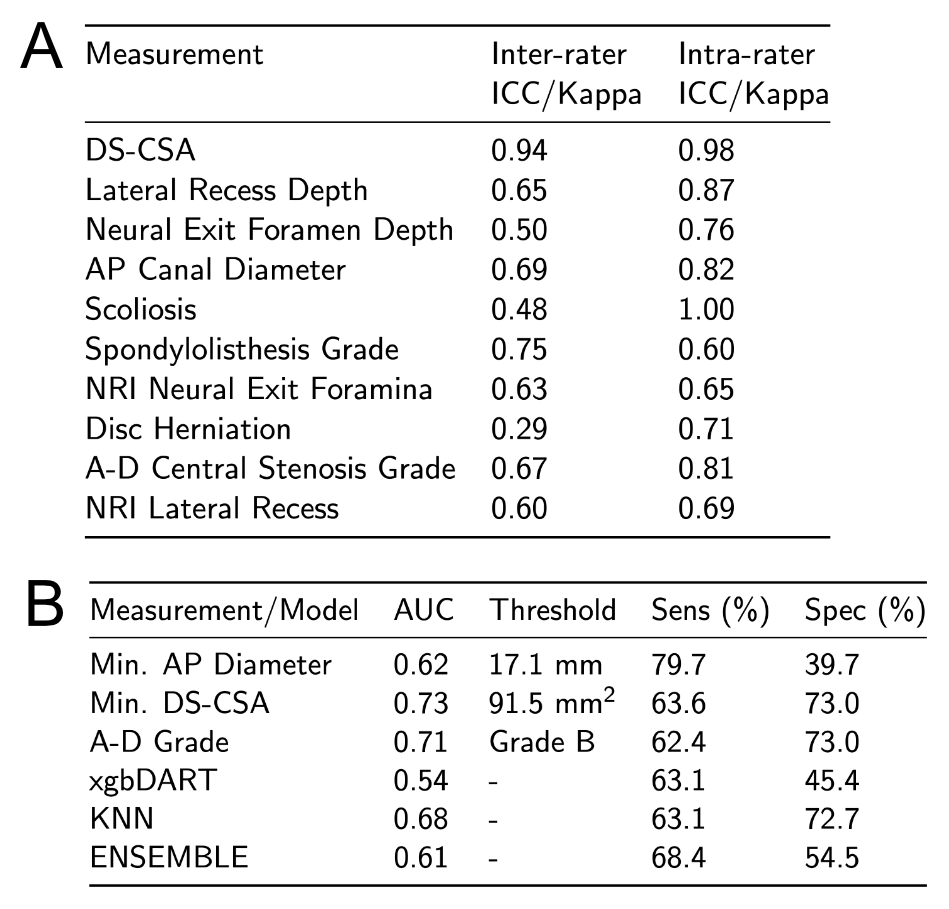
A - Table of intra- and inter-rater reliability for each MRI measurement. Values provided are intra-class correlation coefficients for numeric variables and Fleiss' kappa statistics for categorical variables.
B - Table detailing the best threshold, AUC, sensitivity and specificity for the three measurements of central canal stenosis measured at the most severely stenosed level per participant. In addition the performance of the selected best two classifiers and the combined ensemble classifier for the withheld test data-set is presented.