1893
On Differentiation of Pilocytic Astrocytoma from High-Grade-Glioma Tumor using Machine Learning Based upon Quantitative T1 Perfusion MRI
Anup Singh1,2, Neha Vats1, Virendra Kumar Yadav1, Anirban Sengupta3, Rakesh Kumar Gupta4, Sumeet Agarwal5, Mamta Gupta6, Rana Patir7, Sunita Ahlawat6, and Jitender Saini8
1Centre for Biomedical Engineering, Indian Institute of Technology Delhi, New Delhi, India, 2Biomedical Engineering, AIIMS, New Delhi, India, 3Vanderbilt University Medical Center, Nashville, TN, United States, 4Department of Radiology, Fortis Memorial Research Institute, Gurugram, India, 5Electrical Engineering, Indian Institute of Technology Delhi, New Delhi, India, 6Fortis Memorial Research Institute, Gurugram, India, 7Neurosurgery, Fortis Memorial Research Institute, Gurugram, India, 8Department of Neuroimaging and Interventional Radiology (NIIR), NIMHANS Bangalore, Bangalore, India
1Centre for Biomedical Engineering, Indian Institute of Technology Delhi, New Delhi, India, 2Biomedical Engineering, AIIMS, New Delhi, India, 3Vanderbilt University Medical Center, Nashville, TN, United States, 4Department of Radiology, Fortis Memorial Research Institute, Gurugram, India, 5Electrical Engineering, Indian Institute of Technology Delhi, New Delhi, India, 6Fortis Memorial Research Institute, Gurugram, India, 7Neurosurgery, Fortis Memorial Research Institute, Gurugram, India, 8Department of Neuroimaging and Interventional Radiology (NIIR), NIMHANS Bangalore, Bangalore, India
Synopsis
Imaging based diagnosis of Pilocytic Astrocytoma (PA) is quite important for better prognosis. PA can easily be misdiagnosed since its location, growth pattern, and contrast enhancement often mimic a more aggressive high-grade glioma(HGG) tumor. In the current study, quantitative analysis of T1-Perfusion(DCE) MRI data was performed followed by extraction of various features from tumor region and development of an optimized support-vector-machine(SVM) classifier for automatic differentiation of PA vs HGG. The proposed machine learning based approach which uses features derived from quantitative T1 perfusion MRI and tumor volume fraction can enable accurate diagnosis of PA and HGG tumors.
Introduction
Pilocytic Astrocytoma(PA) are considered grade I tumors in the current(2016) WHO classification of CNS tumors and have a relatively good prognosis. PAs are usually well enhanced tumors, on post-contrast T1-weighted MRI images, that resemble high-grade gliomas(HGGs). Some of the PA show similar appearance to HGG on conventional MRI1-4. Due to this, conventional imaging based diagnosis of PA has been less accurate. Some of the recent studies have shown potential of quantitative maps of perfusion MRI and diffusion MRI, particularly relative-cerebral-blood-volume(rCBV) and apparent-diffusion-coefficient(ADC) in differentiation of PA from HGG. Maximum rCVB show low values while ADC show high values in PA compared to HGG5-7. A recently published study8, using a decision tree model based upon radionics features derived from post-contrast T1-weighted images, have shown accuracy of 86% in differentiation of PA from Glioblastoma, which is a grade IV glioma. We hypothesis that a machine learning approach based upon quantitative multi-parametric MRI features should differentiate PA from HGG with improved accuracy. The current study included quantitative analysis of T1-perfusion MRI data followed by extraction of various features from tumor region and development of a support-vector-machine(SVM) classifier for automatic differentiation of PA vs HGG.Material and Methods
This retrospective study included 24 PA and 52 HGG (24 grade-III and 28 grade-IV) patients, with tumor histopathological characterization done based on WHO 2016 guidelines. MRI was performed at 3T MR scanner (Philips Health Systems, the Netherlands) using a 15 channel head coil. MRI data included conventional T1-weighted(W), T2-W, fluid-attenuated-inversion-recovery(FLAIR), diffusion weighted imaging, T1 mapping data, T1-Perfusion(DCE) MRI data and post-contrast T1-weighted images covering entire tumor tissue. T1-Perfusion MRI data(40 time points with temporal resolution of 3.9s) was acquired using 3D T1-TFE with 0.1 mmol/kg body-weight of GD-BOPTA contrast agent injected at 4th time point. Image processing and quantitative analysis of MRI data were performed using in house developed software tools in MATLAB. Image processing started with skull-removal and registration of multi-parametric MRI data with T1 weighted images using SPM12 software9. Quantitative analysis of T1-perfusion MRI was performed using leaky-tracer-kinetic-model (LTKM)10 for computing volume-transfer-rate(Ktrans), volume-fraction-of-extracellular-extravascular-space(Ve), volume-fraction-of-extracellular-extravascular-space(Vp), volume-transfer-rate-from-plasma-to-leakage-space (λtrans); first-pass-analysis for computing cerebral-blood-volume(CBV) and cerebral-blood-flow(CBF)11 and piecewise-linear model12 for computing slopes(wash-in and wash-out rates), bolus-arrival-time(BAT) and time-to-peak(Beta) of contrast agent. CBV was also corrected for leakage of contrast to obtain CBVcorr. The CBVcorr and CBF maps were normalized with the mean value of a normal-appearing-white-matter(NAWM) mask to obtain rCBVcorr and rCBF. Tumor region was semi-automatically segmented into various components (enhancing, non-enhancing, edema, necrotic/cyst) using a methodology reported in a recent study13. Feature Vector for classification included quantitative parameters such as rCBVcorr , rCBF, Ktrans, λtrans, Ve, Vp, BAT, BETA along with volume fractions such as enhancing tumor(ET) volume, Edema volume, Necrotic volume computed over tumor region. For quantitative parameters mean of values>90th percentile in tumor region was used as feature. Student’s t-test was applied to evaluate statistical significance of all features in differentiation of PA vs HGG. Receiver-operating-characteristic(ROC) analysis was performed for each feature to find Area-under-curve(AUC) along with sensitivity and specificity. SVM classification was done using both linear as well as radial basis function (RBF) kernel in MATLAB(2018b). The classifier was optimized with respect to its hyper parameters C and γ. A 10-fold Cross-Validation(CV) was performed to estimate how well the classifier performs on unseen data. Random-Forest classifier was used for feature optimization to be used in SVM classifier. ROC analysis was performed for binary classification (PA vs HGG) based on the 10-fold CV results.Results and Discussion
Figure-1 and Figure-2 show conventional MRI images and quantitative maps(rCBVcorr, Ktrans, Slope-2) of a representative PA and HGG patient respectively. Both types of tumor show similar contrast enhancement on conventional images. rCBVcorr, Ktrans and Slope-2 show higher values in PA compared to HGG. Table-1 show average of some of the quantitative parameters over all patients for PA and HGG tumors. It clearly shows higher values in PA for rCBF, Ktrans, Slope-1, Slope-2, λtrans with statistically significant differences(P<0.05) between PA vs HGG. In the current study, rCBV did not show statistically significant difference between PA and HGG. Previous studies have reported lower rCBV values, based upon DSC Perfusion MRI, in PA compared to HGG. This might be due to the use of without leakage correction rCBV from DSC MRI. Tumor volume fractions also show statistically significant differences. Linear SVM classifier based upon optimum features provided a CV error of 3.4%. ROC analysis(Figure-3) based upon optimized SVM classifier provided a sensitivity=98.04, specificity=91.67 and AUC=99.08 in differentiation between PA vs HGG. ROC analysis results (AUC, sensitivity and specificity) for individual parameters were much less than SVM classification. The proposed approach has enabled accurate differentiation of PA and HGG tumors; however, this approach needs to be evaluated on more number of patients from multiple hospitals.Conclusion
Quantitative parameters, particularly Slope-1(wash-in rate), Slope-2(washout rate), Ktrans, and λtrans, computed from T1-Perfusion MRI data provided significant difference between PA and HGG. Volume fractions were also significantly different between PA and HGG. Machine learning classifier (SVM) based upon quantitative T1-Perfusion MRI features and tumor volume fraction features enabled highly accurate(CV accuracy = 96.6%) differentiation of PA and HGG tumors.Acknowledgements
This work was supported by IIT Delhi, Fortis Memorial Research Institute Gurugram and NIMHANS Bangalore. Authors acknowledge funding support from SERB DST Project nu YSS/2014/000092. Authors acknowledge Dr. Indrajit Saha from Philips India for technical support in data acquisition.References
- Koeller KK, Rushing EJ. From the archives of the AFIP: pilocytic astrocytoma: radiologic-pathologic correlation. Radiographics (2004), 24(6):1693–1708.
- Fulham MJ, Melisi JW, et al. Neuroimaging of juvenile pilocytic astrocytomas: an enigma. Radiology (1993), 189(1):221–225.
- Behin A, Hoang-Xuan K, et al. Primary brain tumours in adults. Lancet 2003, 361(9354):323–331.
- Cha S. Update on brain tumor imaging: from anatomy to physiology. AJNR Am J Neuroradiol. 2006 Mar;27(3):475-87.
- Kikuchi K, Hiwatashi A, et al. Usefulness of perfusion- and diffusion-weighted imaging to differentiate between pilocytic astrocytomas and high-grade gliomas: a multicenter study in Japan. Neuroradiology (2018) 60:391–401.
- Murakami R, Hirai T, et al. Magnetic Resonance Imaging of Pilocytic Astrocytomas: Usefulness of the Minimum Apparent Diffusion Coefficient (ADC) Value for Differentiation from High-Grade Gliomas. Acta Radiologica (20080.
- Grand S, Kremer S, et al. Perfusion-sensitive MRI of pilocytic astrocytomas: initial results. Neuroradiology (2007) 49:545–550.
- Fei Dong, Qian Li, et al. Differentiation between pilocytic astrocytoma and glioblastoma: a decision tree model using contrast-enhanced magnetic resonance imaging-derived quantitative radiomic features. European Radiology (2019), 29, 3968–3975.
- SPM12 software: https://www.fil.ion.ucl.ac.uk/spm/.
- Sahoo P, Rathore RKS, Awasthi R, et al.: Subcompartmentalization of extracellular extravascular space (EES) into permeability and leaky space with local arterial input function (AIF) results in improved discrimination between high- and low-grade glioma using dynamic contrast-enhanced (DCE) MRI. J Magn Reson Imaging (2013), 38:677–688.
- Singh A, Haris M, Rathore D, et al.: Quantification of physiological and hemodynamic indices using T1 dynamic contrast-enhanced MRI in intracranial mass lesions. J Magn Reson Imaging (2007), 26:871–880.
- Singh A, Rathore RKS, Haris M, Verma SK, Husain N, Gupta RK: Improved bolus arrival time and arterial input function estimation for tracer kinetic analysis in DCE-MRI. J Magn Reson Imaging (2009), 29:166–176
- Sengupta A, Agarwal S, Gupta PK, et al. On differentiation between vasogenic edema and non-enhancing tumor in high-grade glioma patients using a support vector machine classifier based upon pre and post-surgery MRI images. Eur J Radiol. (2018),106:199-208.
Figures
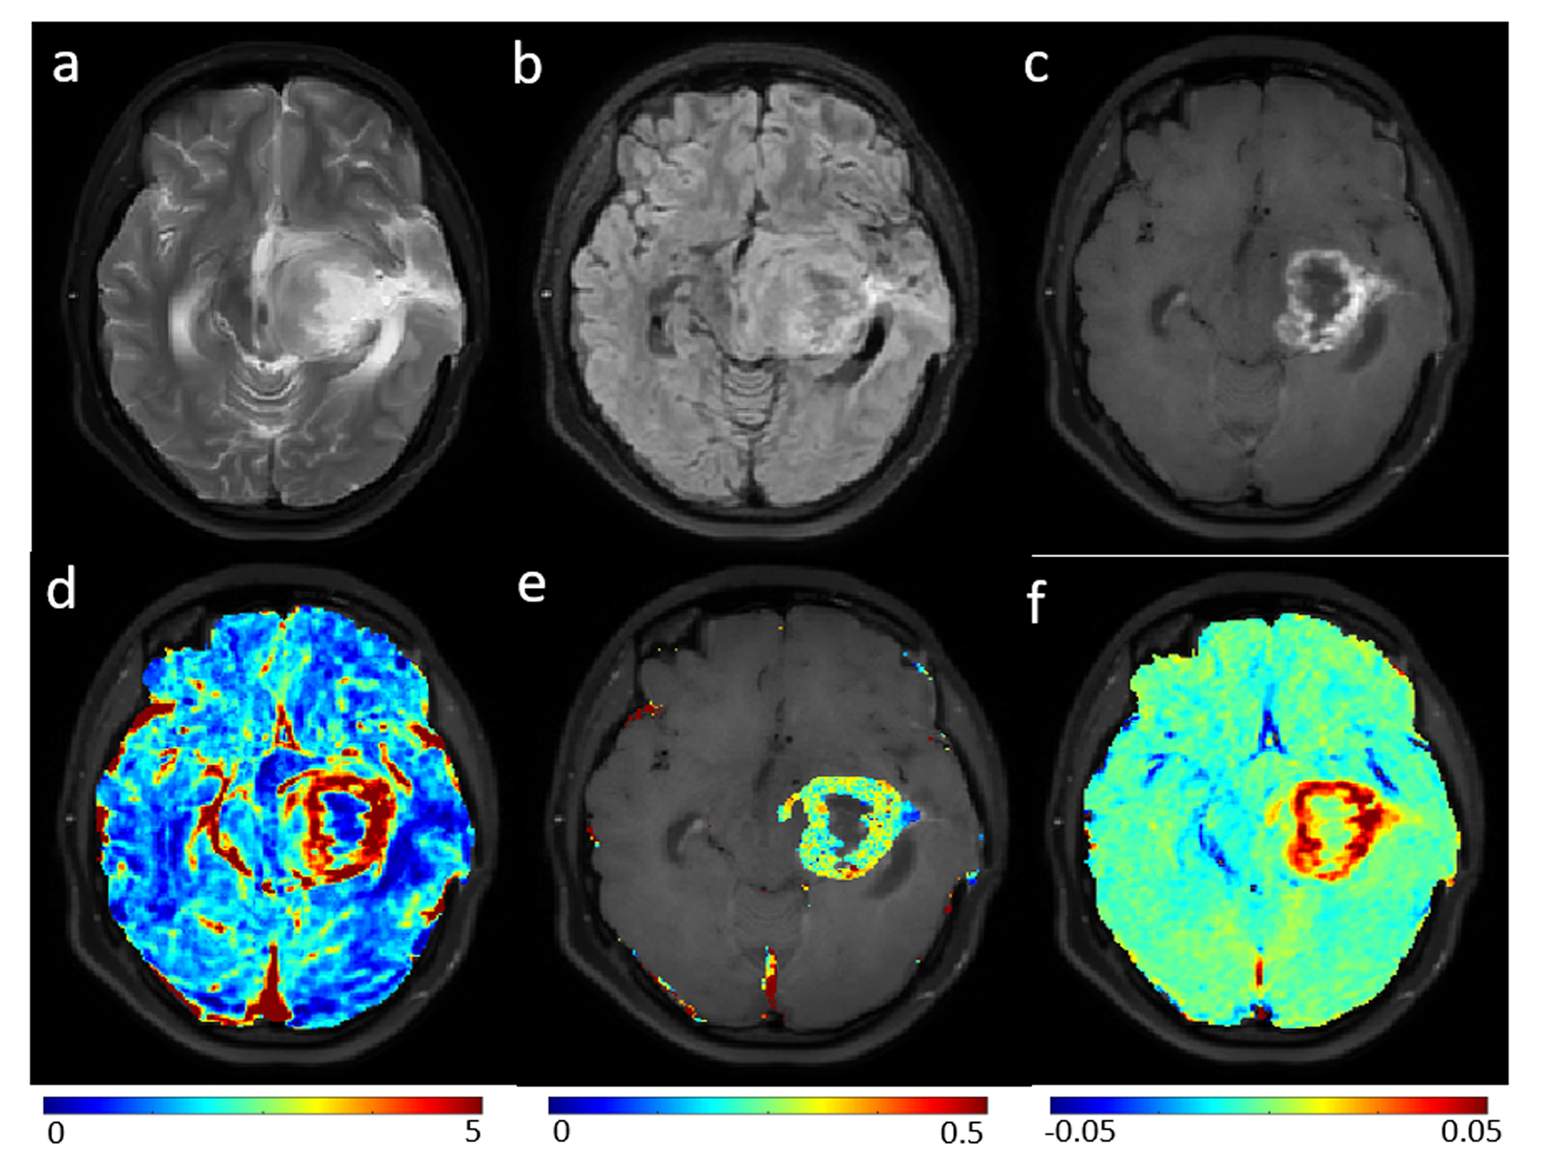
Figure-1: Row-1 show MRI images (T2-weighted(a), FLAIR(b)
and post-contrast T1-weighted (c)) for a representative slice of brain of
patient with Pilocytic Astrocytoma. Row-2 show rCBVcorr (d), Ktrans(e)
and Slope-2(f) maps overlaid on T1-w image.
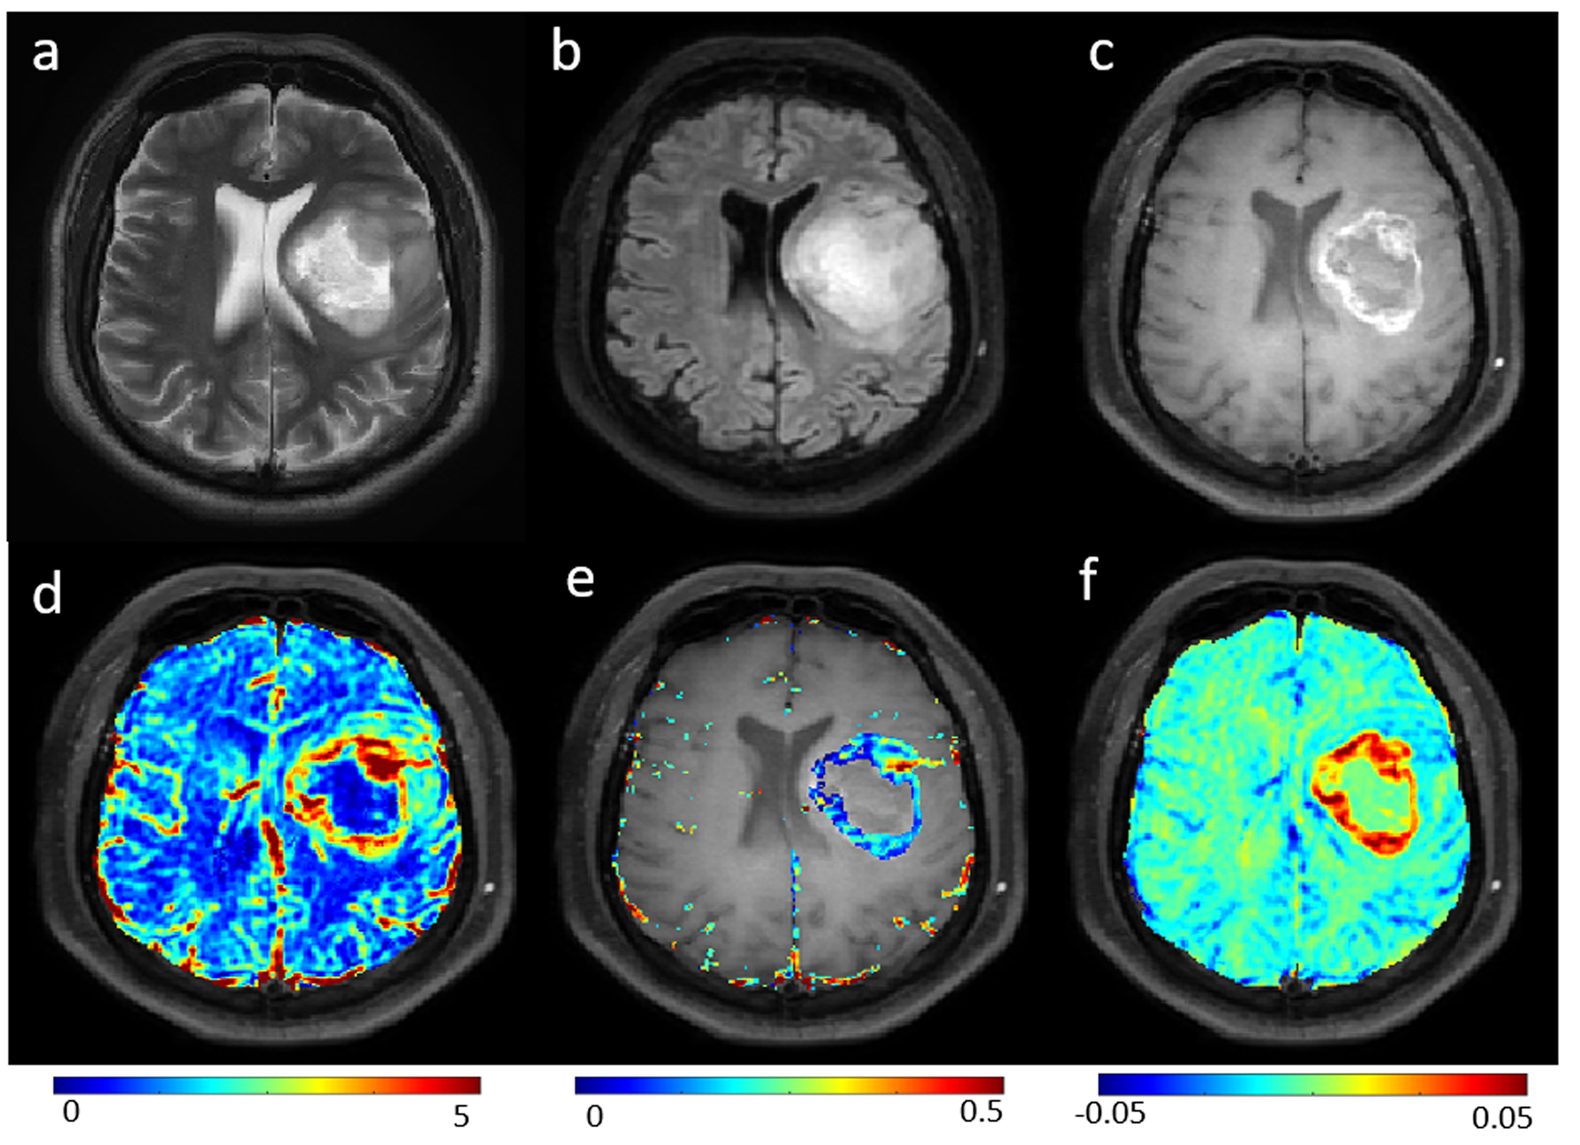
Figure-2: Row-1
show MRI images (T2-weighted(a), FLAIR(b) and post-contrast T1-weighted (c))
for a representative slice of brain of patient with high grade glioma. Row-2
show rCBVcorr (d), Ktrans(e) and Slope-2(f) maps overlaid on T1-weighted
image.
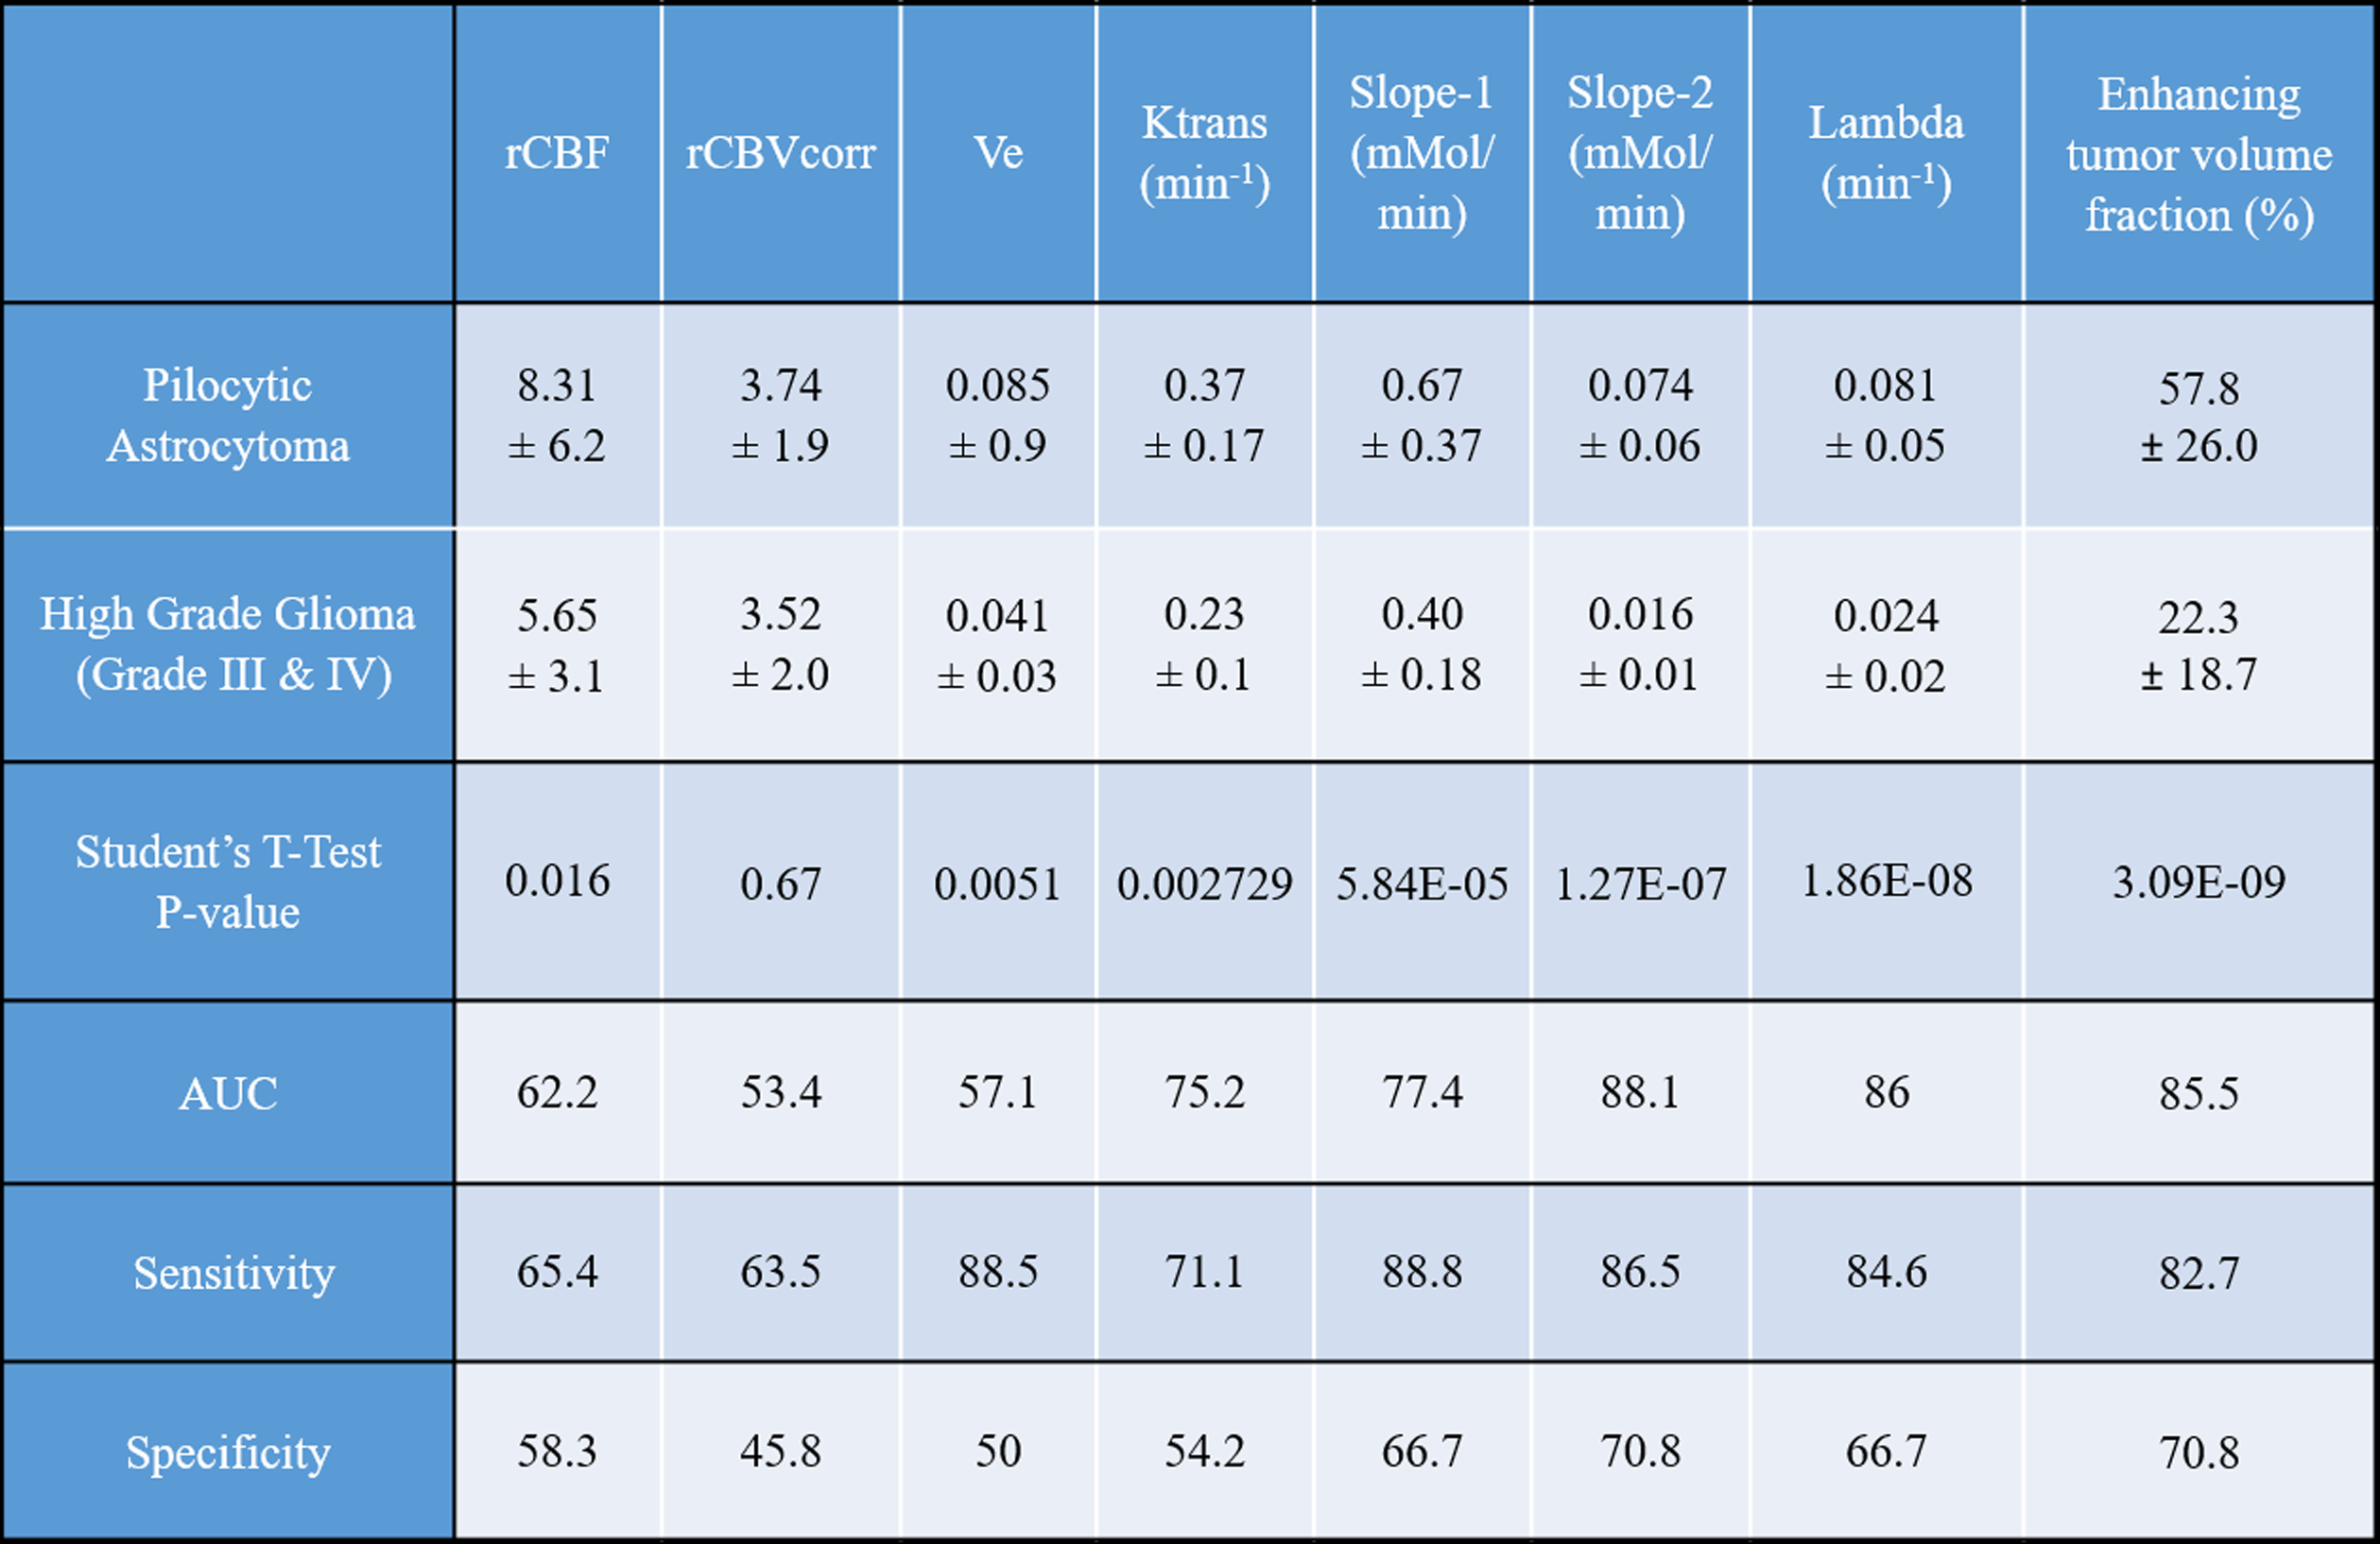
Table-1: Show mean ±sd values and statistical analysis results of some of the quantitative parameters, obtained using analysis of T1-perfusion MRI data and contrast enhancing tumor fraction, for Pilocytic Astrocytoma and high-grade glioma tumors. ROC: receiver-operative-characteristic; AUC: Area under curve. AUC, Sensitivity and Specificity were computed from ROC analysis.
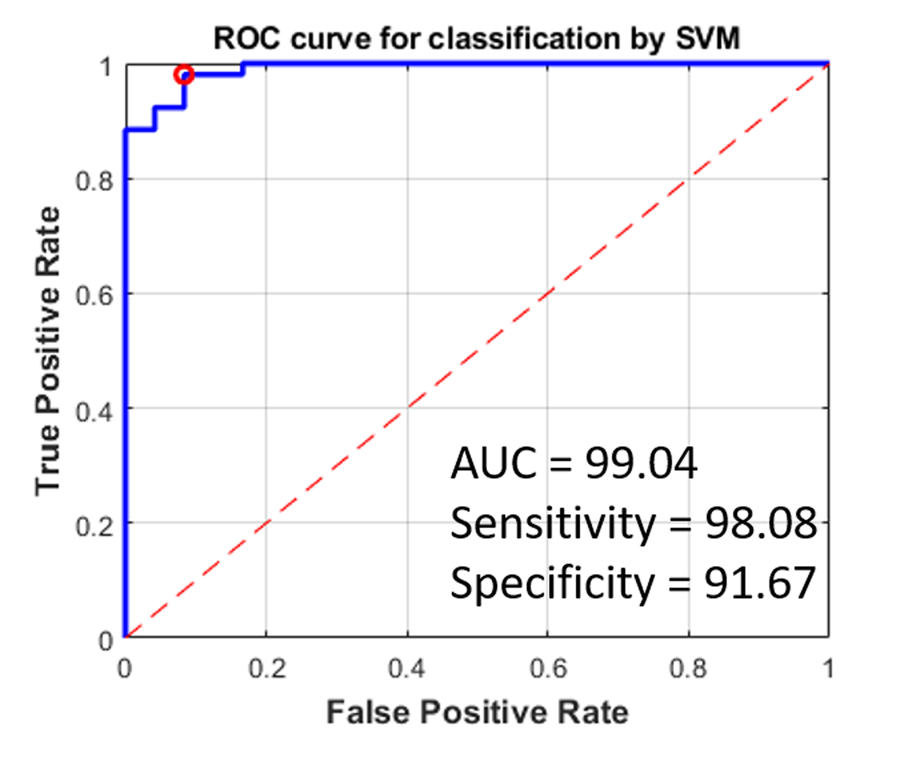
Figure-3: ROC curve of SVM classifier (for optimized
feature set), based upon quantitative parameters computed from analysis of
T1-perfusion MRI data and volume of tumor components features, for
differentiating between Pilocytic Astrocytoma and high-grade glioma tumors. The
red circle denotes the optimal threshold point in the ROC analysis.