1891
3D Mask R-CNN model comparison for brain tumor segmentation in individual modality dataset1Biomedical Research Institute, Seoul National University Hospital, Seoul, Korea, Republic of, 2Medical & Biological Engineering, Kyungpook National University, Daegu, Korea, Republic of, 3GE Health Korea, Seoul, Korea, Republic of, 4Radiology, College of Medicine, Kyungpook National University, Daegu, Korea, Republic of, 5Radiology, Seoul National University Hospital, Seoul, Korea, Republic of
Synopsis
Deep learning-based brain tumor segmentation requires multi-modality dataset for a precision accuracy. However, multi-modality data acquisition has a limitation due to several reasons. In this study, we propose that a 3D Mask R-CNN network model could provide a reliable accuracy in individual modality dataset for brain tumor segmentation.
Introduction
Deep learning studies for brain tumor segmentation have used multi-modality magnetic resonance imaging (MRI) such as T1, T1 contrast enhanced(T1ce), T2, FLAIR image. A fusion information of multi-modality data is important for accuracy of tumor segmentation include edema, tumor core, and necrosis region. However, multi-modality image acquisition has a limitation in the field due to several reasons (scan time, patient status, vitals, etc.). Therefore, we investigated efficiency of neural network model using Mask-RCNN with each different modality image without multi-modal fusion.Methods
BRATS 20181 dataset were used for training, validation, and test. The dataset includes 210 multi-modal images of patients with high grade glioma (HGG) and 75 with low grade glioma (LGG). The training data was consisted of 171 datasets with mixed HGG and LGG data. The validation and testing data were consisted of each 57 datasets. The images of datasets were registered to a common space and resampled to 1mm isotropic resolution with dimensions 240x240x155 and were skull stripped. A ground truth segmentation masks were applied include three labels: Tumor core (TC), enhanced (EN), and whole tumor (WT). A medical detection toolkit2 was used for comparison of Mask-RCNN model to each modality dataset. The ResNet-50 and ResNet-101 neural network were applied to training. Batch size was 8 and instance normalization was applied. To validate the trained model 5-fold cross validation on the 57 mixed HGG and LGG dataset. A single NVIDIA 1080Ti GPU was used for training and training time was about 72 hours for each modality dataset. Trained models were evaluated using mean average precision (mAP).Results
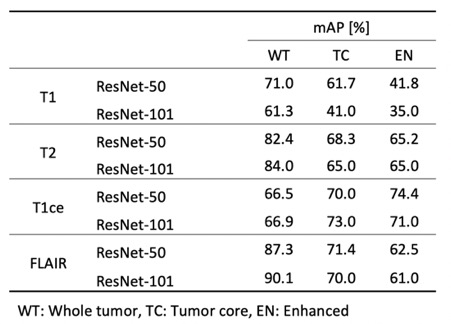
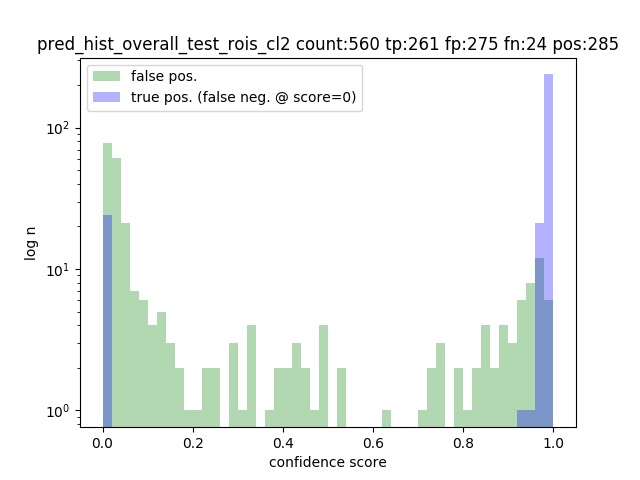
The results are shown in Table 1. The model using ResNet-101 with FLAIR datasets showed mAP of 0.901 in whole tumor region segmentation. The mAP of model using ResNet-101 with T2 datasets was 0.84. The mAP of tumor core segmentation and enhanced region segmentation showed slightly better value in the trained model with T1ce datasets. Figure 1 showed confidence score of the prediction in the trained model with FLAIR.Conclusion
We demonstrated the model performance with each different modality brain tumor dataset using Mask R-CNN with ResNet-50 and -101 neural network. This study suggests that Mask R-CNN model would be helpful to reduced scan modality for brain tumor segmentation.Acknowledgements
This work was supported by Basic Science Research Program through the National Research Foundation of Korea (NRF) funded by the Ministry of Education (NRF-2017R1D1A1B03030954).References
1. S. Bakas, M. Reyes, A. Jakab, S. Bauer, M. Rempfler, A. Crimi, et al., "Identifying the Best Machine Learning Algorithms for Brain Tumor Segmentation, Progression Assessment, and Overall Survival Prediction in the BRATS Challenge", arXiv preprint arXiv:1811.02629 (2018)
2. Jaeger, P. F., Kohl, S. A. A., Bickelhaupt, S., Isensee, F., Kuder, T. A., Schlemmer, H.-P., & Maier-Hein, K. H. (2018, November 21). Retina U-Net: Embarrassingly Simple Exploitation of Segmentation Supervision for Medical Object Detection.
Figures