1889
Feasibility of deep learned reconstruction for dual-echo fast spin echo based T2 mapping of the hippocampus and hippocampal subfield1Department of Radiology, Haeundae Paik Hospital, Busan, Republic of Korea, 2MR Collaboration and Development, GE Healthcare, Calagary, AB, Canada, 3GE Healthcare Korea, Seoul, Republic of Korea
Synopsis
With the increased scientific interest in hippocampal subfields, a clinically applicable T2 mapping method is demanding. With a dual echo fast spin echo based approach, we were able to acquire high resolution T2 maps <5 minutes scan time. With recently introduced deep learned reconstruction, improved image quality of T2 weighted image, and T2 map is observed. Differences in measurements regarding T2 values and volumes of hippocampal subfields will be presented.
Introduction
With the increased scientific interest in hippocampal subfields, ILAE Neuroimaging Task Force1 and acquisition working group of hippocampal subfields group2 recommend high-resolution T2 weighted imaging (e.g. 0.4x0.4x2 mm) for hippocampal magnetic resonance imaging.High-resolution T2 mapping that matches such standards (although not completely), to our knowledge, has been only attempted in one study with multi-echo spin-echo (SE) sequences, at a scan time of approximately 11 minutes3.
Although T2 mapping using a multi-echo SE sequence is accepted as the gold standard at higher field strength, clinical utilization is limited by either the lengthy acquisition time or limited spatial coverage per scan time. Hippocampal T2 maps calculated from dual-echo fast spin-echo (DE-FSE), is a more time-efficient alternative, but at the cost of potential errors and decreased accuracy4, leading to increased inter-scanner and inter-protocol variability5. Nevertheless, this method has been translated to the clinics and validated for clinical value in some applications such as hippocampal sclerosis6, proving superiority over conventional T2 weighted images, and normalized fluid-attenuated inversion recovery (FLAIR) analysis. Still, T2 maps are acquired at a low resolution (e.g. 0.94x0.94x5 mm6, 0.4x0.4x4 mm7), presumably due to limitations in signal to noise (SNR).
DLRecon is a new deep learning-based MR reconstruction, which comprises a deep convolutional residual encoder network trained using a database of over 10,000 images to achieve images with high SNR and high spatial resolution.
We hypothesized that deep learned reconstruction with DLRecon can improve quality of high-resolution T2 maps of the hippocampus, enabling high-resolution anatomical images and T2 maps simultaneously.
Methods
[Data Acquisition]Images were acquired on a healthy volunteer, using a 3T MRI scanner (Signa Architect, GE Healthcare, Waukesha, WI, USA), equipped with a 48-channel head coil. A DE-FSE proton‐density/T2‐weighted image was acquired (TR 5,078 msec, TE 30/100 msec, FOV 180 × 180 mm, matrix size 416 × 416, slice thickness 2 mm with no interslice gap, 30slices, ASSET factor 2, acquisition time 4:50 minutes) perpendicular to the hippocampal axis. A 3D inversion recovery prepared T1 SPGR sequence with 1mm isotropic spatial resolution was acquired as input for the segmentation software.
[Image Reconstruction]
The acquired data were retrospectively reconstructed with and without DLRecon at denoising level of 50% (DL50), and 70% (DL70) respectively.
[Post-processing]
T2map was estimated by voxelwise mono-exponential fitting of dual-echo signals. Air region was masked out from T2 map calculation. To minimize contamination from the signal of cerebrospinal fluid, voxels with T2 values greater than 170 msec were removed7.
Hippocampal subfield segmentation with T2 weighted images from the dual-echo acquisition, reconstructed with and without DLRecon was performed with a method implemented in a development version of Freesurfer8-9. Mean and standard deviation (SD) of the T2 values for hippocampal subfield segmentation based on T2 images of DL70 were acquired.
Results
Image quality shows improvement with obviously decreased noise on T2 weighted image and T2 maps with the application of DLRecon (Figure 1.). The mean and SD of the T2 values and volume for each hippocampal subfield are summarized in Table 1. The volumes of the hippocampal subfield were similar between the conventional and deep learned methods, with less than 6% difference (Figure 2). The mean T2 value shows a maximum difference of approximately 12% (Figure 3). The standard deviation of the T2 value shows a marked decrease showing a maximum decrease of approximately 60% (Figure 4.).Discussion
The main limitation of this preliminary evaluation is that the results are based on a single subject. However, it is not difficult to see the clear differences (possibly improvements) this method provides and illustrates the potential of deep learning-based reconstruction for improvement of quantitative imaging.Validation in a larger number of subjects and patients, comparison against gold standard mapping techniques, optimization of acquisition parameters, combination with alternate quantification methods such as dictionary-based methods4 that can increase accuracy may expand fields of clinical translation in the future.
Conclusion
This preliminary evaluation suggests that deep learned reconstruction has the potential for improving the quality of T2 mapping and widening clinical use of high-resolution T2 mapping of the hippocampus and hippocampal subfields.Acknowledgements
The authors than Keun Hong Kim for assistance in the volunteer scan.References
- Bernasconi, A. et al. Recommendations for the use of structural magnetic resonance imaging in the care of patients with epilepsy: A consensus report from the International League Against Epilepsy Neuroimaging Task Force. Epilepsia epi.15612 (2019) doi:10.1111/epi.15612.
- Acquisition Working Group – Hippocampal Subfields Group. https://www.hippocampalsubfields.com/people/acquisition-working-group/.
- Knight, M. J., Wearn, A., Coulthard, E. & Kauppinen, R. A. T2 Relaxometry and Diffusion Tensor Indices of the Hippocampus and Entorhinal Cortex Improve Sensitivity and Specificity of MRI to Detect Amnestic Mild Cognitive Impairment and Alzheimer’s Disease Dementia. J. Magn. Reson. Imaging 49, 445–455 (2019).
- Emmerich, J. et al. Rapid and accurate dictionary-based T 2 mapping from multi-echo turbo spin echo data at 7 Tesla. J. Magn. Reson. Imaging 49, 1253–1262 (2019).
- Bauer, C. M., Jara, H. & Killiany, R. Whole brain quantitative T2 MRI across multiple scanners with dual echo FSE: Applications to AD, MCI, and normal aging. Neuroimage 52, 508–514 (2010).
- Rodionov, R. et al. T2 mapping outperforms normalised FLAIR in identifying hippocampal sclerosis. NeuroImage Clin. 7, 788–791 (2015).
- Winston, G. P. et al. Automated T2 relaxometry of the hippocampus for temporal lobe epilepsy. Epilepsia 58, 1645–1652 (2017).
- Iglesias, J. E. et al. A computational atlas of the hippocampal formation using ex vivo, ultra-high resolution MRI: Application to adaptive segmentation of in vivo MRI. Neuroimage 115, 117–137 (2015).
- HippocampalSubfieldsAndNucleiOfAmygdala - Free Surfer Wiki. https://surfer.nmr.mgh.harvard.edu/fswiki/HippocampalSubfieldsAndNucleiOfAmygdala.
Figures
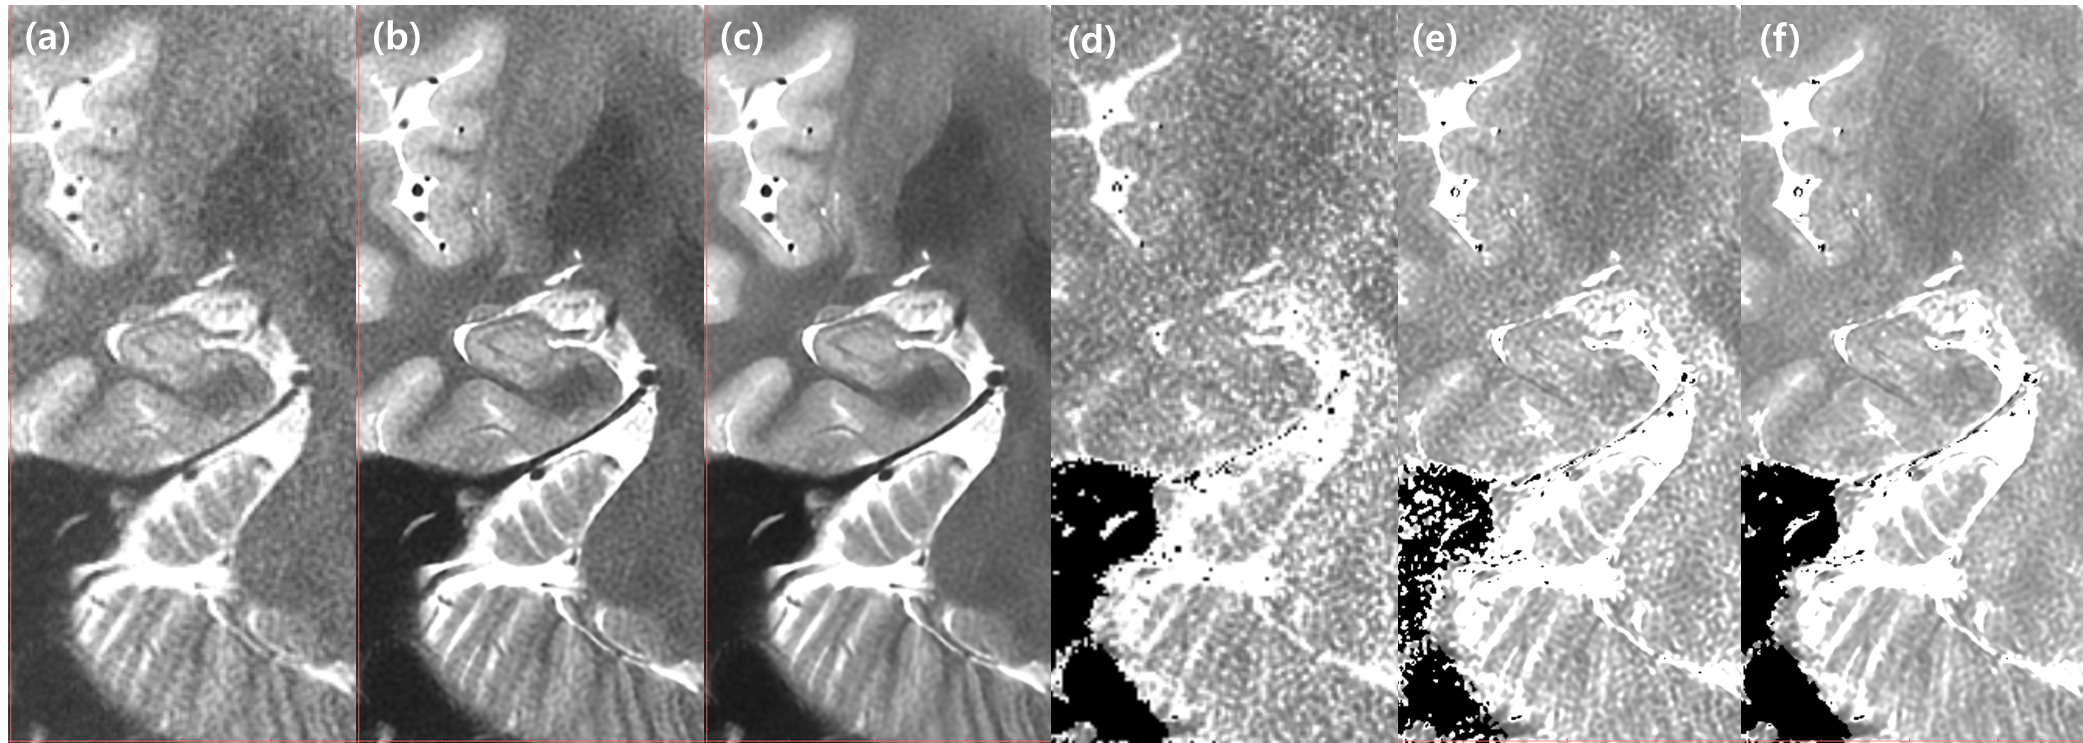
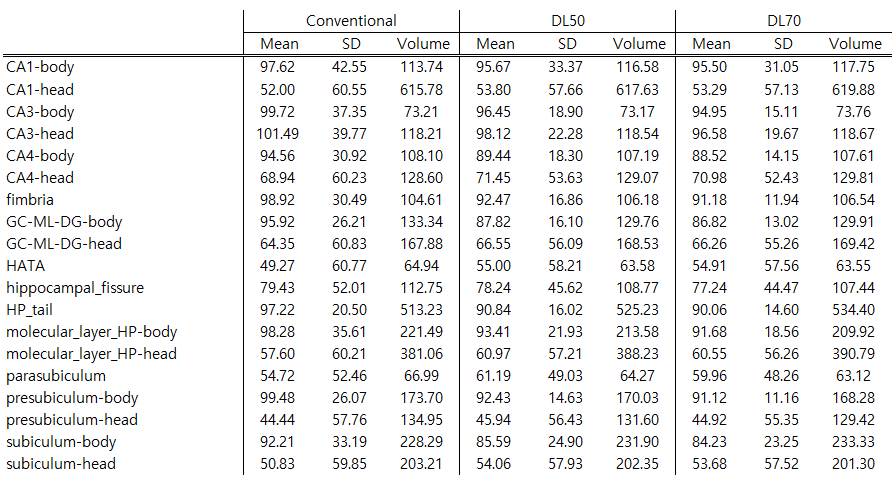
Table 1. Summary of mean and standard deviation of T2 values and volume of hippocampal subfields.
CA, cornu ammonis; GC-ML-DG, molecular and granule cell layer of dentate gyrus; HATA, hippocampal amygdaloid transition region; HP: hippocampus
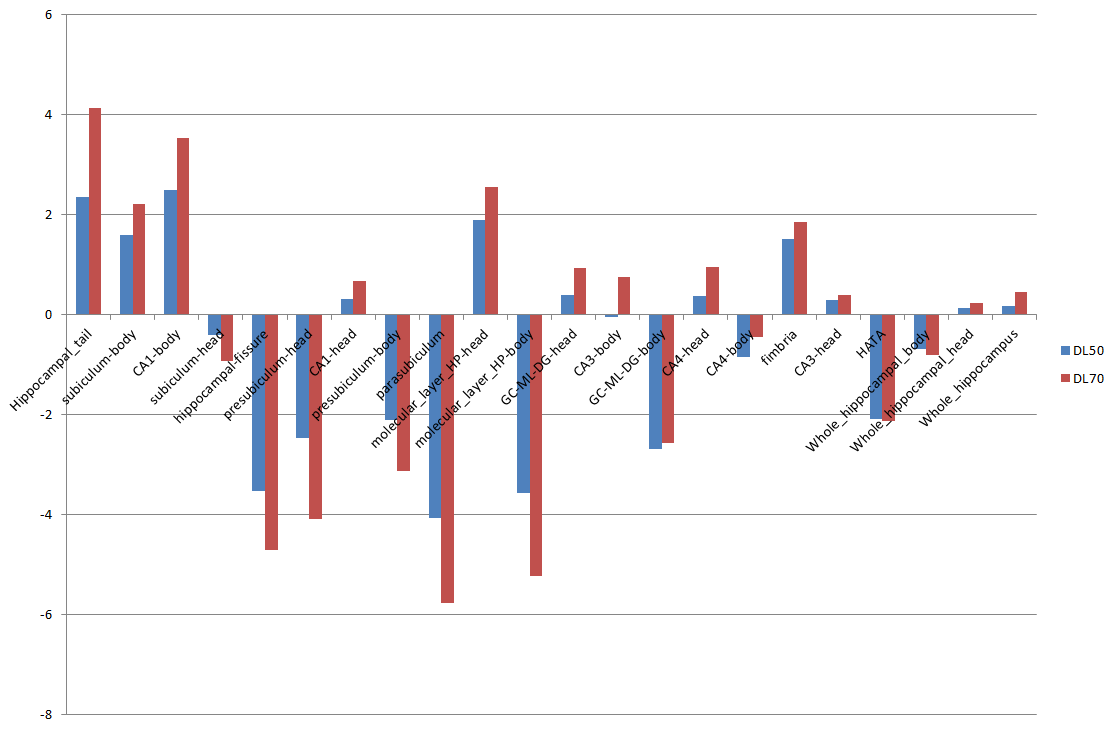
Figure 2. Percent difference of hippocampal subfield volumes based on conventionally reconstructed T2 weighted image-based segmentations as reference.
CA, cornu ammonis; GC-ML-DG, molecular and granule cell layer of dentate gyrus; HATA, hippocampal amygdaloid transition region; HP: hippocampus
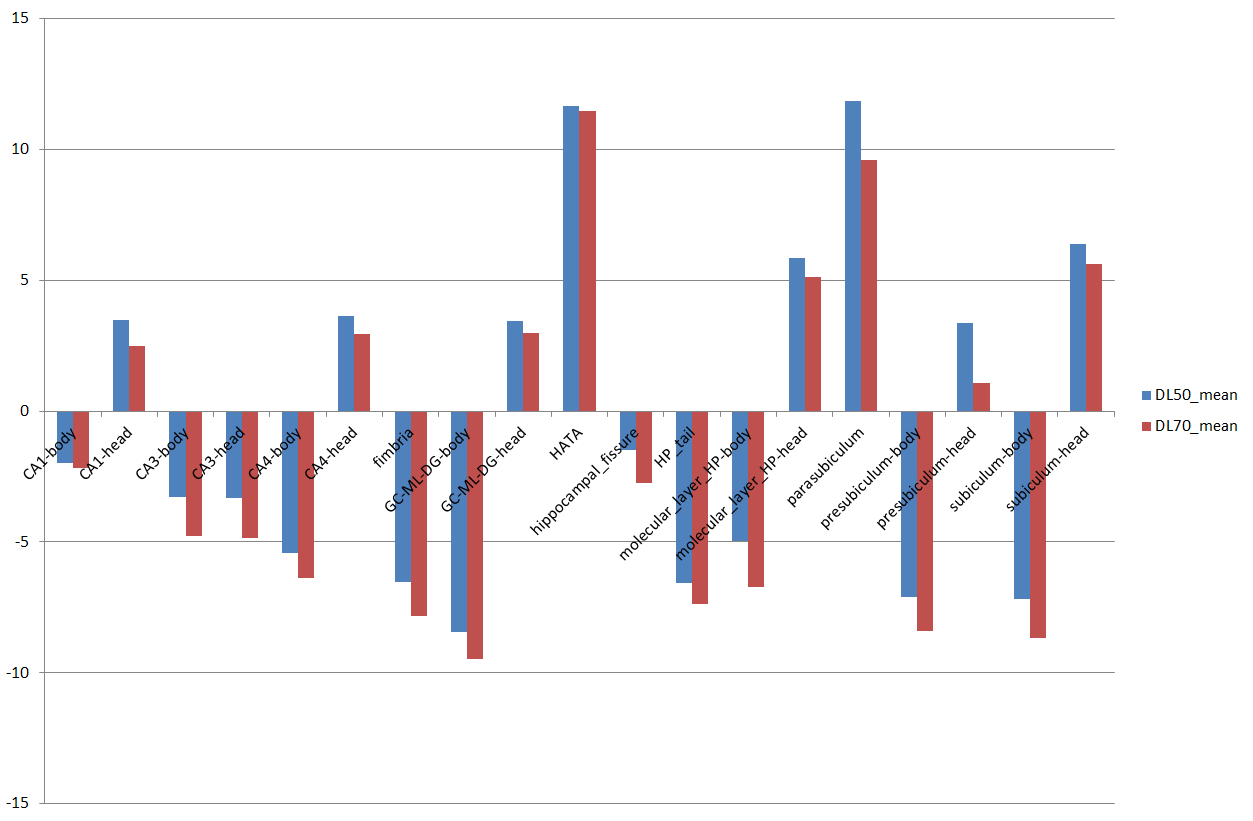
Figure 3. Percent difference of mean T2 values of hippocampal subfields with conventionally reconstructed dual-echo FSE based T2 mapping as reference.
CA, cornu ammonis; GC-ML-DG, molecular and granule cell layer of dentate gyrus; HATA, hippocampal amygdaloid transition region; HP: hippocampus
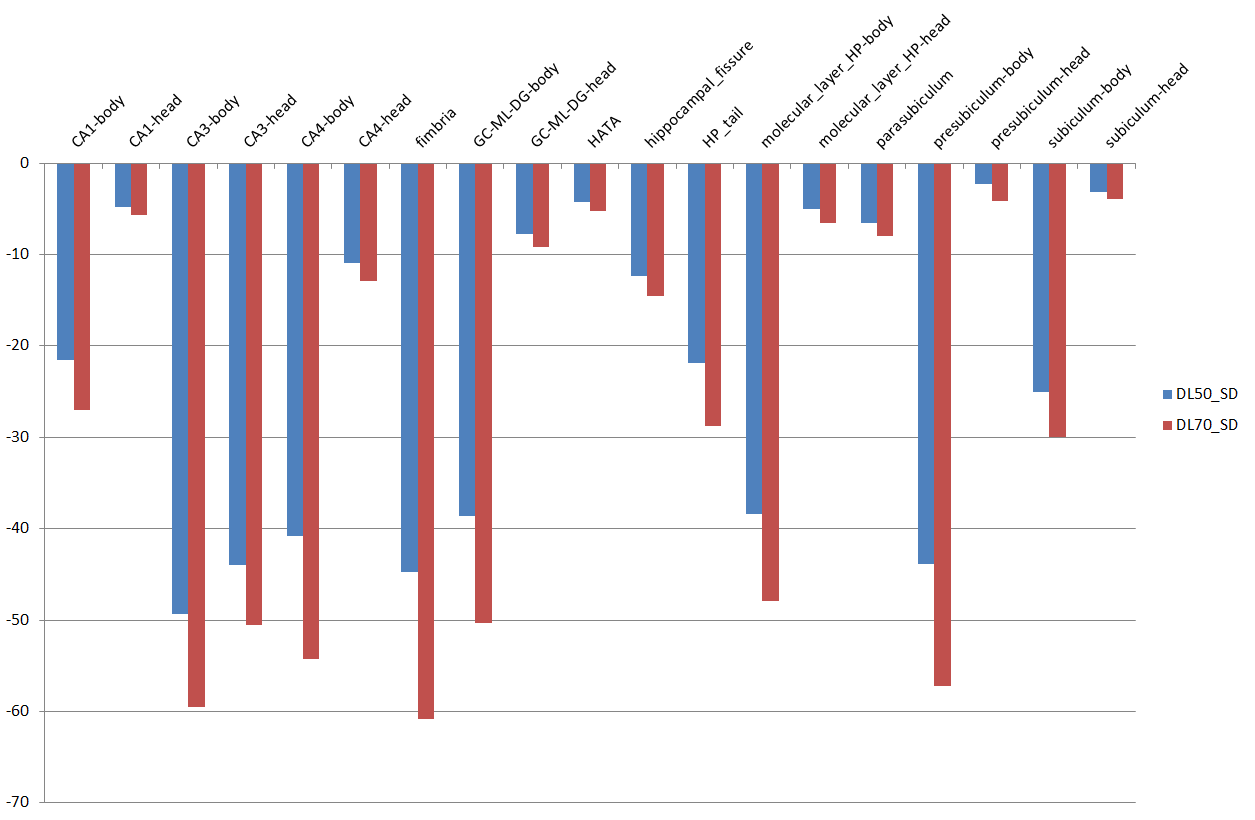
Figure 4. Percent difference of standard deviations of T2 values of hippocampal subfields with conventionally reconstructed dual-echo FSE based T2 mapping as reference.
CA, cornu ammonis; GC-ML-DG, molecular and granule cell layer of dentate gyrus; HATA, hippocampal amygdaloid transition region; HP: hippocampus