1880
Representation Learning of Fiber Tracts and Direct Comparison of Tract Distributions1Australian eHealth Research Centre, CSIRO, Herston, Australia, 2Department of Biomedical Sciences, Macquarie University, Sydney, Australia, 3Rapiscan Systems, Sydney, Australia
Synopsis
The distribution of fiber population in the whole brain can be inferred from the samples generated by tractography on diffusion MRI. In this paper, we modeled the distribution of fiber population globally based on representation learning method. Using deep neural networks, we performed dimension reduction on the fiber tracts, and modeled the fiber population by a probability distribution over a latent space in lower dimension. This method enabled us to identify tracts distributed with different densities when compared with another tractogram, and can thus be used to identify structural difference or to detect spurious tracts caused by probabilistic tractography.
Introduction
The white matter (WM) structure of the brain can be studied in vivo using diffusion MRI. High angular resolution diffusion imaging is now able to describe inter-subject or group differences in fiber populations within voxels. On a larger scale beyond voxel, statistical approaches have been developed to account for differences or anomalies in the connectivity between the nodes of a predefined network. On the scale of the whole brain, the WM fiber population is usually studied by tractography. To detect which fiber tracts are present with a higher or lower quantity in the tractogram, either due to structural variation of WM or spurious connections generated by tractography algorithms, requires inference from the sampled tracts the probabilistic distribution of WM fibers in the whole brain, and compare this distribution with a template or a group average. In this paper, we aimed to analyze the global distribution of WM fibers, to identify fiber bundles and tracts that have different distribution densities when compared to other tractograms, using a new method that models the global distribution of fiber population based on representation learning by deep neural network.Methods
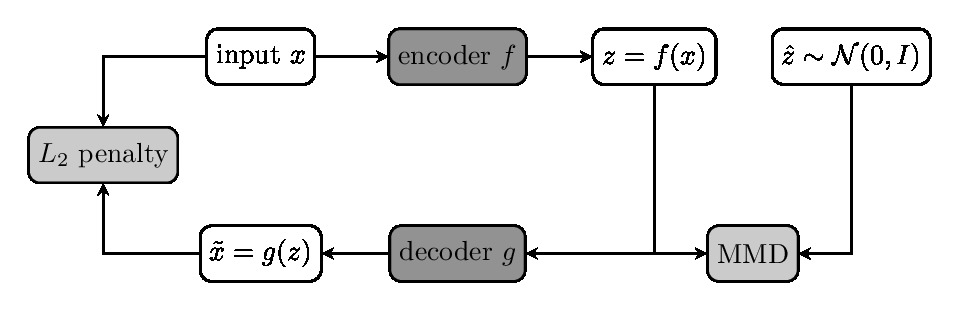
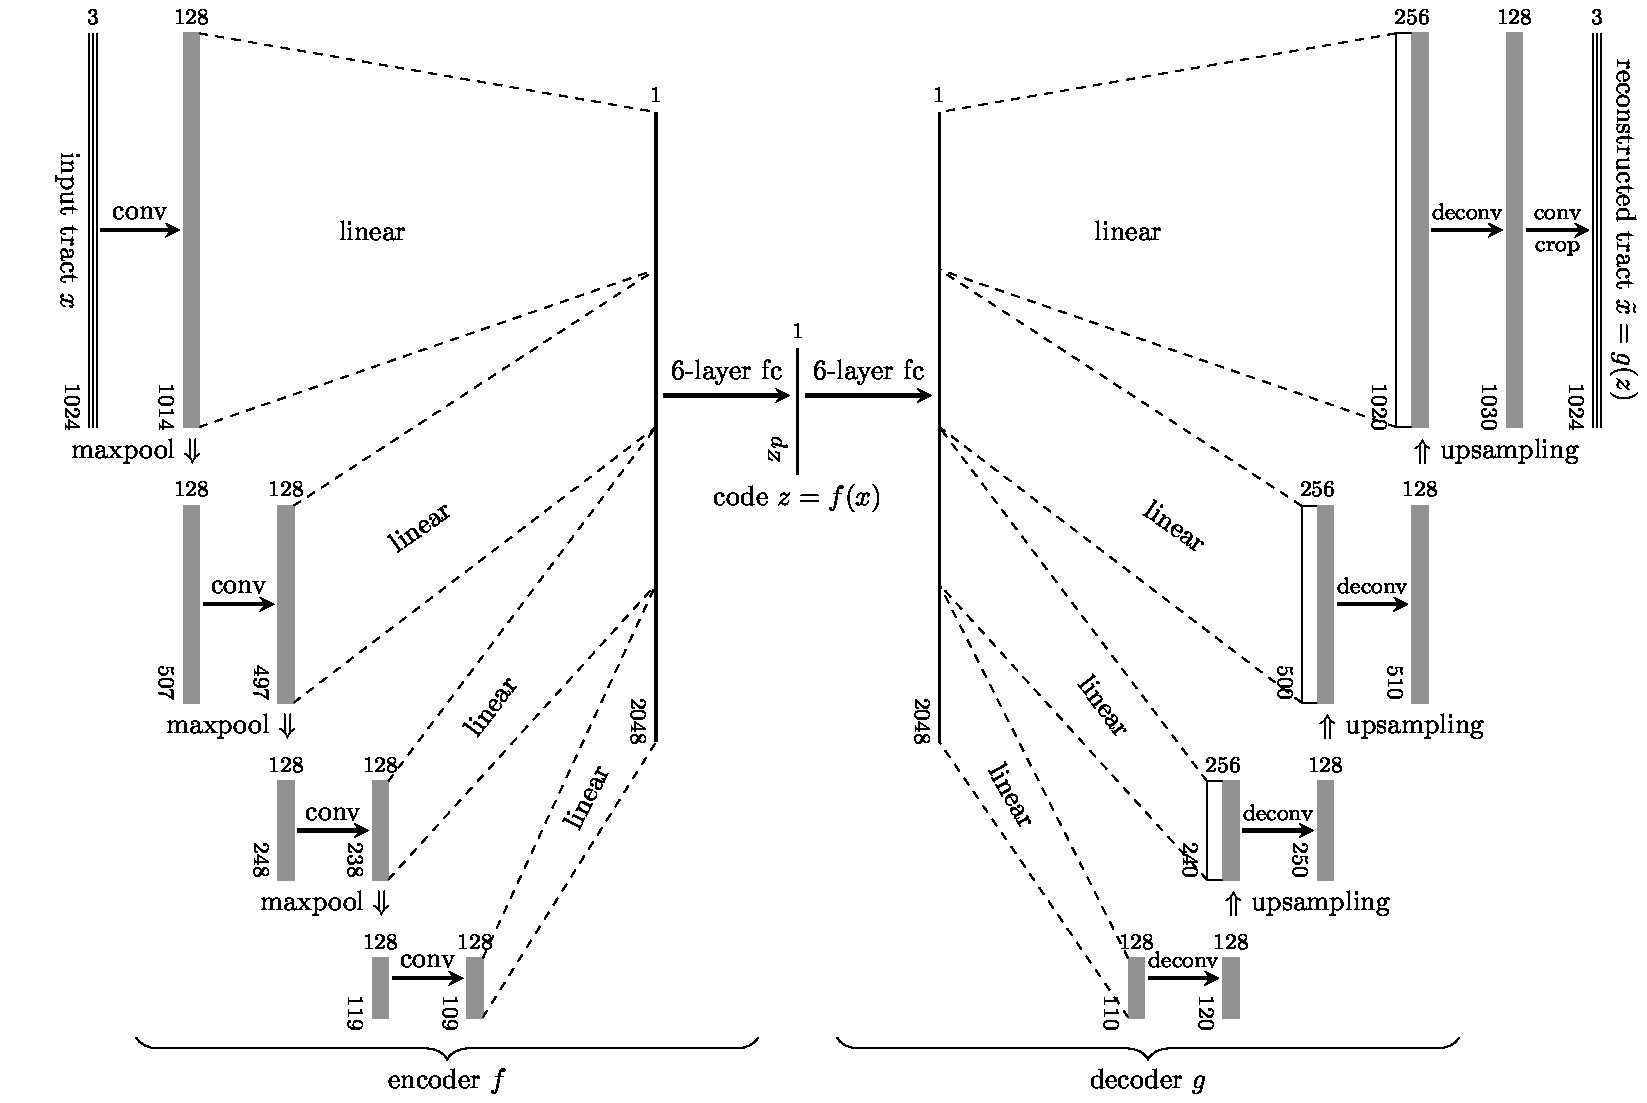
We used the diffusion and structural MRI data of eleven subjects (8M and 3F, aged 22–35 yo) of the Human Connectome Project (WU-Minn HCP Data), normalized to the standard MNI space. Multi-tissue constrained spherical deconvolution1 was used to estimate the fiber orientation distributions (FODs). We generated 2 million tracts from each diffusion image using Anatomically Constrained Tractography (ACT)2, which were filtered down by SIFT3 to approximately 800 thousand tracts per subject. This provided 8.8 million tracts in MNI space as a training set for representation learning.We modeled the tracts $$$\{x_i\}$$$ in a tractogram realizations of the used a random variable $$$X\in\mathcal{X}$$$ with a distribution $$$P_X$$$, which is locally described by the FODs. To model the global distribution $$$P_X$$$, we used the Wasserstein autoencoder (WAE)4 to learn a representation of $$$X$$$ in a latent space $$$\mathcal{Z}$$$ of lower dimension. WAE consists of an encoder $$$f$$$ and decoder $$$g$$$, both based on U-Net architecture5 which tries to match the training distribution $$$Q_Z=\int Q(Z|X)dP_X$$$ to a prior $$$P_Z\equiv\mathcal{N}(0, I)$$$ over $$$\mathcal{Z}$$$ minimizing the Wasserstein distance between them. WAE-MMD4 minimizes the objective function $$E(\|X- g\circ f(X)\|_2^2) + \lambda \cdot\text{MMD}(P_Z, Q_Z)$$ regularized by the kernel-based maximum mean discrepancy $$\text{MMD}(P_Z, Q_Z) = \left\|\int_\mathcal{Z}k(z,\cdot) \mathrm{d}P_Z(z) - \int_\mathcal{Z}k(z,\cdot) \mathrm{d}Q_Z(z)\right\|_{\mathcal{H}}$$ where $$$\mathcal{H}$$$ is the reproducing kernel Hilbert space introduced by the inverse multiquadratic kernel $$$k(\cdot,\cdot)$$$. Since the fiber tracts in tractograms are not of the same length, we first upsampled the tracts to the same length of 1024, preserving the geometrical features of tracts.
Once the tracts in a tractogram $$$\{x_i\}$$$ are mapped to $$$\{z_i\}$$$ in the latent space, we can model the distribution of tracts by studying the distribution $$$Q_Z$$$ instead. One approach is to compare $$$Q_Z$$$ with the density $$$Q_Z^t$$$ of a template tractogram $$$\{x_i^t\}$$$. We used the Kernel Mean Matching (KMM6) to weight the sample such that the weighted distribution $$$\beta(\cdot)Q_Z$$$ matches that of the template $$$Q_Z^t$$$. The weight $$$\{\beta_i\}$$$ for tract $$$\{x_i\}$$$ can be estimated by, and a score $$$\{s_i\}$$$ indicating the difference in density of tracts can be calculated $$$s_i=|\log(\beta_i)|$$$.
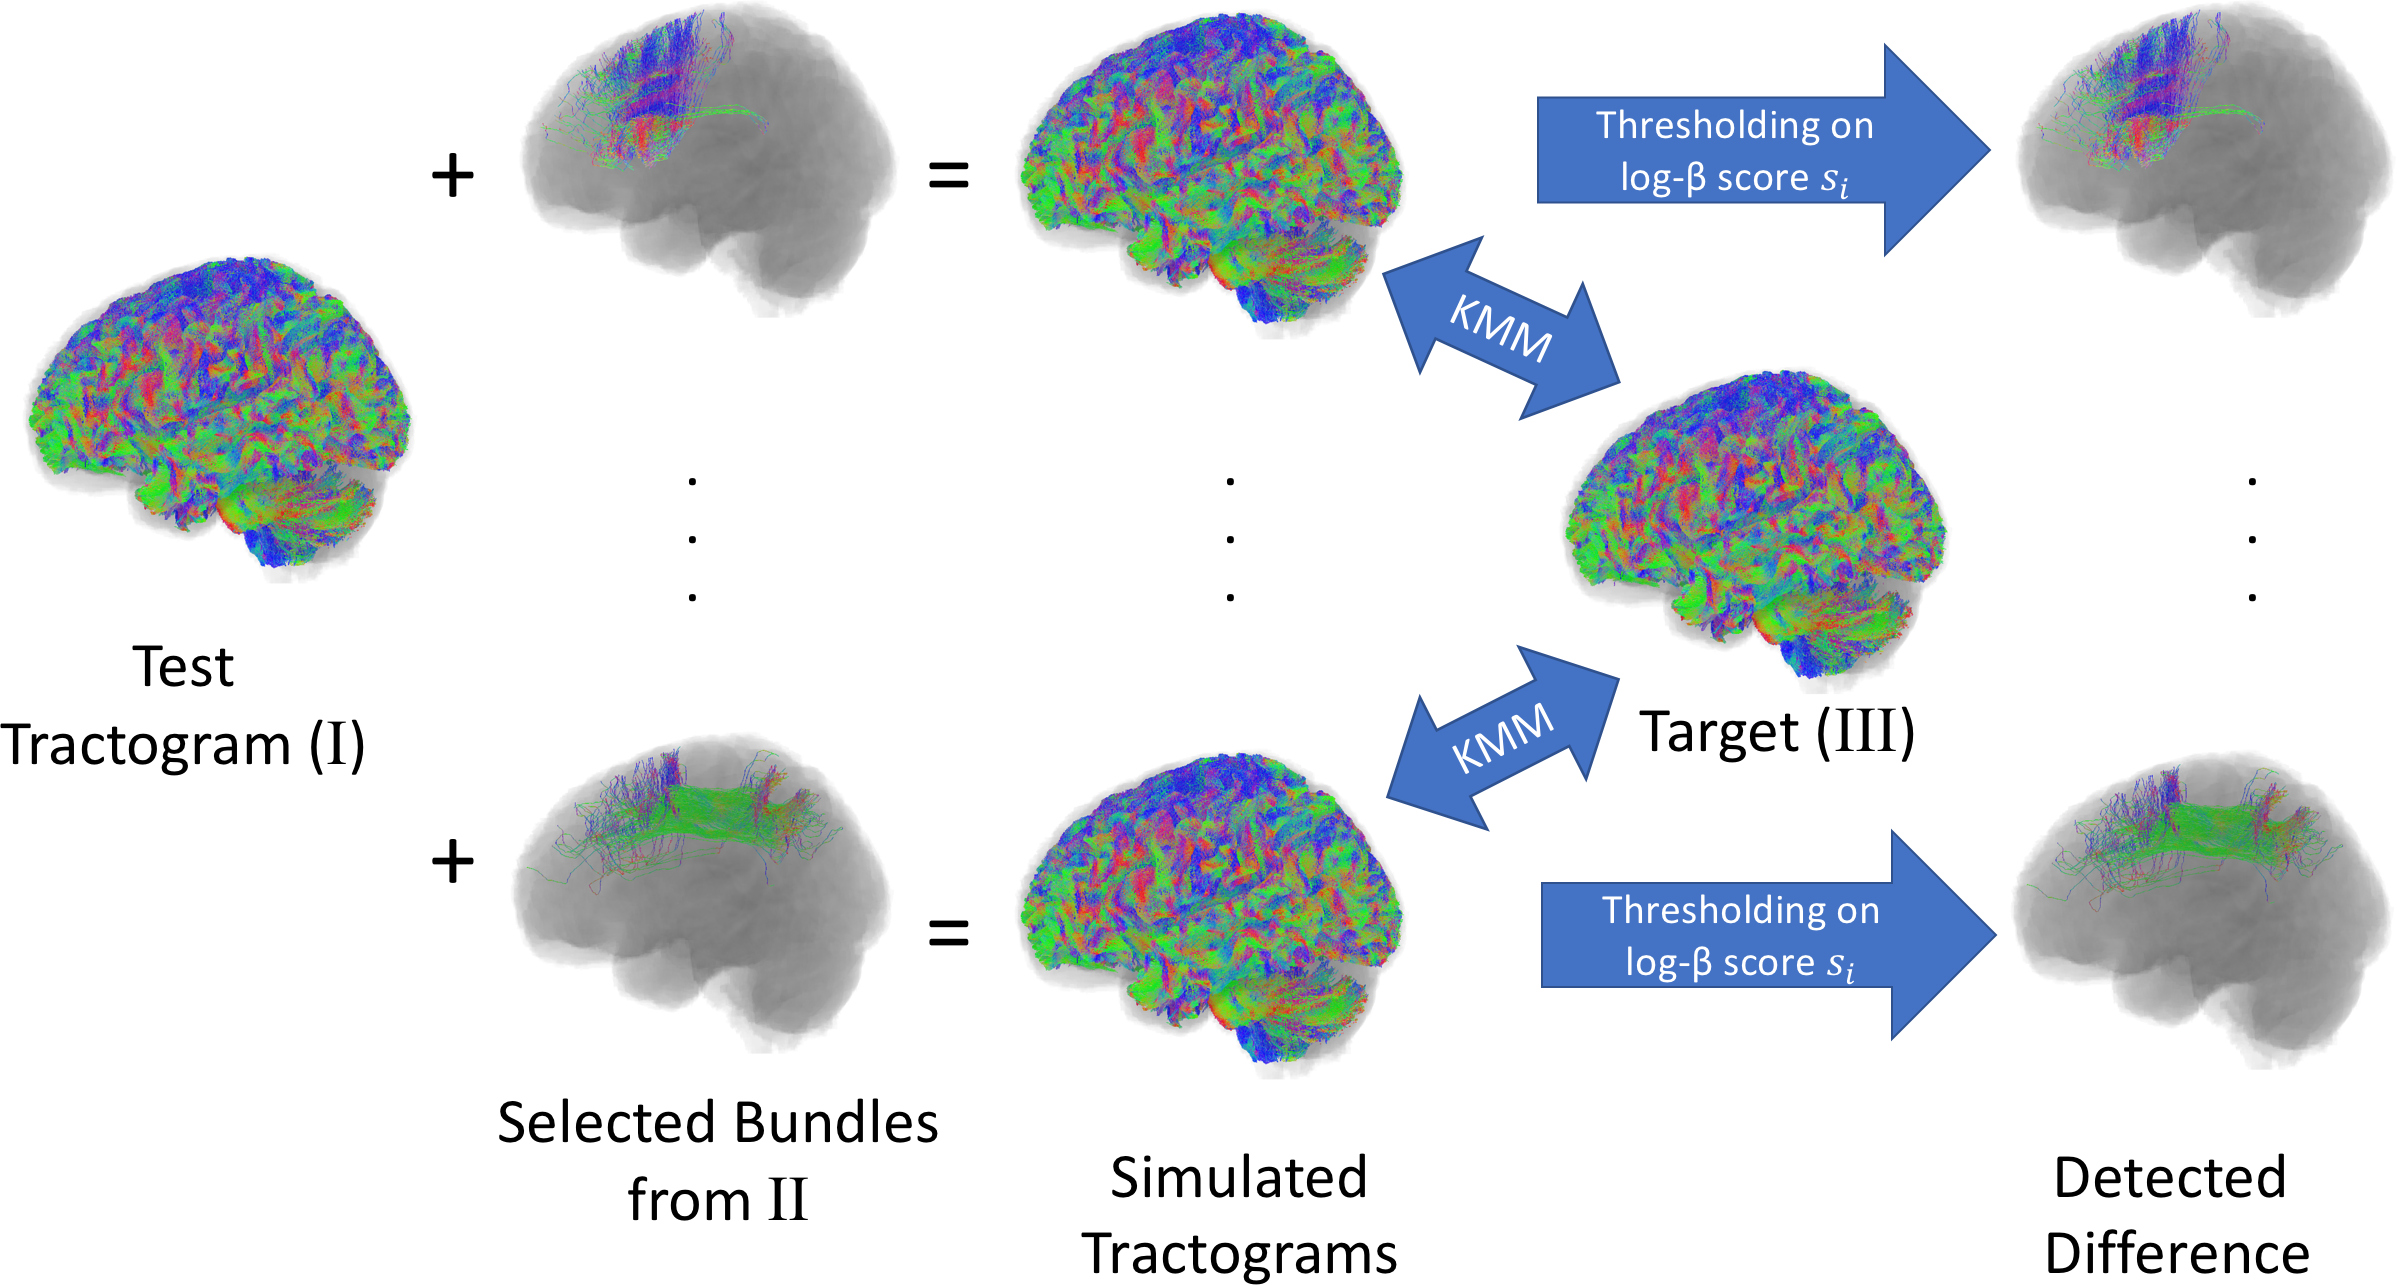
We evaluated the performance of our method in detecting difference in tract distributions by simulated variation of tractograms. For a given diffusion dataset, we generated three whole brain tractograms (I, II, and III) of 380,000 tracts each using ACT followed by SIFT. In experiments, we added to the test tractogram (I) individual bundles extracted from the tractogram II, and compared the combined tractogram with the target (III). The bundles were delineated as the connecting fibers between a pair of nodes defined by FreeSufer cortical parcellation or FSL FAST subcortical nuclei segmentation. Six bundles with 500-1300 tracts on average were used in experiments (0.1 – 0.3% of the whole tractogram). The added bundles can be detected based on $$$\{s_i\}$$$ scores. A tract is correctly identified if it connects to the same anatomical nodes as the added bundle. In addition to the AUC of ROC measure, we also used the precision@K7 to measure the precision (TP/K) when selecting the K tracts with highest $$$\{s_i\}$$$ scores.
Results
We are able to achieve an AUC of 89.4% in detecting the simulated additional fibers, with a precision@500 of 30.4%, equivalent to a false discovery rate of 59.6%, which was due to the imbalance in the sample: less than 0.5% of the fiber population was simulated difference with the rest identically distributed between the test and target tractograms. An improved the accuracy of detection can be reached by better estimation of $$$\beta$$$ using a larger number of generated fibers from tractography.Conclusion
We developed a new method to represent the tracts generated by tractography using WAE, which allows us to study the distribution of the WM fiber bundles and to assess their structural differences. This method would be used to remove invalid tracts generated by probabilistic tractography which do not represent known WM anatomy (with reference to manually labelled tract atlas), and be applied to group comparison between average tractograms generated from different populations.Acknowledgements
No acknowledgement found.References
1. Jeurissen B, Tournier J-D, Dhollander T, Connelly A, Sijbers J. Multi-tissue constrained spherical deconvolution for improved analysis of multi-shell diffusion MRI data. NeuroImage 2014;103:411–426.
2. Smith R E, Tournier J-D, Calamante F, Connelly A. Anatomically-constrained tractography: Improved diffusion MRI streamlines tractography through effective use of anatomical information. NeuroImage 2012;62(3):1924–1938.
3. Smith R E, Tournier J-D, Calamante F, Connelly A. SIFT: Spherical-deconvolution informed filtering of tractograms. NeuroImage 2013;67:298–312.
4. Tolstikhin I, Bousquet O, Gelly S, Schoelkopf B. Wasserstein Auto-Encoders. International Conference on Learning Representations (2018).
5. Ronneberger O, Fischer P, Brox T. U-Net: Convolutional Networks for Biomedical Image Segmentation. MICCAI 2015: 234–241.
6. Gretton A et al. Covariate Shift by Kernel Mean Matching. Dataset Shift in Machine Learning: 131–160. The MIT Press; 2008.
7. Joachims T. A Support Vector Method for Multivariate Performance Measures. Proceedings of the 22nd International Conference on Machine Learning: 377–384. ACM; 2005.
Figures