1876
Deep learning based image reconstruction for improved multiparameter mapping and synthetic MRI1Department of Imaging Physics, The University of Texas M.D. Anderson Cancer Center, Houston, TX, United States, 2MR Applications and Workflow, GE Healthcare, Waukesha, WI, United States, 3SyntheticMR, Linkoping, Sweden, 4Department of Radiology, The University of Texas M.D. Anderson Cancer Center, Houston, TX, United States
Synopsis
Images from a multiparameter mapping sequence were reconstructed with a novel deep learning based reconstruction (DL Recon) method trained to remove noise and enhance edges. Mean T1, T2, and PD values as measured in a system phantom differed by less than 0.6% between the DL and conventional reconstructions, while noise was lower in all measurements on DL Recon images. In vivo synthetic images also exhibited reduced noise and increased definition of structures. We find that the SNR and resolution benefits of DL Recon applied to raw MR data extend to improve the fitted relaxation maps and subsequent synthetic images.
Introduction
Deep learning based image reconstruction (DL Recon) offers the potential for increased SNR, reduced artifacts, and enhanced resolution. However, it is unclear if DL Recon affects the quantitative multiparameter mapping in synthetic MR imaging methods, by which multiple images are acquired with varying sequence parameters and then fitted or matched to spin models to produce maps of T1 and T2 relaxation times and proton density, PD. In this work, we investigate the effect of a DL Recon on the accuracy of multiparameter mapping by a clinically available synthetic imaging technique of Magnetic Resonance Image Compilation (MAGIC) [1].Methods
The DL Recon used in our study is a deep convolutional residual encoder network trained to reconstruct images from 2D MR data with reduced noise, reduced Gibbs ringing, and enhanced resolution. The network has an adjustable parameter that ranges between 0 and 100% to control the noise level of the final reconstructed images. We scanned the NIST / ISMRM system standard phantom (Model 130, QalibreMD, Boulder, CO) [2] with the MAGIC pulse sequence using an HNU coil on a 3T scanner (MR750, GE Healthcare, Waueksha, WI). Sequence parameters were matrix = 320x256, FOV = 22cm, thickness/gap =4mm/1mm, ETL=16, bandwidth = ±83.33kHz, TR=4000msec, ASSET acceleration factor=2. A total of 35 slices were acquired, including three of the slices placed through the centers of each ring of T1, T2, and PD reference spheres. Six human subjects were also acquired with similar parameters except thickness = 5mm, ETL = 12, bandwidth = ±20.83kHz, TR=4000-5000msec. In addition to all the standard images that were automatically generated with conventional reconstruction, the raw data of these phantom and in vivo scans were saved and reconstructed with DL Recon at 75% noise reduction level. Images by conventional reconstruction and DL Recon were processed offline with a dedicated mapping and image synthesis application (SyMRI, SyntheticMR, Linkoping, Sweden) to produce T1, T2, and PD parameter maps, as well as T1 and T2 weighted synthetic images. On the system phantom, ROI’s were drawn inside the reference spheres and analyzed for mean and standard deviation. In vivo images were qualitatively assessed for SNR and artifacts.Results
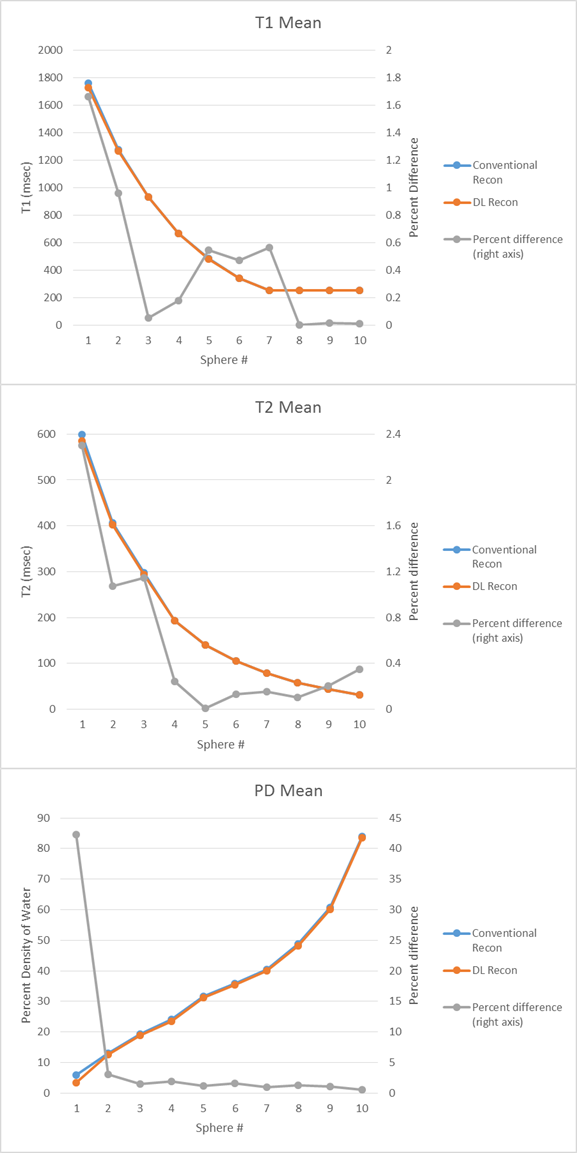
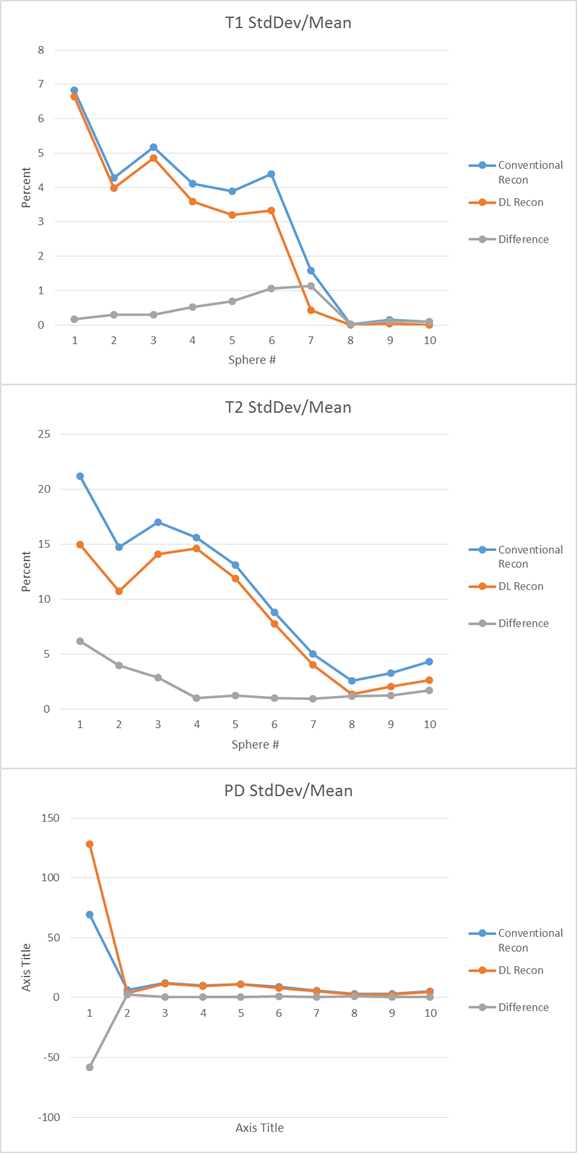
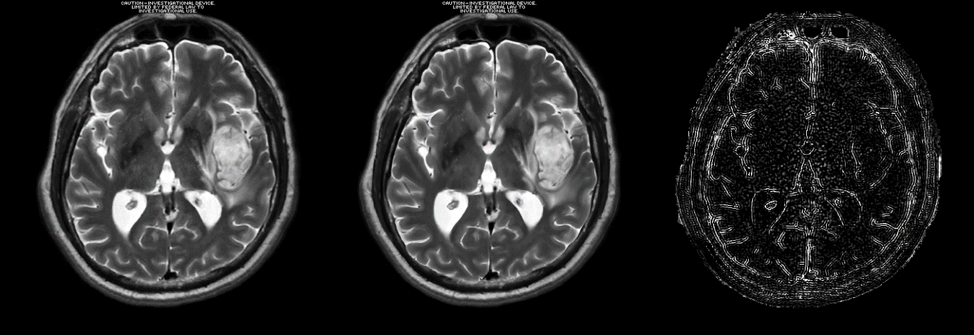
With DL Recon, normalized standard deviation decreased within each ROI except for the first PD sphere, which contained the lowest proton density. The percent difference of mean values between the two reconstructions differed by less than 1.7% for the T1 spheres within the range of 300-4000 ms and 2.3 percent for the T2 spheres within the range of 20 – 2000 ms. The greatest differences were observed at the longest relaxation times; when restricted to T1 ≤ 984 msec and T2 ≤ 194 msec, the means differed by less than 0.6%. Proton density of the first sphere differed dramatically, by over 42%, but by less than 3% for other spheres. Synthesized in-vivo images were noted to have less noise and sharper resolution with DL Recon when compared to conventional reconstruction.Discussion
Our study showed that DL Recon resulted in the expected benefits of reduced noise and image enhancement when applied to the raw data of the MAGIC sequence and did not lead to any bias or undesired scaling of the fitted relaxation parameters. DL Recon also had little or no effect on other image quality metrics such as shading or presence of artifact. We therefore conclude that DL recon can be advantageously applied to the synthetic imaging techniques such as MAGIC.In general, all values in the reference spheres were unaffected (difference less than 0.6%) except for very long or very short relaxation values that would not be representative of most clinically relevant tissues. Since the sequence parameters in MAGIC are not optimized for these extreme relaxation rates, small changes in signal would have a greater effect in those regions, though difference in mean relaxation values never varied greater than 1.7%. The large reduction in PD for the first reference sphere by DL Recon may be explained by the fact that the sphere contains only 5% density of water and the noise would introduce a bias in conventionally reconstructed magnitude images. Image filtering or smoothing on magnitude images would not be expected to correct bias created by Rician noise. However, DL Recon operates directly on complex raw data and could potentially reduce this bias in the reconstruction process.
We note that the total scan time was less than 6 minutes for 30 slices in our clinical MAGIC protocol, and the technique produces relaxation maps as well as synthetic images with multiple image contrasts. With DL Recon, it is possible to further reduce the scan time with little or no loss of image quality.
Acknowledgements
Prototype DL Recon and support was provided by GE Healthcare. Prototype SyMRI software and support was provided by SyntheticMR.References
1. Warntjes JB, Leinhard OD, West J, Lundberg P. Rapid magnetic resonance quantification on the brain: Optimization for clinical usage. Magn Reson Med. 2008 ; 60:320-9
2. Kathryn E Keenan, Karl F Stupic, Michael A Boss, Stephen E Russek, Thomas L Chenevert, Pottumarthi V Prasad, Wilburn E Reddick, Jie Zheng, Peng Hu, Edward F Jackson. Comparison of T1 measurement using ISMRM/NIST system phantom. Proc 24th ISMRM, #3290, 2016.
Figures