1875
The moderation effects of depression and anxiety on sleep-linked cortical morphology in general population1Huaxi MR Research Center (HMRRC), Functional and molecular imaging Key Laboratory of Sichuan Province, Department of Radiology, West China Hospital, Sichuan University, Chengdu 610041, China, Chengdu, China
Synopsis
It remains unclear whether cortical changes in poor sleep quality are modulated by emotional distress in the general population. An Elastic-Net Regularized Generalized Linear Models based on bootstrapping was implemented to acquire candidate regions for sleep quality. The moderation effects of emotional distress on the relationship between sleep quality and cortical morphometry were acquired by a hierarchical regression. The low level of emotional distress could offset positive correlation between sleep quality and dorsal anterior cingulate cortex (dACC) volume. The result indicates dACC volume enlargement might be a compensatory response to poor sleep quality, or a marker of resilience against recurrent emotional distress.
Introduction
There is a bidirectional relationship between sleep and mental health1. Previous studies also demonstrated that the association of sleep quality with brain structure could be complex and dynamic, and modulated by other variables2. Moreover, evidence has showed that emotion circuit may be a common neural mechanisms of sleep quality and emotional distress underlying the vicious circle3, 4, and this makes it especially interesting to identify levels of emotional states that may modulate the association between sleep quality and common neural substrates. In this study, we analyzed the association between sleep quality and cortical morphometry and their relations to emotional distress in general population. We expected that high levels of anxious and depressive symptoms could promote the correlation between sleep quality and candidate cortical regions.Methods
1. Demographics and ImageA total of 92 general population (44 female, age 26.5±5.78 years), sleep quality was measured using Pittsburgh sleep quality index(PSQI), both depression and anxiety symptoms was measured using Self-rating depression scale(SDS) and Self-rating anxiety scale(SAS) respectively, as well as other cognitive function test including Stroop color word test(SCWT), Trail making test(TMT). All scans were performed on a MR imaging scanner (Siemens Trio 3T) with a 32-channel head coil. FreeSurfer 6.0.0 was used to perform whole-brain surface-based morphometry.
2. Partial Correlation Analyses
An association between the sleep quality and emotional symptom scores, and cognitive scores was examined by partial correlation analysis after removing sex, age and education confounding variables.
3. GLM Analysis
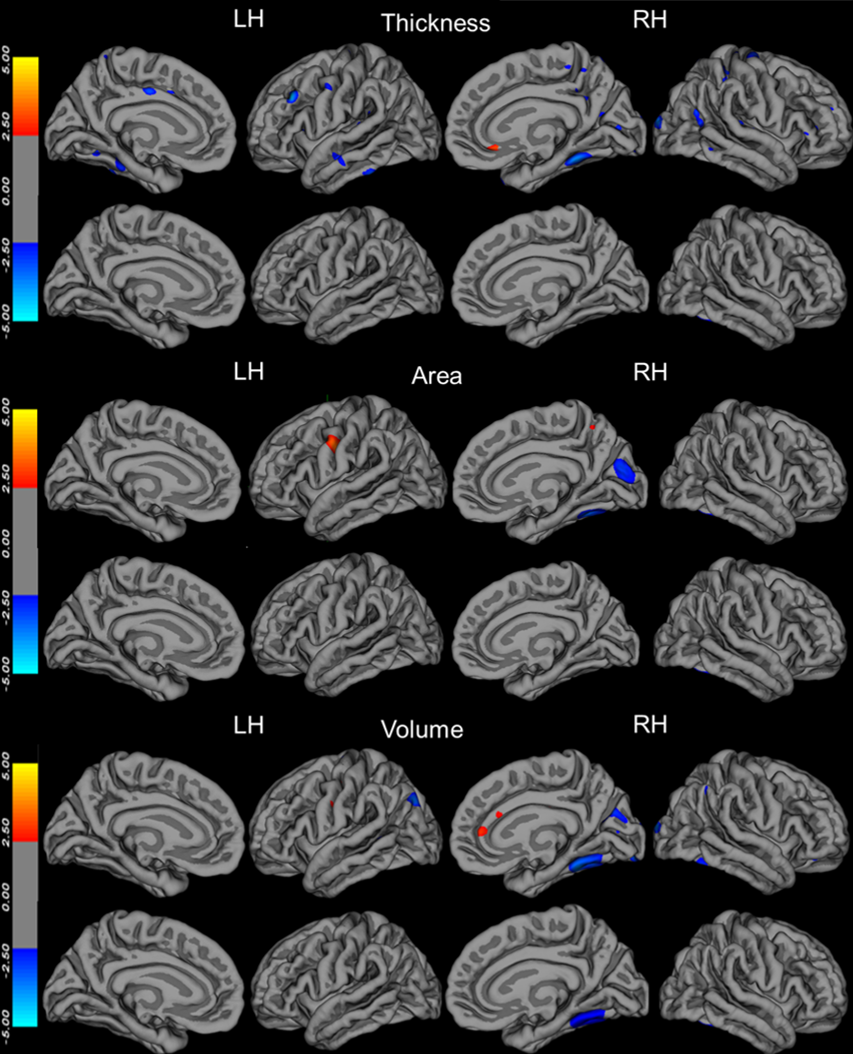
A vertexwise correlation analysis was conducted using the FreeSurfer Qdec application by fitting a GLM to assess the vertexwise correlations with respect to thickness, area and volume regarding PSQI for each hemisphere separately, accounting for the effects of sex, age and education to avoid spurious results.
4. GLMNET based on Booststrap Analysis
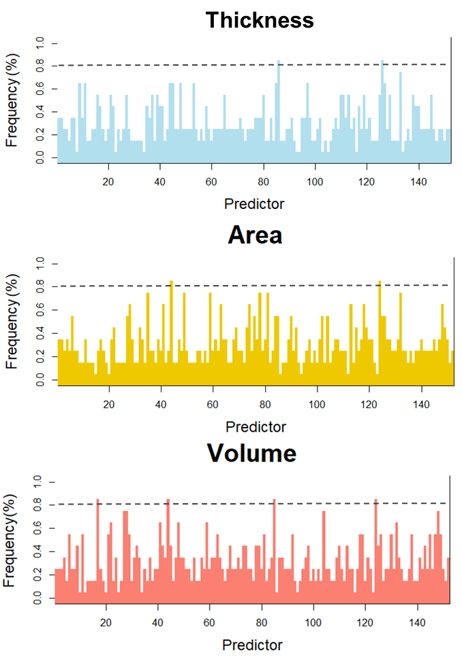
We extracted for 148 cortical regions (74 per hemisphere) using the aparc.a2009s template (Destrieux et al., 2010) for each hemisphere separately. PSQI was predicted by the extracted cortical thickness, area, volume, and demographic information (age, sex and education) using the GLMNET based on 5000 bootstrapped samples5, and the frequency at which each cortical region was chosen was recorded. Cortical regions were considered important for predicting PSQI if they were chosen in ≥80% or more bootstraps.
5. Moderation analysis
Moderation analysis was used to analyze the effects of depression and anxiety on the relationship between sleep quality and candidate regions from the above GLM and Booststrap analysis6. The interaction effects were indicated by the simple-slopes analysis.
Results
The demographics and clinical characteristics of the participants are shown in Table 1. There was a highly significant correlation between PSQI and SDS, and SAS by partial correlation analysis after removing sex, age and education confounding variables. However, there was not a significant correlation between PSQI and stroop interference ensues (SIE), and TMT_B-A.The vetex-wise correlation analysis for PSQI to investigate association with cortical thickness, area and volume revealed a significant volume in Fusiform cortex (2.95,-39.47,-50.25, Vertex=344, lg(p)=-2.25) regarding PSQI(Fig. 1). The elastic net regression analysis for PSQI resulted in 2 distinct regions for thickness, 2 distinct regions for area and 4 distinct regions for volume that were selected with a frequency of ≥80% based on PSQI (Fig. 2).
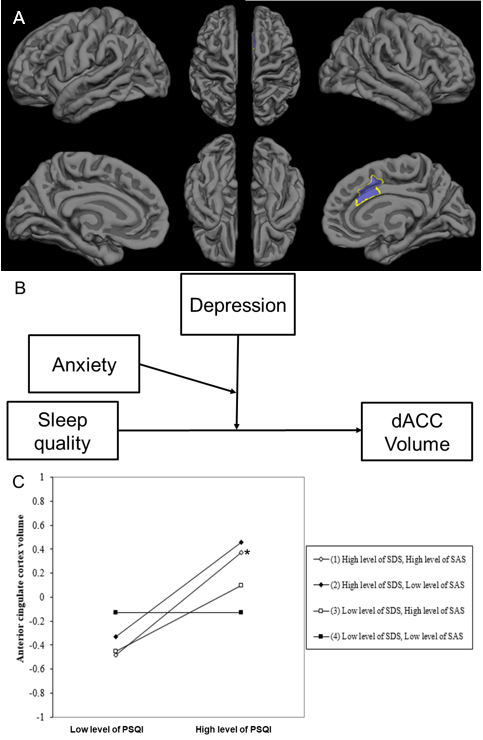
There are no moderation effects of SDS and (or) SAS on the relationship between PSQI and Fusiform volume. The results of moderation analysis for GLMNET are presented in Table 2. Three main effects emerged for dorsal anterior cingulate cortex (dACC) volume on SDS, SAS and PSQI, and Three two-way interaction effect emerged for dACC volume between PSQI and both SDS and SAS, F (3, 83) =0.764, p =0.518, ΔR2 = 0.024. A three-way interaction effect emerged for dACC volume between PSQI and both SDS and SAS, F (1, 82) = 5.251, p = .024, ΔR2 =0.053 (Fig 3).
Discussion & Conclusion
To the best of my knowledge, this is the first study to present data on prospective associations between sleep quality and dACC volume in general population and on the benefits of the positive emotional state in buffering this process. That is, lower levels of depressive or anxious symptoms might offset positive correlation between poor sleep quality and increased dACC volumes. The present study provided an integrative understanding of the role of dACC in sleep regulation process 4, 7, 8 and presented the neuroimaging substrate of poor sleep quality and relation with psychosocial problems in general population. These results indicate dACC volume enlargement might be a compensatory response triggered by higher levels of depressive and anxious symptoms to poor sleep quality or a marker of resilience against recurrent emotional distress in general population.Acknowledgements
This study was supported by National Nature Science Foundation (Grant NO. 81671669), Science and Technology Project of Sichuan Province (Grant NO. 2017JQ0001)References
1. Alvaro PK, Roberts RM, Harris JK. A Systematic Review Assessing Bidirectionality between Sleep Disturbances, Anxiety, and Depression. Sleep 2013;36:1059-1068.
2. Sexton CE,
3. Mander BA, Rao V, Lu B, et al. Prefrontal atrophy, disrupted NREM slow waves and impaired hippocampal-dependent memory in aging. Nat Neurosci 2013;16:357-364.
4. Wassing R, Schalkwijk F, Lakbila-Kamal O, et al. Haunted by the past: old emotions remain salient in insomnia disorder. Brain 2019;142:1783-1796.
5. Juttukonda MR, Franco G, Englot DJ, et al. White matter differences between essential tremor and Parkinson disease. Neurology 2019;92:e30-e39.
6. Hayes AF, Rockwood NJ. Regression-based statistical mediation
and moderation analysis in clinical research: Observations, recommendations,
and implementation. Behaviour research and therapy 2017
7. Cirelli C, Tononi G. Is sleep essential?
8.
Figures