1868
An end-to-end MR-based classification of arteriolar sclerosis using 3D convolutional neural networks1Biomedical Engineering, Illinois Institute of Technology, Chicago, IL, United States, 2Rush Alzheimer's Disease Center, Rush University Medical Center, Chicago, IL, United States
Synopsis
Arteriolar sclerosis is common in the brains of older adults and has been shown to be associated with cognitive decline and dementia. Definitive diagnosis of arteriolar sclerosis is only possible at autopsy. The purpose of this work was to develop an end-to-end deep learning model to predict the presence of severe arteriolar sclerosis from MR images without the need to extract hand-engineered features. The model was developed by combining ex-vivo MRI and pathology data in a large community-based cohort of older adults.
Introduction
Arteriolar sclerosis is common in the brains of older adults and has been shown to be associated with cognitive decline and dementia1. Definitive diagnosis of arteriolar sclerosis is only possible at autopsy. Traditional machine learning algorithms for classification require hand-engineered features as inputs, which is typically a time-consuming approach. The goal of this work was to develop an end-to-end deep learning model2 to predict the presence of severe arteriolar sclerosis from MR images without the need to extract additional features. The model was developed based on ex-vivo MRI and pathology data in a large community-based cohort of older adults.Methods
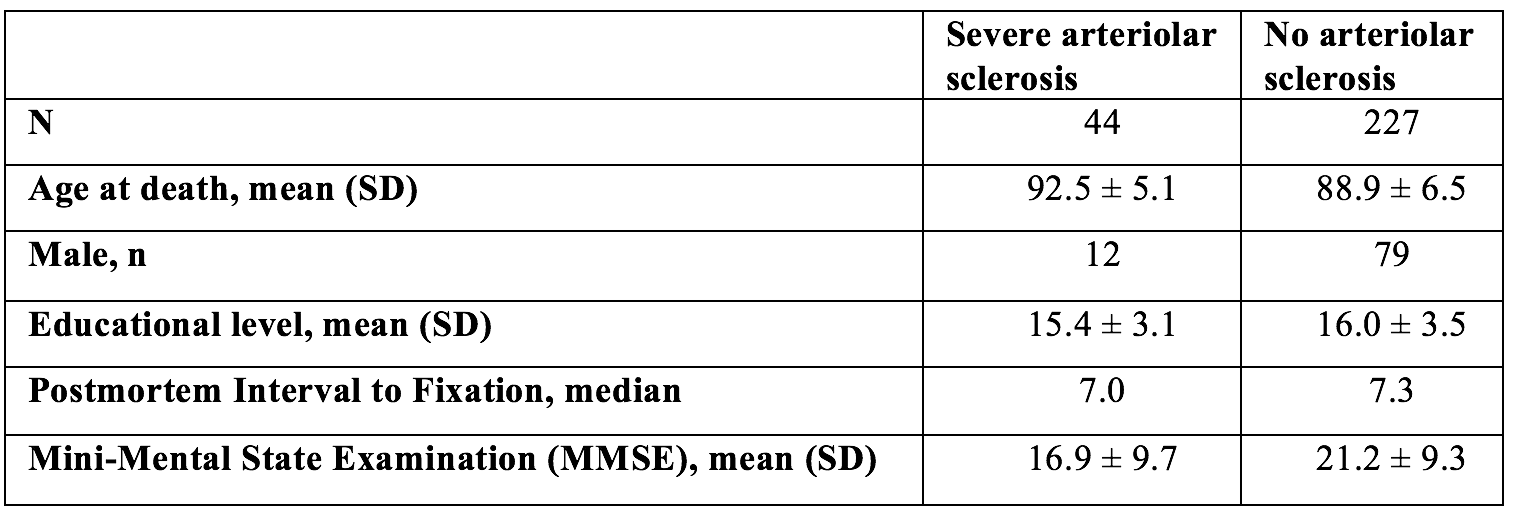
Postmortem data and preprocessingCerebral hemispheres were obtained from 271 participants of the Rush Memory and Aging Project3 (MAP) and Religious Orders Study4 (ROS), two longitudinal cohort studies of aging (Fig.1). A brain hemisphere from each participant was imaged ex-vivo on a clinical 3T MRI scanner, while immersed in 4% formaldehyde solution. Following ex-vivo MRI, all hemispheres underwent detailed neuropathologic examination by a board-certified neuropathologist blinded to clinical and imaging findings. All ex-vivo MR images were first z-score normalized, and then rigidly registered to an ex-vivo template. The final image size was 185x185x70 voxels with a voxel resolution of 1x1x1 mm3.
Deep learning based classification of arteriolar sclerosis
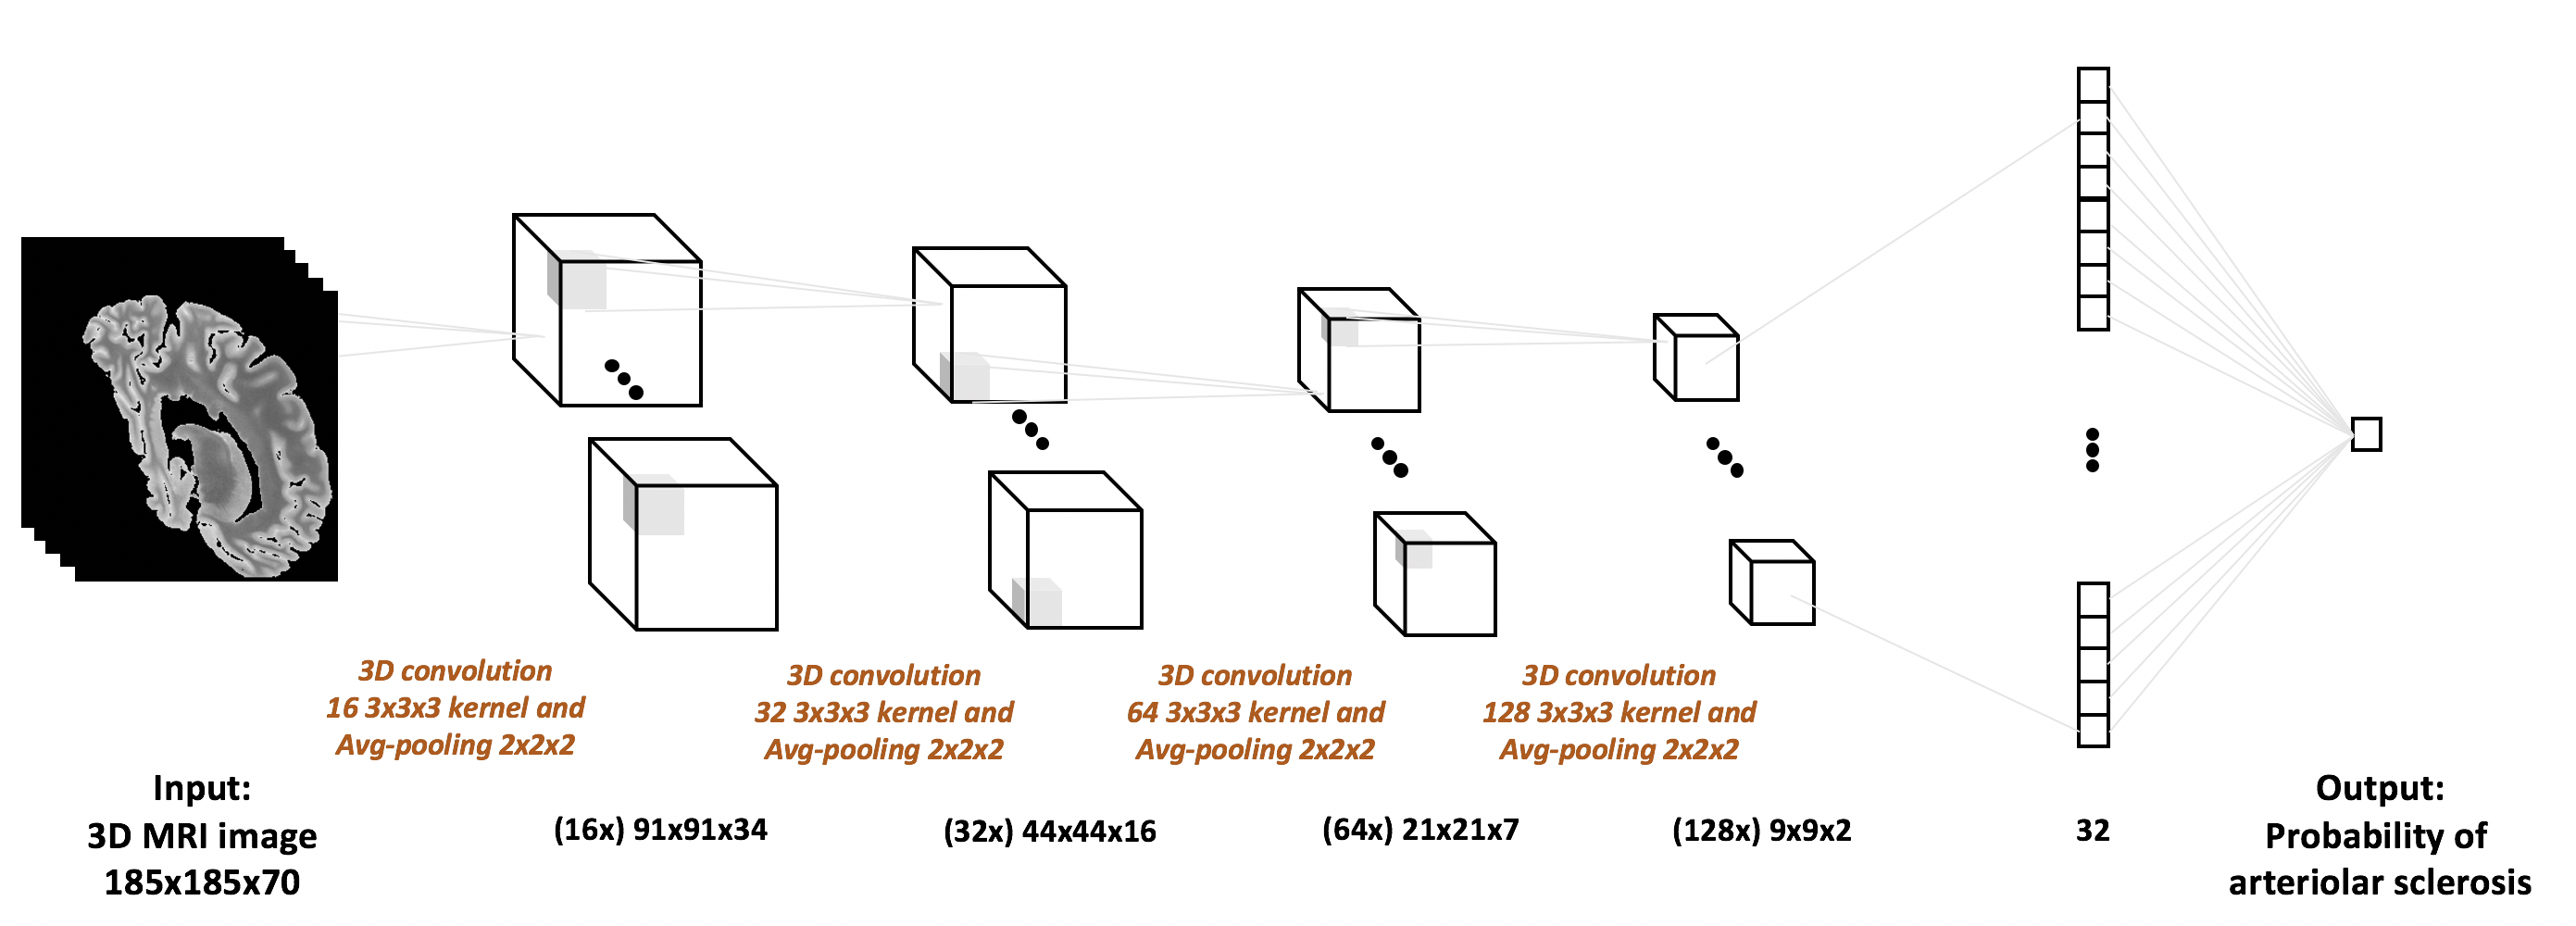
For the end-to-end classification of arteriolar sclerosis, a 3-dimensional convolutional neural network (3D-CNN) was built in Keras (Fig.2). The 3D-CNN consists of four convolutional layers with 16, 32, 64, and 128 kernels, respectively, and one fully connected (FC) layer with 32 nodes. In order to reduce the computation complexity of the network, an average-pooling layer was added after each convolutional layer. Rectified linear unit was used as the activation function in all layers. Due to the small number of data available for training, $$$l2$$$-regularization and dropout were added to the model. Binary cross-entropy loss was used as the loss function, minimized by the Adam optimizer. Performance evaluation involved 100 repeats of stratified shuffle split cross-validation with 80% of the data used for training, 10% for validation, and 10% for testing.
Results
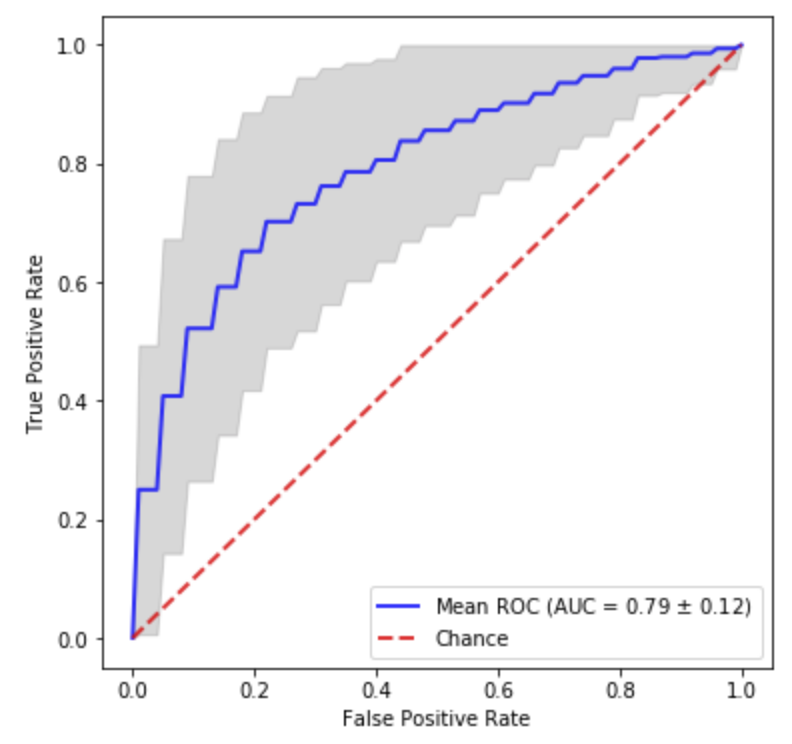
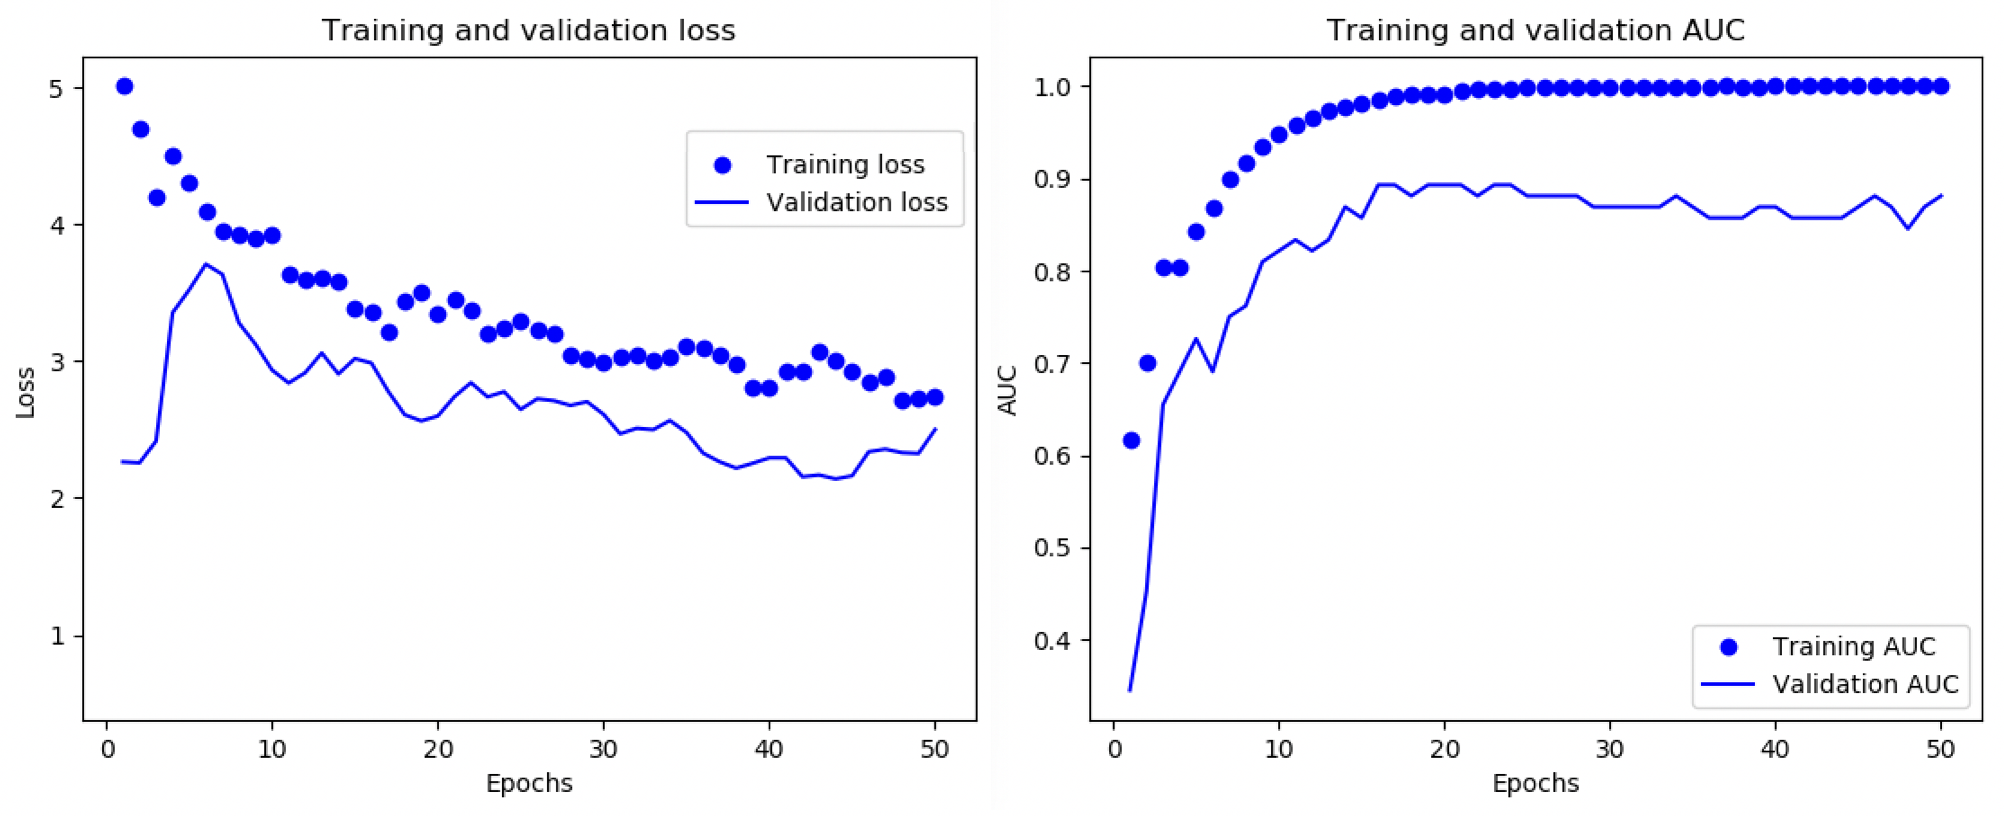
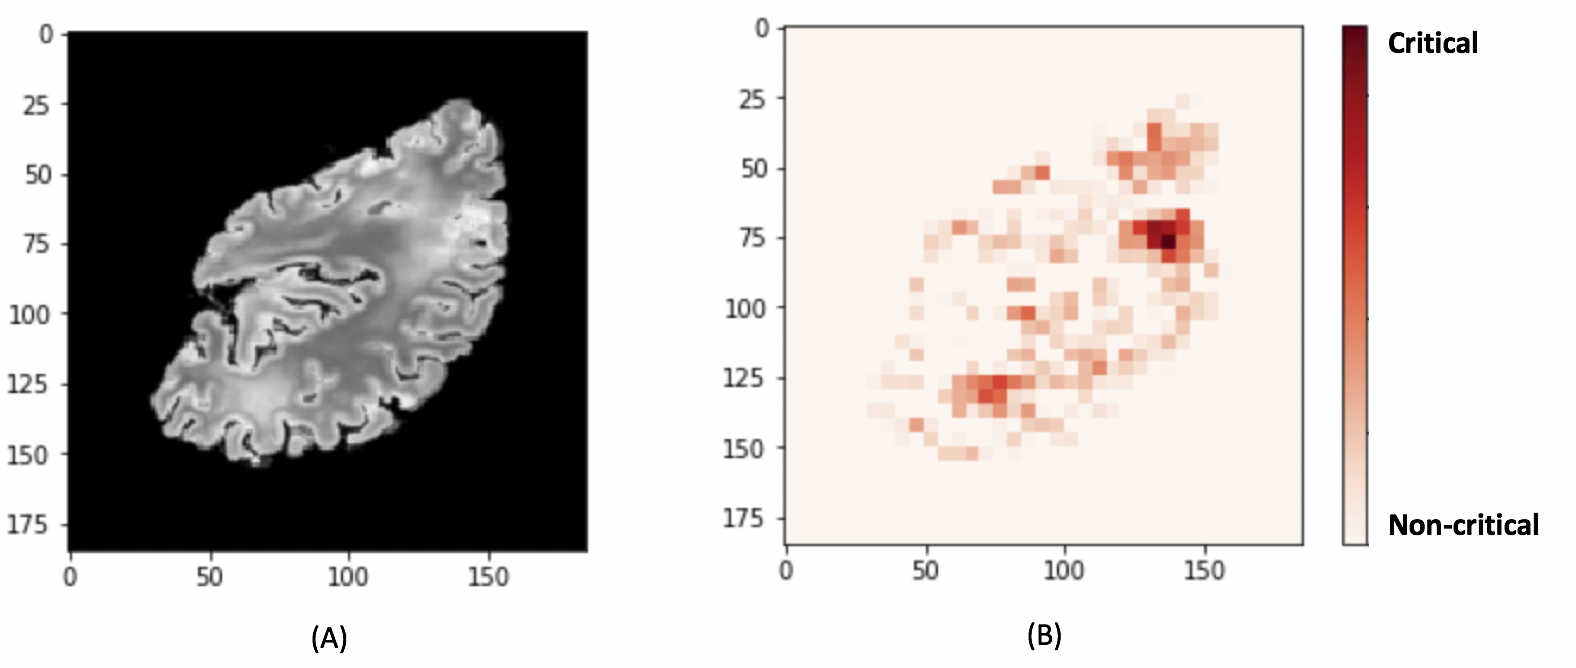
The 3D-CNN achieved an average area under the receiver operating characteristic curve (AUC) of 0.79 (Fig.3). A representative loss curve and AUC curve for a single repeat of the cross-validation is shown in Fig.4. A heatmap is produced for a random subject that has severe arteriolar sclerosis by sliding a zero-valued 5x5 window through a middle slice to visualize the relative importance of different locations in the hemisphere for classification (Fig.5).Discussion
A novel classifier of arteriolar sclerosis using deep learning techniques was developed in this work. The classifier’s performance was superior than chance (AUC=0.5). The performance of the classifier was also superior to that of a classifier based exclusively on white matter hyperintensity (WMH) information, which is considered as a marker of small vessel disease5,6 (p<0.05). Also, the heatmap visualization showed parts of the brain with high WMH volume to be important in driving the final confidence score of the pathology. Since, our classifier is trained only on extreme subjects, who do not have arteriolar sclerosis, or have severe arteriolar sclerosis, in the next step, we will utilize a transfer learning strategy in order to learn more severity levels (the mild and moderate condition) of the pathology in a multi-class setting.Conclusion
An end-to-end deep learning based classifier was developed for predicting severe arteriolar sclerosis without the need for time-consuming feature extraction steps. This is an ongoing project, and we will test the classifier in-vivo. Successful development of an arteriolar sclerosis classifier would be useful in designing clinical trials.Acknowledgements
This study was supported by National Institutes of Health grants P30AG010161, UH2NS100599, UH3NS100599, R01AG064233, R01AG17917.References
1. Arvanitakis Z, Capuano AW, Leurgans SE, Bennett DA, Schneider JA. Relation of Cerebral Vessel Disease to Alzheimer’s Disease Dementia and Cognitive Function in Older Persons: A Cross-sectional Study. The Lancet Neurology. 2016;15(9):934-943.
2. Esmaeilzadeh S, Belivanis DI, Pohl KM, Adeli E. End-to-end Alzheimer’s disease diagnosis and biomarker identification. In: Shi, Y., Suk, H.-I., Liu, M. (eds.) MLMI 2018. LNCS, vol. 11046, pp. 337–345. Springer, Cham (2018).
3. Bennett DA, Schneider JA, Buchman AS, et al. Overview and findings from the Rush Memory and Aging Project. Curr Alzheimer Res 2012;9:646–663.
4. Bennett DA, Wilson RS, Arvanitakis Z, et al. Selected findings from the Religious Orders Study and Rush Memory and Aging Project. J Alzheimers Dis 2013;33 Suppl 1:S397-403.
5. Debette S, Markus HS. The clinical importance of white matter hyperintensities on brain magnetic resonance imaging: systematic review and meta- analysis. BMJ 2010;341:c3666.
6. Erten-Lyons D, Dodge HH, Woltjer R, et al. Neuropathologic basis of age-associated brain atrophy. Neurology 2013;70:616-622.
Figures