1864
Brain graph representation of structural disconnectivity estimated with an atlas-based approach in multiple sclerosis1Advanced Clinical Imaging Technology, Siemens Healthcare, Lausanne, Switzerland, 2Department of Radiology, Lausanne University Hospital and University of Lausanne, Lausanne, Switzerland, 3Medical Imaging Processing, École Polytechnique Fédérale de Lausanne (EPFL), Lausanne, Switzerland, 4Department of Neurology and Center of Clinical Neuroscience First Faculty of Medicine, Charles University and General University Hospital in Prague, Prague, Czech Republic, 5MR unit, Department of Radiology First Facutly of Medicine, Charles University and General University Hospital in Prague, Prague, Czech Republic, 6LTS5, Ecole Polytechnique Fédérale de Lausanne (EPFL), Lausanne, Switzerland
Synopsis
In multiple sclerosis, the correlation between clinical scores and classical radiological metrics is poor (“clinico-radiological paradox”). To improve the prediction of future disease course, we suggest to study structural brain disconnectivity resulting from white matter lesions. We proposed an atlas-based approach to quantify structural disconnectomes without diffusion imaging, as it is typically not part of clinical routine MR protocols for multiple sclerosis. The disconnectome was modelled as a graph where brain regions are vertices and affected connections edges. Our method provides a new representation of brain disconnectivity that enables to stratify multiple sclerosis patients in two groups with different prognosis.
Introduction
Establishing an individual prognosis in heterogeneous neurological diseases such as multiple sclerosis is a challenging task for neurologists. Moreover, in multiple sclerosis, clinical disability correlates poorly with the classical radiological measures based on lesion load (e.g. lesion count), yielding the so-called ‘clinico-radiological paradox’.Previous studies showed the clinical relevance of characterizing lesion location within the major white matter tracts using an atlas-based approach to overcome the limitations that come with the absence of diffusion imaging in clinical MR protocols1 for multiple sclerosis. Here, we aim at modelling the affected structural brain connectivity using brain graphs and assess the clinical relevance of such models to improve the prediction of future disease progression in multiple sclerosis patients.
Dataset
A prospective longitudinal observational study enrolled patients within four months after their first clinical event suggestive of multiple sclerosis2. A subset of 107 patients with complete data and treated with interferon-beta over the whole study duration (40 males, age=30.2±7.7 years) was retained for analysis. MRI scans were acquired at 1.5T (Philips Gyroscan NT 15, Best, The Netherlands) and included fluid attenuated inversion recovery (FLAIR) with 1.5 mm thickness (TR/TE/TI 11000/140/2600 ms) and 3D spoiled-gradient recalled (SPGR) images with 1 mm slice thickness (TR/TE 25/5 ms). Hyperintense lesions were manually segmented in FLAIR.Methods
Graph Model of DisconnectomeA tractography atlas generated from 842 healthy subjects3 was used together with the Brainnetome parcellation atlas4 to study structural connectivity. To extract the affected streamlines for each patient, the lesion mask was spatially registered and superimposed to the atlas tractogram in MNI space. Then, only streamlines passing through lesions were retained (see Figure 1A). The disconnectome was modelled as a brain graph $$$G_{dis}$$$ whose vertices $$$V$$$ represented brain regions and whose edges $$$E_{dis}(i,j)$$$ represented the number of streamlines connecting two areas $$$i$$$ and $$$j$$$ (see Figure 1B). Similarly, the atlas tractogram was modelled as a brain graph $$$G_{atlas}$$$ with vertices $$$V$$$ and edges $$$E_{atlas}(i,j)$$$ representing the number of streamlines connecting two regions in an average healthy subject.
Each vertex of $$$G_{dis}$$$ was weighted by the relative percentage of affected streamlines computed as:
$$RAS(i) = \frac{\sum_{j \in V_i}E_{dis}(i,j)}{\sum_{j \in V_i}E_{atlas}(i,j)}$$
with $$$V_i$$$ the set of neighbours of vertex $$$i$$$.
Finally, a graph of preserved connectivity $$$G_c$$$ was created by combining $$$G_{dis}$$$ and $$$G_{atlas}$$$ such as:
$$E_c(i,j)=\begin{cases}\epsilon,&\text{if }E_{atlas}(i,j)=0\\ \frac{E_{atlas}(i,j)-E_{dis}(i,j)}{E_{atlas}(i,j)}+\epsilon,&\text{otherwise} \end{cases}$$
with $$$\epsilon=10^{-5}$$$ to ensure a connected graph.
For representation purposes, the parcellation areas were grouped into the main brain lobes, and the overall inter- and intra-lobes affected connections were computed. An intuitive visual representation of an individual’s disconnectome graph was created and is shown in Figure 1C.
Disease Progression Modelling
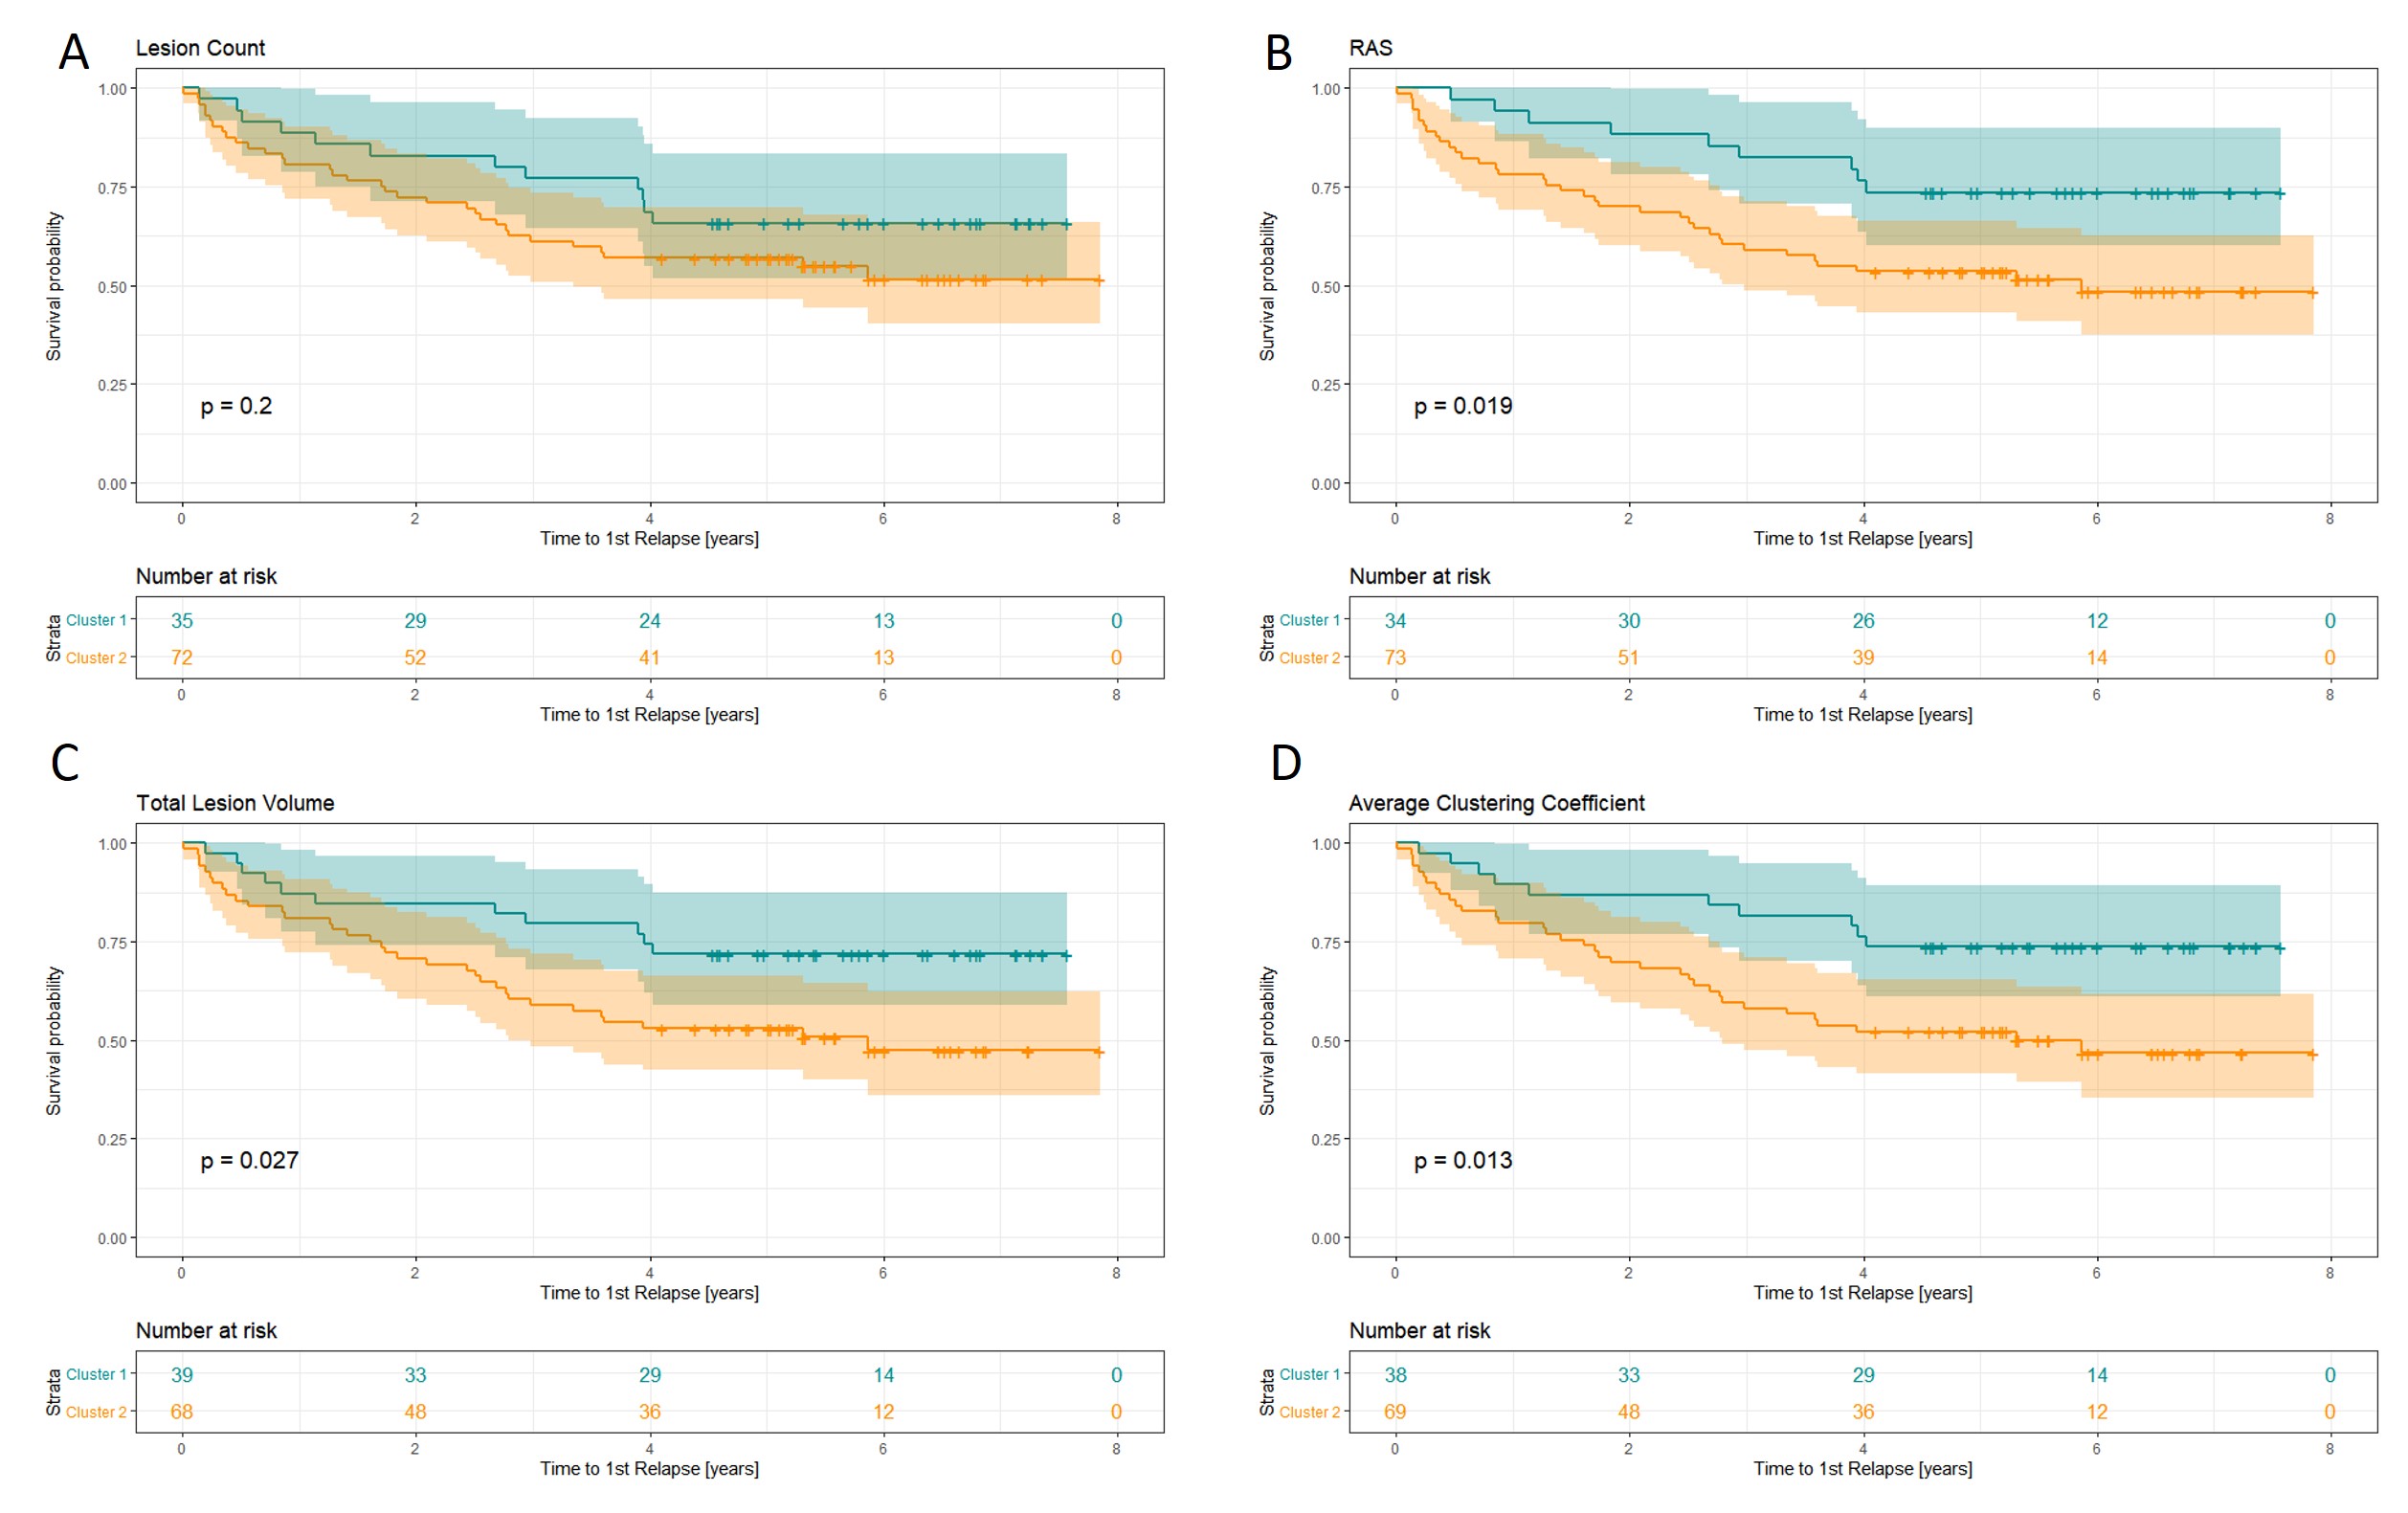
We studied the contribution of graph-based features to the definition of disease phenotypes with diverse prognosis. We built and compared models based on 1) the RAS metric and 2) the average clustering coefficient of the whole graph to baseline models including 3) lesion volume and 4) lesion count. For each model, patients were first separated into two clusters using a k-means algorithm on each of the four lesion representations. Then, we fitted survival models for each cluster predicting the advent of a relapse and compared the Kaplan-Meier curves using a log-rank test.
Results
The relative percentage of affected streamlines per vertex was plotted for every patient in Figure 2 together with the lesion load and the time duration between the baseline visit and the first relapse. The heterogeneity of the data does not allow to identify a consistent pattern of disconnected brain areas nor lesion load metrics when related to the time to first relapse. However, left parietal, insular and subcortical regions seem to be generally more disconnected than other brain areas across subjects.Figure 3 shows the outcome of k-means clustering and survival analysis for the different models. By looking at the risk tables, one can assess that cluster sizes are comparable between models. Clustering based on lesion count doesn’t result in two phenotypes with different disease courses ($$$\chi^2 = 1.7, p=0.2$$$), whereas other models allow a significant discrimination between the Kaplan-Meier curves (lesion volume: $$$\chi^2 = 4.9 , p = 0.027$$$ ; RAS: $$$\chi^2 = 5.5, p = 0.019$$$; average clustering coefficient: $$$\chi^2 = 6.2 , p = 0.013$$$).
Discussion/Conclusion
We proposed an approach to quantitatively characterize the affected structural connectivity in multiple sclerosis patients without requiring diffusion imaging. Graph features were shown to allow the definition of two distinct disease phenotypes characterized by different disease courses, outperforming the baseline model based on simple lesion count and performing at least as well as lesion volume, while offering additional insights into spatial lesion distribution.Because our method relies on spatial registration of patients’ brain to standard healthy templates, it is important to restrict such analysis to young patients at early stages of the disease to avoid registration limitations that would be induced by brain atrophy and aging.
In addition to providing potentially useful information to neurologists for the prediction of individual prognosis, we expect that our disconnectome representation could contribute to a better understanding of (dis-)connection mechanisms underlying various neurological disorders. Notably, our analysis could be applied retrospectively on previously acquired clinical datasets as standard clinical MR sequences are sufficient.
Acknowledgements
No acknowledgement found.References
[1] Ravano, Veronica, et al. “Atlas-based tract damage mapping improves 4-year forecast of EDSS in multiple sclerosis”, ECTRIMS (2019): Abstract P427
[2] Horakova, Dana, et al. "Environmental factors associated with disease progression after the first demyelinating event: results from the multi-center SET study." PloS one 8.1 (2013): e53996.
[3] Yeh, Fang-Cheng, et al. "Population-averaged atlas of the macroscale human structural connectome and its network topology." NeuroImage 178 (2018): 57-68.
[4] Fan, Lingzhong, et al. "The human brainnetome atlas: a new brain atlas based on connectional architecture." Cerebral cortex 26.8 (2016): 3508-3526.
Figures