1863
Deep-Learning based Segmentation and Localization of White Matter Hyperintensities on Magnetic Resonance Images1YiWei Medical Technology Co.,Ltd, Shenzhen, China, 2School of Computer Science and Technology, Harbin Institute of Technology, Harbin, China, 3Department of Diagnostic Radiology, The University of Hong Kong, Hong Kong, Hong Kong
Synopsis
In this work, deep-learning-based methods were utilized to segment white matter hyperintensities (WMH) on T2-weighted MRI from 213 patients diagnosed with ischemia and lacune. Vulnerability maps of each disease were generated regarding the prevalence of WMH registered to the standard MNI template. The WMH were allocated into 68 regions of interest using a Hammers atlas. Correlation among the region-specific WMH was analyzed for a lesion-symptom study.
Introduction
White matter hyperintensities (WMH) are abnormal brain regions which exhibit relatively higher intensity level on T2-weighted Fluid-attenuated inversion recovery (FLAIR) magnetic resonance images (MRI) and are tightly associated with small vessel diseases [1]. The US National Institute of Neurological Disorders and Stroke and the Canadian Stroke Network have proposed neuroimaging consensus standards for SVD classification [2]. However, manual delineation of WMH is time-consuming and observer-dependent. In this work, we endeavored to utilize deep-learning-based models in WMH lesion segmentation and studied the WMH distribution on two neurological diseases.Methods
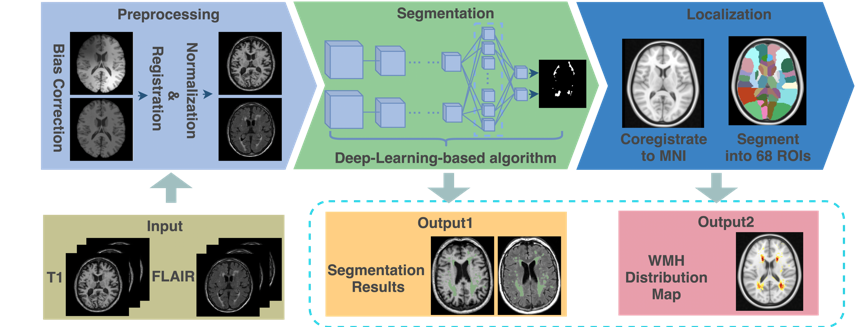
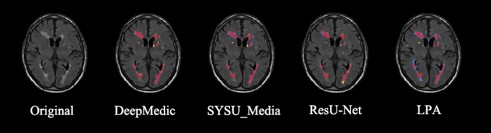
Two public datasets with manually labeled WMH delineations, namely the MICCAI WMH segmentation challenge dataset (a total of 60 patients) [3] and the public multiple sclerosis dataset (a total of 30 patients) [4], were utilized for training and validating the WMH segmentation deep learning model. In the test phase, we collected T2-weighted FLAIR and T1-weighted scans from 213 subjects, who were diagnosed with ischemia (96) and lacune (117). Three steps could be summarized in the proposed framework. Firstly, all images uniformly went through preprocessing operations, followed by a segmentation stage where the WMH were delineated. Afterward, WMH localization was carried out by registration and mapping to an existing atlas. The pipeline of this work is depicted in figure 1.The data preprocessing stage involves N4 bias correction, coregistration, normalization, and augmentation. In the segmentation stage, we applied four methods, namely DeepMedic [5], SYSU_Media [6], deep residual U-Net [7], and LPA [8] to delineate WMH on both T1 and T2-FLAIR images. The former three deep-learning-based models were trained on a subset containing 80% of the first two public datasets in a multi-channel manner. It is noteworthy that modifications have been made on the original DeepMedic 3D multi-channel convolutional neural network model, including an extra convolutional pathway with a subsampling factor of 5, and a soft-dice loss function to guide the training. Meanwhile, the SYSU_Media was built upon a 4-layer U-Net [9] backbone structure, and the deep residual U-Net replaced the convolutional layers in U-Net with residual blocks. In addition, the LPA, which is embedded in the widely known lesion segmentation toolbox (LST) [10], is a well-tuned logistic regression model and serves as a baseline in this study. Sequentially, we utilized the best performing model (in this case, the modified DeepMedic) in automatic WMH segmentation on the clinical 213 patients' MRI scans. The segmented lesions, along with the original images, were registered to the standard MNI template and were divided into 68 regions of interests by the Hammers atlas [11]. The prevalence of WMH in each ROI, along with vulnerability maps, were calculated and generated for ischemia and lacune population individually. We further analyzed the distribution of WMH load in each ROI by calculating the structural correlation coefficient matrices.Results
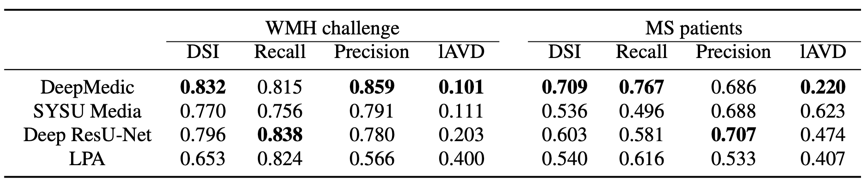
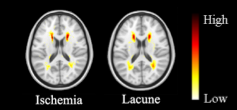
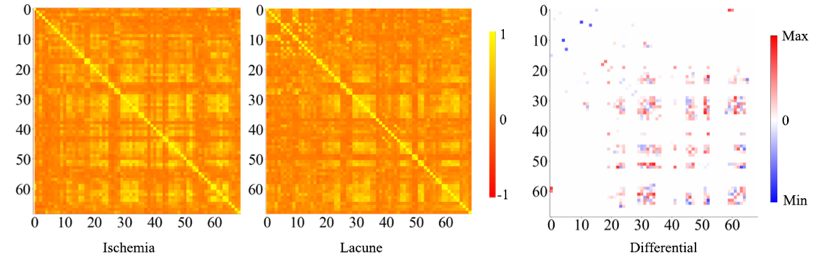
In the segmentation phase, all four segmentation methods were equally validated on a randomly selected test set, which was composed of 20% of the above-mentioned public data (as shown in figure 2). Comparisons were made by the dice coefficient index (DSI), recall, precision, and log-transformed volume difference (lAVD) on the segmentation results, as demonstrated in figure 3. The conclusion could be made that the modified DeepMedic model generally outperformed the baseline LPA and other two deep-learning-based models. The prevalence maps were illustrated in figure 4. The brain-wide correlation matrices on the ischemia patients and lacune patients, alone with the differential map subtracting the two matrices, were demonstrated in figure 5. Note that, in order to maintain the significance, Bonferroni correction was applied to the correlation coefficient. To be specific, only the correlations with 𝑝_𝑣𝑎𝑙𝑢𝑒 > 0.05/69 (68 brain regions and background) were adopted.Discussion
A notable finding regarding figure 4 is that the most prominent zones fall in the middle frontal gyrus and the superior parietal gyrus area. Two observations could be made regarding figure 5. Firstly, the high correlation coefficient between frontal gyrus areas and the superior parietal gyrus areas could be witnessed on both ischemia and lacune matrices, indicating the significant correlation between the occurrence of WMH in these two areas. Secondly, the correlation between the amygdala and the superior temporal sulcus and gyrus, which could be observed through the bright blue top left corner in the differential map, is higher in lacune patients than in ischemia patients. A feasible explanation is that social communication and cognitive disorders, which are highly associated with the above-mentioned areas, are more significant among lacune patients. Besides, the wide occurrences of red and blue blobs indicate the difference in structural correlation between lacune patients and ischemia patients.Conclusion
In this work, we have proposed a workflow integrating WMH segmentation, localization, and analysis. The experimental results suggest that our deep-learning-based model has the potential to be integrated into the clinical workflow. It is also heuristic to future studies in disease classification that by encoding the spatial distribution of WMH, the classification model has the potential to make a reasonable diagnosis based on the prior knowledge and training samples.Acknowledgements
References
1. Wardlaw, Joanna M., et al. "Neuroimaging standards for research into small vessel disease and its contribution to ageing and neurodegeneration." The Lancet Neurology 12.8 (2013): 822-838.
2. Hachinski, Vladimir, et al. "National Institute of Neurological Disorders and Stroke–Canadian stroke network vascular cognitive impairment harmonization standards." Stroke 37.9 (2006): 2220-2241.
3. MLAKuijf, Hugo J., et al. "Standardized assessment of automatic segmentation of white matter hyperintensities; results of the wmh segmentation challenge." IEEE transactions on medical imaging (2019).
4. Lesjak, Žiga, et al. "A novel public MR image dataset of multiple sclerosis patients with lesion segmentations based on multi-rater consensus." Neuroinformatics 16.1 (2018): 51-63.
5. MLAKamnitsas, Konstantinos, et al. "Efficient multi-scale 3D CNN with fully connected CRF for accurate brain lesion segmentation." Medical image analysis 36 (2017): 61-78.
6. Li, Hongwei, et al. "Fully convolutional network ensembles for white matter hyperintensities segmentation in mr images." NeuroImage 183 (2018): 650-665.
7. Zhao, Lei, et al. "Strategic infarct location for post-stroke cognitive impairment: A multivariate lesion-symptom mapping study." Journal of Cerebral Blood Flow & Metabolism 38.8 (2018): 1299-1311.
8. Schmidt, Paul. Bayesian inference for structured additive regression models for large-scale problems with applications to medical imaging. Diss. lmu, 2017.
9. Ronneberger, Olaf, Philipp Fischer, and Thomas Brox. "U-net: Convolutional networks for biomedical image segmentation." International Conference on Medical image computing and computer-assisted intervention. Springer, Cham, 2015.
10. Schmidt, Paul, et al. "An automated tool for detection of FLAIR-hyperintense white-matter lesions in multiple sclerosis." Neuroimage 59.4 (2012): 3774-3783.
11. Hammers, Alexander, et al. "Three‐dimensional maximum probability atlas of the human brain, with particular reference to the temporal lobe." Human brain mapping 19.4 (2003): 224-247.
Figures