1861
N-Acetyl Aspartate and Myo-Inositol as biomarkers of HIV infection in the brain1Radiology, University of Miami, Miami, FL, United States, 2Postgraduate Institute for Medical Education & Research, Chandigarh, India, 3University of Miami, Miami, FL, United States, 4Psychiatry and Behavioral Sciences, University of Miami, Miami, FL, United States
Synopsis
The purpose of this study is to determine whether magnetic resonance spectroscopic imaging (MRSI) can identify metabolite biomarkers of HIV infection in the brain. Concentrations of N-acetyl aspartate (NAA), choline (CHO), creatine (CR), myo-inositol (MI), and glutamate and glutamine (GLX) were measured at the whole-brain level and compared between HIV+ and healthy control subjects. Significant reductions in NAA and increases in MI are observed throughout the brain, while the concentrations of other metabolites show no significant change.
Introduction
HIV infection is known to impact the central nervous system and contributes to tissue structural and metabolic alterations, which are thought to underlie neurocognitive impairments observed in HIV+ individuals. While several studies have focused on diffusion tensor imaging measures as biomarkers of structural changes, few have looked at metabolite alterations at a single or multiple regions within the brain but none at the whole-brain level using a whole-brain magnetic resonance spectroscopic imaging (MRSI) method.Methods
We collected MRSI data using a 3T Siemens scanner at the Post Graduate Institute of Medical Education & Research (PGIMER) in India from 150 volunteers with 81 HIV-treatment-naïve Clade-C HIV+ subjects (55/26 male/female; age: 32.23 ± 6), and 62 HIV- individuals as a control group (41/21 male/female; age: 29.6 ± 7). The MRSI data was processed using the Metabolite Imaging and Data Analysis System (MIDAS) platform1,2. MIDAS’s Map-INTegrated (MINT) module integrates spectra from voxels within a region of interest (ROI) to create a single integrated spectrum and performs spectral fitting. This results in higher SNR and more accurate fitting compared to individual voxel spectral fitting. The program includes filters for rejecting poor-quality data on a voxel-by-voxel basis. The ROIs are selected from a modified JHU-MNI-SS-type2 atlas, this allows us to evaluate metabolite values in the entire brain. The spectral results are corrected for cerebrospinal fluid (CSF) partial volume and are normalized to the non-suppressed water reference data from the same ROI. Spectra from ROIs with less than 10 voxels are not used for analysis, and this resulted in 75 ROIs. Finally, we performed an F-test to determine statistically significant differences in metabolite levels between the HIV+ and the control groups, with a significance threshold set at p < 0.05 corrected for multiple comparisons using Bonferroni (α = 0.05/75 = 6.667 × 10⁻⁴).Results
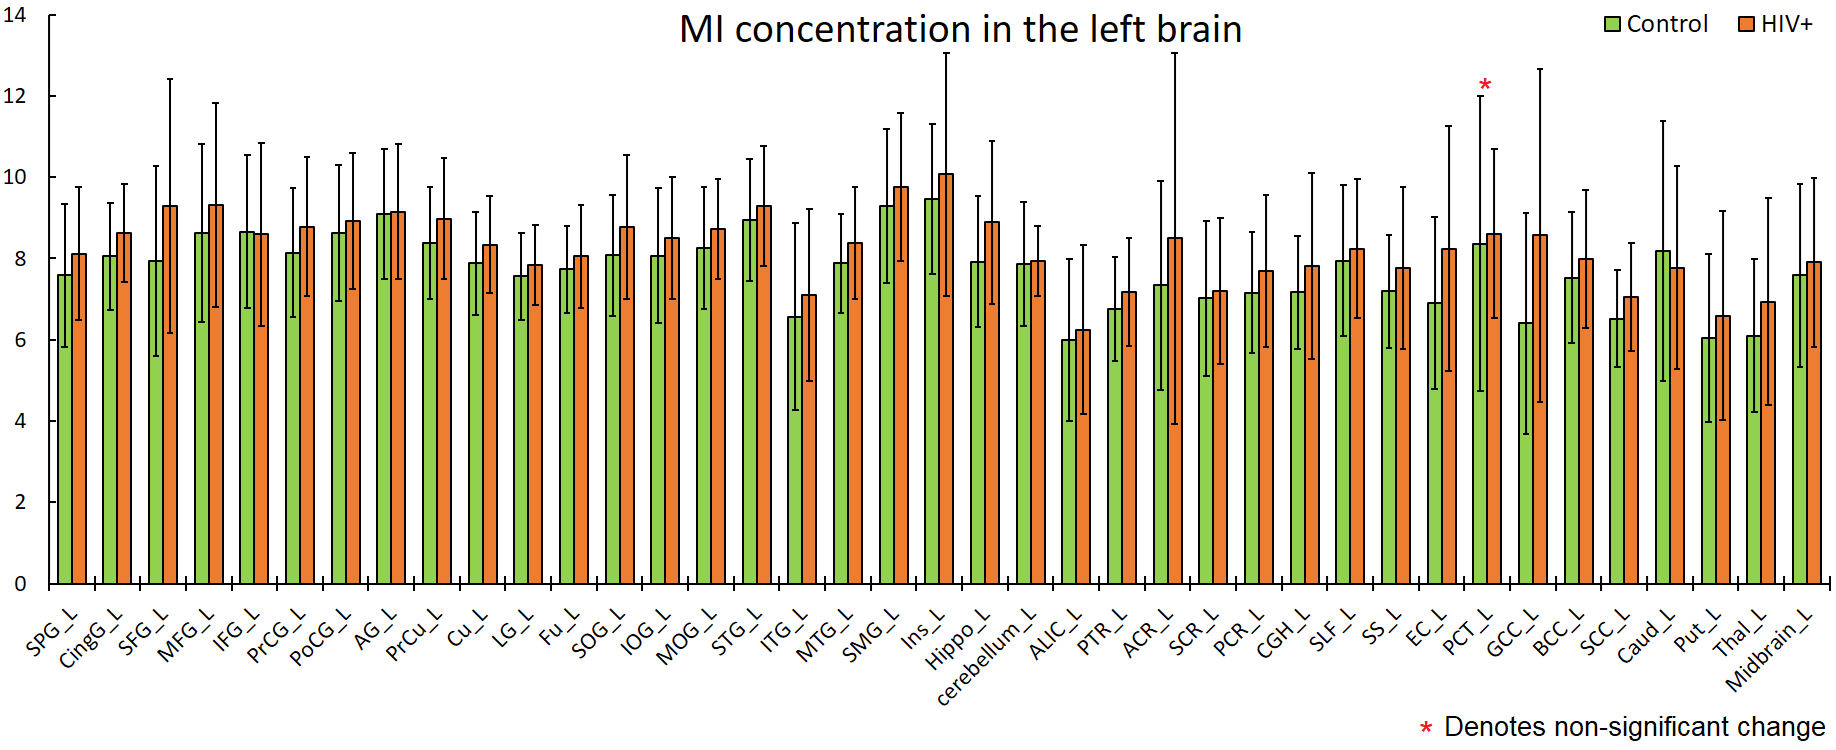
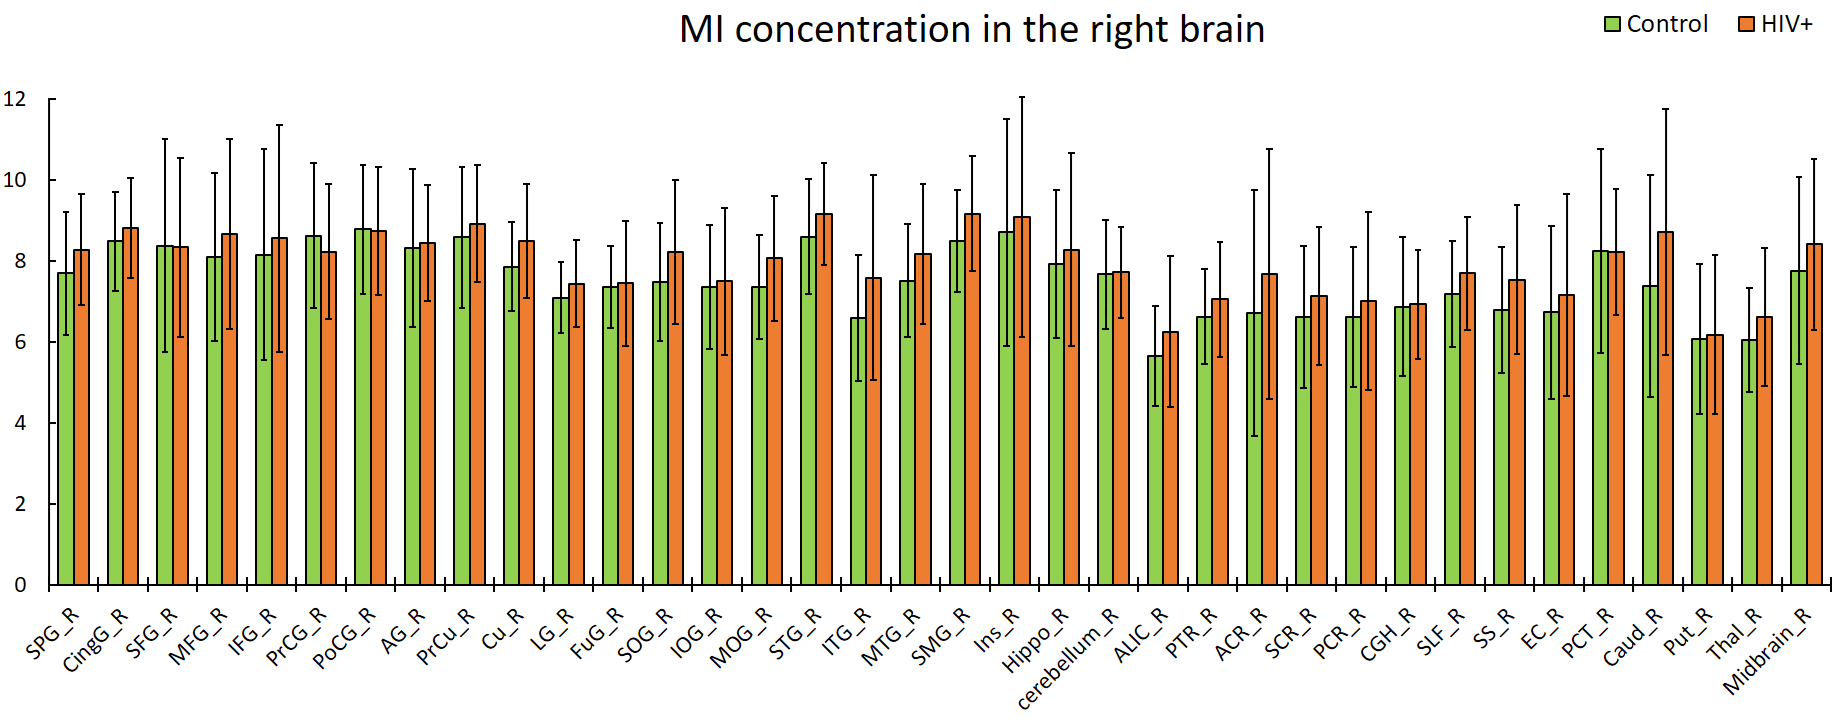
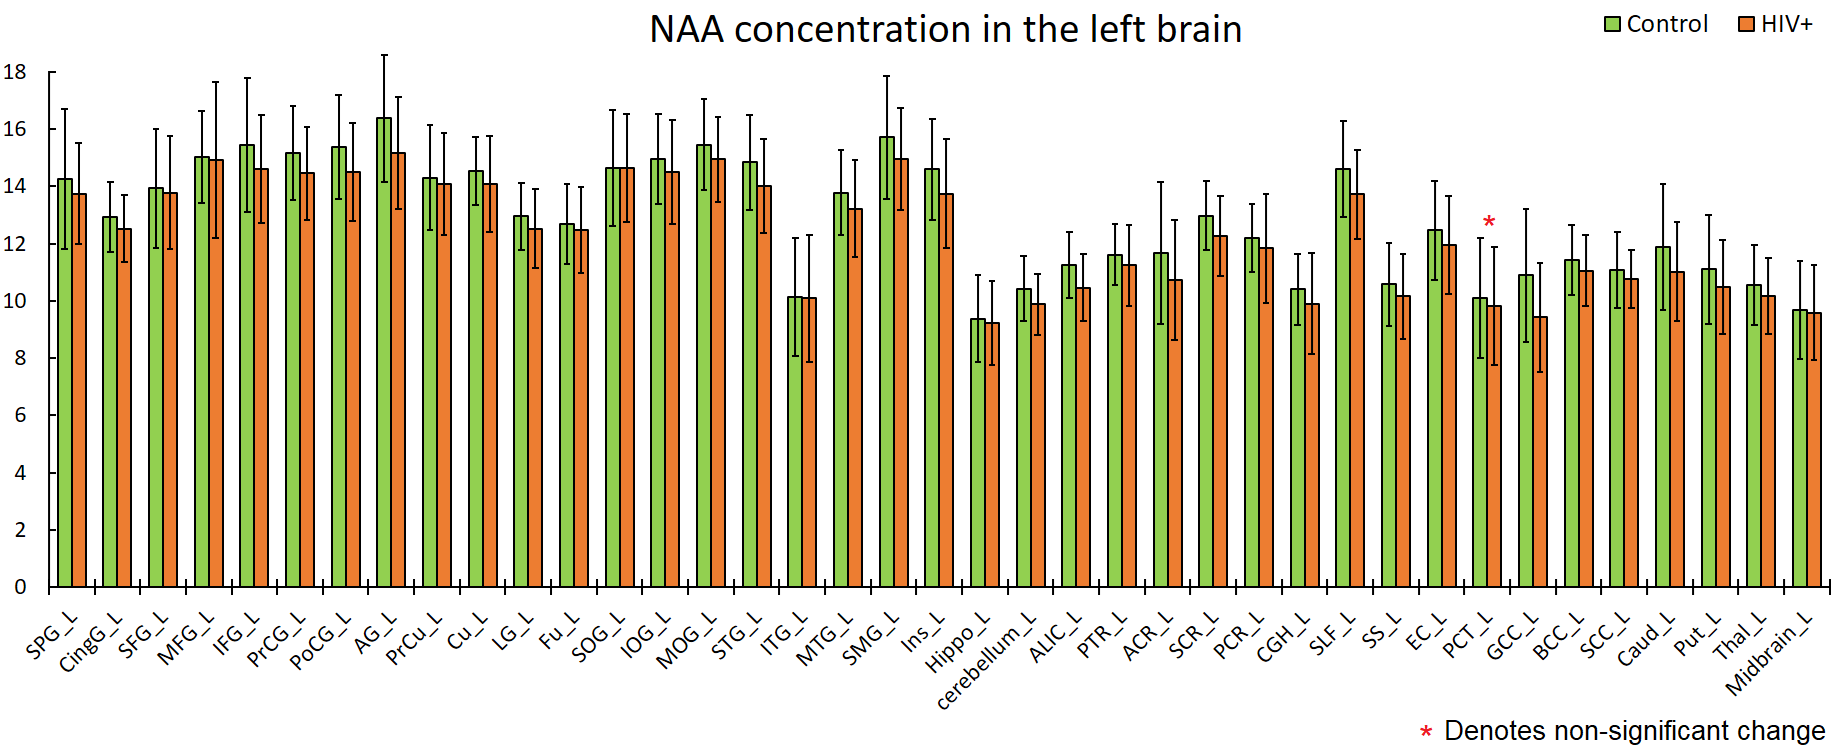
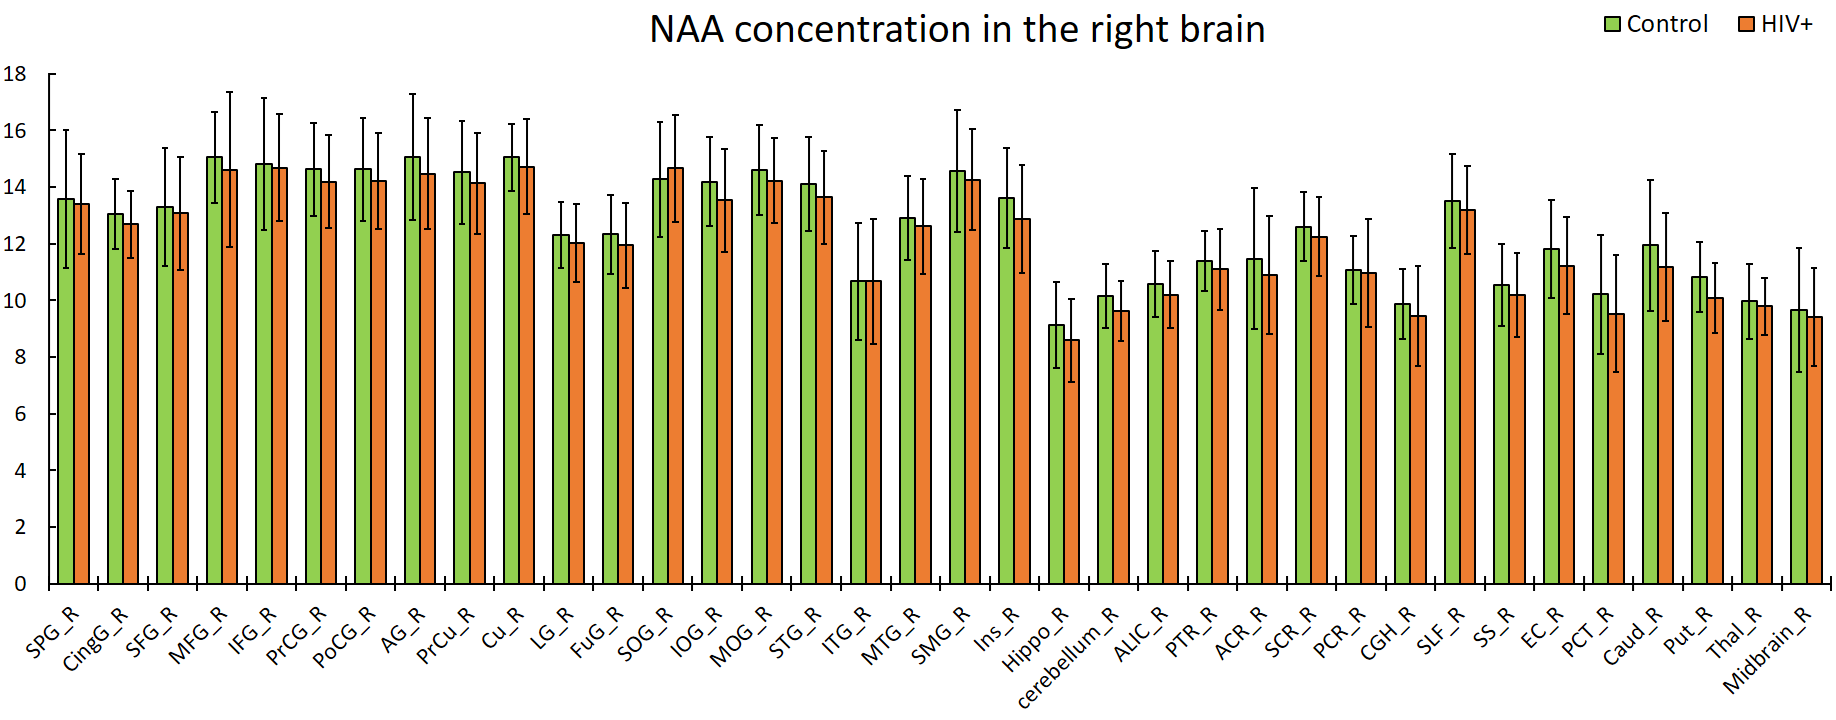
NAA and MI showed significant differences between HIV+ and control groups throughout the brain at all 75 measured ROIs, with one single exception at the left pontine crossing tract (PCT_L). We observed a consistent increasing trend in MI levels across 74 ROIs (Fig 1-2), and a uniformly decreasing trend in NAA levels (Fig 3-4) for the HIV+ subjects. In addition, the standard deviations for the HIV+ group show relatively a higher variability than for the control groups for most of the ROIs, which suggests that the HIV+ individuals may have a varied degree of HIV infection. No significant differences between the two groups are observed for the other metabolites.Conclusion
Reduced NAA across the entire brain suggests neuronal loss in individuals with HIV infection. Increased MI indicates increased gliosis in which microglia proliferate to combat HIV induced inflammation and related infections within the brain.Acknowledgements
Funding from NIH grant, R01 NS094043.References
1. Maudsley AA, et al. Comprehensive processing, display and analysis for in vivo MR spectroscopic imaging. NMR in biomedicine. 2006;19(4):492-503.
2. Maudsley AA, et al. Mapping of brain metabolite distributions by volumetric proton MR spectroscopic imaging (MRSI). Magnetic resonance in medicine : official journal of the Society of Magnetic Resonance in Medicine / Society of Magnetic Resonance in Medicine. 2009;61(3):548-559.
Figures