1859
Rosette spectroscopic imaging of epilepsy at 3T1Radiology, University of Pittsburgh, Pittsburgh, PA, United States, 2UPMC, Pittsburgh, PA, United States
Synopsis
Our group has implemented the rosette trajectory at 3T with 3dimensional phase and Hadamard encoding to achieve multi- and whole-slice spectroscopic images covering a total longitudinal 60mm. These acquisitions are applied in n=25 surgical epilepsy patients (15 medial temporal lobe; 10 neocortical epilepsy), evaluating metabolic dysfunction in terms of overlap with surgical target and outcome. In 19/25 patients the MRSI identified gyral regions of overlap between the abnormal MRSI and surgical therapy. Based on a 4% cut segregation of fractional volume of MRSI abnormalities, the outcome ILAE score was significantly lower (better) in patients with <=4% abnormality compared to >4%.
Introduction
The neuroimaging of epilepsy is difficult, given inter-patient variation in location, severity and nature of pathology. However, given the complex invasive procedures being applied, sensitive imaging remains of interest. Our group has implemented the rosette trajectory at 3T with 3dimensional phase and Hadamard encoding (1,2) to achieve multi- and whole-slice spectroscopic images covering a total longitudinal 60mm. These acquisitions are applied in n=25 surgical epilepsy patients (15 classified as medial temporal lobe; 10 neocortical epilepsy), evaluating metabolic dysfunction in terms of overlap with surgical target and outcome.Methods
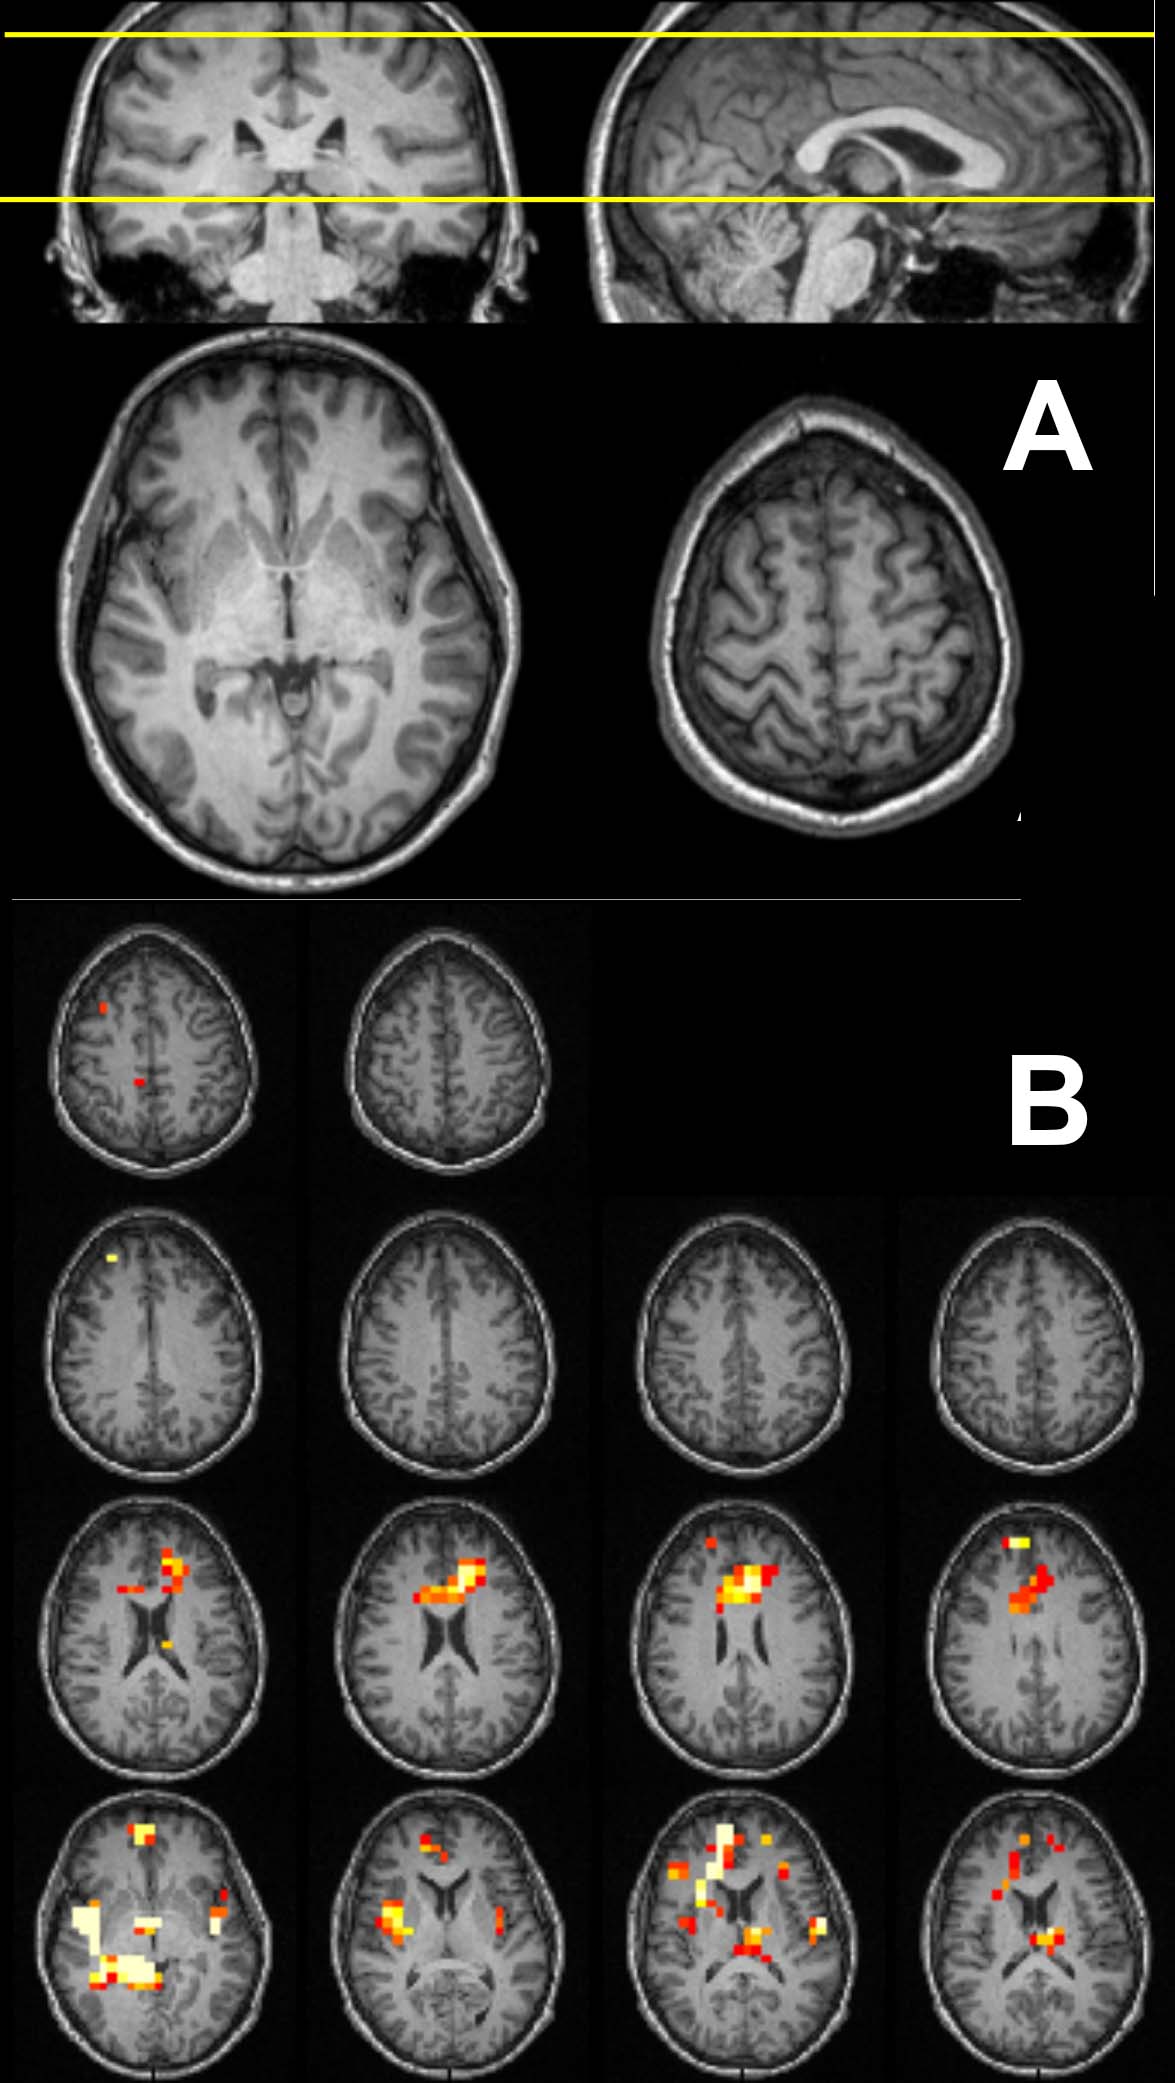
All imaging was performed at 3T with a Siemens Trio or MMR system. MRSI acquisitions longitudinally covered 60mm normal to the AC-PC line, comprised of a 40mm 3D slab and a contiguous two slice 8mm thick/2mm gap Hadamard encoded spectroscopic images (Fig. 1). Both acquisitions use an in-plane circular rosette trajectory for spectral and two dimensions of fast spatial encoding. The 3D is performed at 20x20x12 resolution (200x200x48mm) and Hadamard (200x200, two slices 8mm/2mm gap) at 28x28 resolution, TR/TE 2s/40ms. With Gmax=5.8mT/m and Smax=45mT/m/ms, this sequence did not require any eddy current correction and is very quiet. To allow evaluation of the neocortical edge, extracranial lipid suppression was performed with a global inversion recovery with TI 240ms. In total, the MRSI acquisitions required 18.5min. A Kaiser Bessel kernel W=4 was used for reconstruction; tissue segmentation and processing as previously described (1). Regression statistics (slope, intercept and standard error of regression, determined for frontal, parietal, and cingulate parcels) for the detection of abnormal pixels was determined from 10 healthy control subjects (1). Spectral criteria for analysis were: 1) a total brain content (calculated from WM+GM, omitting CSF) >50%; 2) Cramer Rao lower bounds of <20% for the major singlets; 3) linewidth of <=0.14ppm, and 4) a 2.0ppm macromolecule/Cr amplitude of <3.0. These criteria resulted in utilization of 80.3±24.3% of pixels meeting the 50% total brain content or 64.9±19.6% of the available brain volume. To identify abnormal loci, a p value of <0.01 and threshold of 3 contiguous abnormal pixels was used. The overlap of locale of surgical therapy with the MRSI data was assessed by gyral identification as not all patients were able to proceed to post-operative MRI for quantitative assessment.A 2x1 contingency table assessment was used to determine the p-value of overlap between the MRSI and surgical locus of therapy. Based on the dynamic range on the total fractional volume of MRSI Cr/NAA abnormalities (fVCrNA), the data were segregated into two groups with a cutoff of 4%. The clinical ILAE class outcome was determined from these groups, with significance at p<0.05.
Results
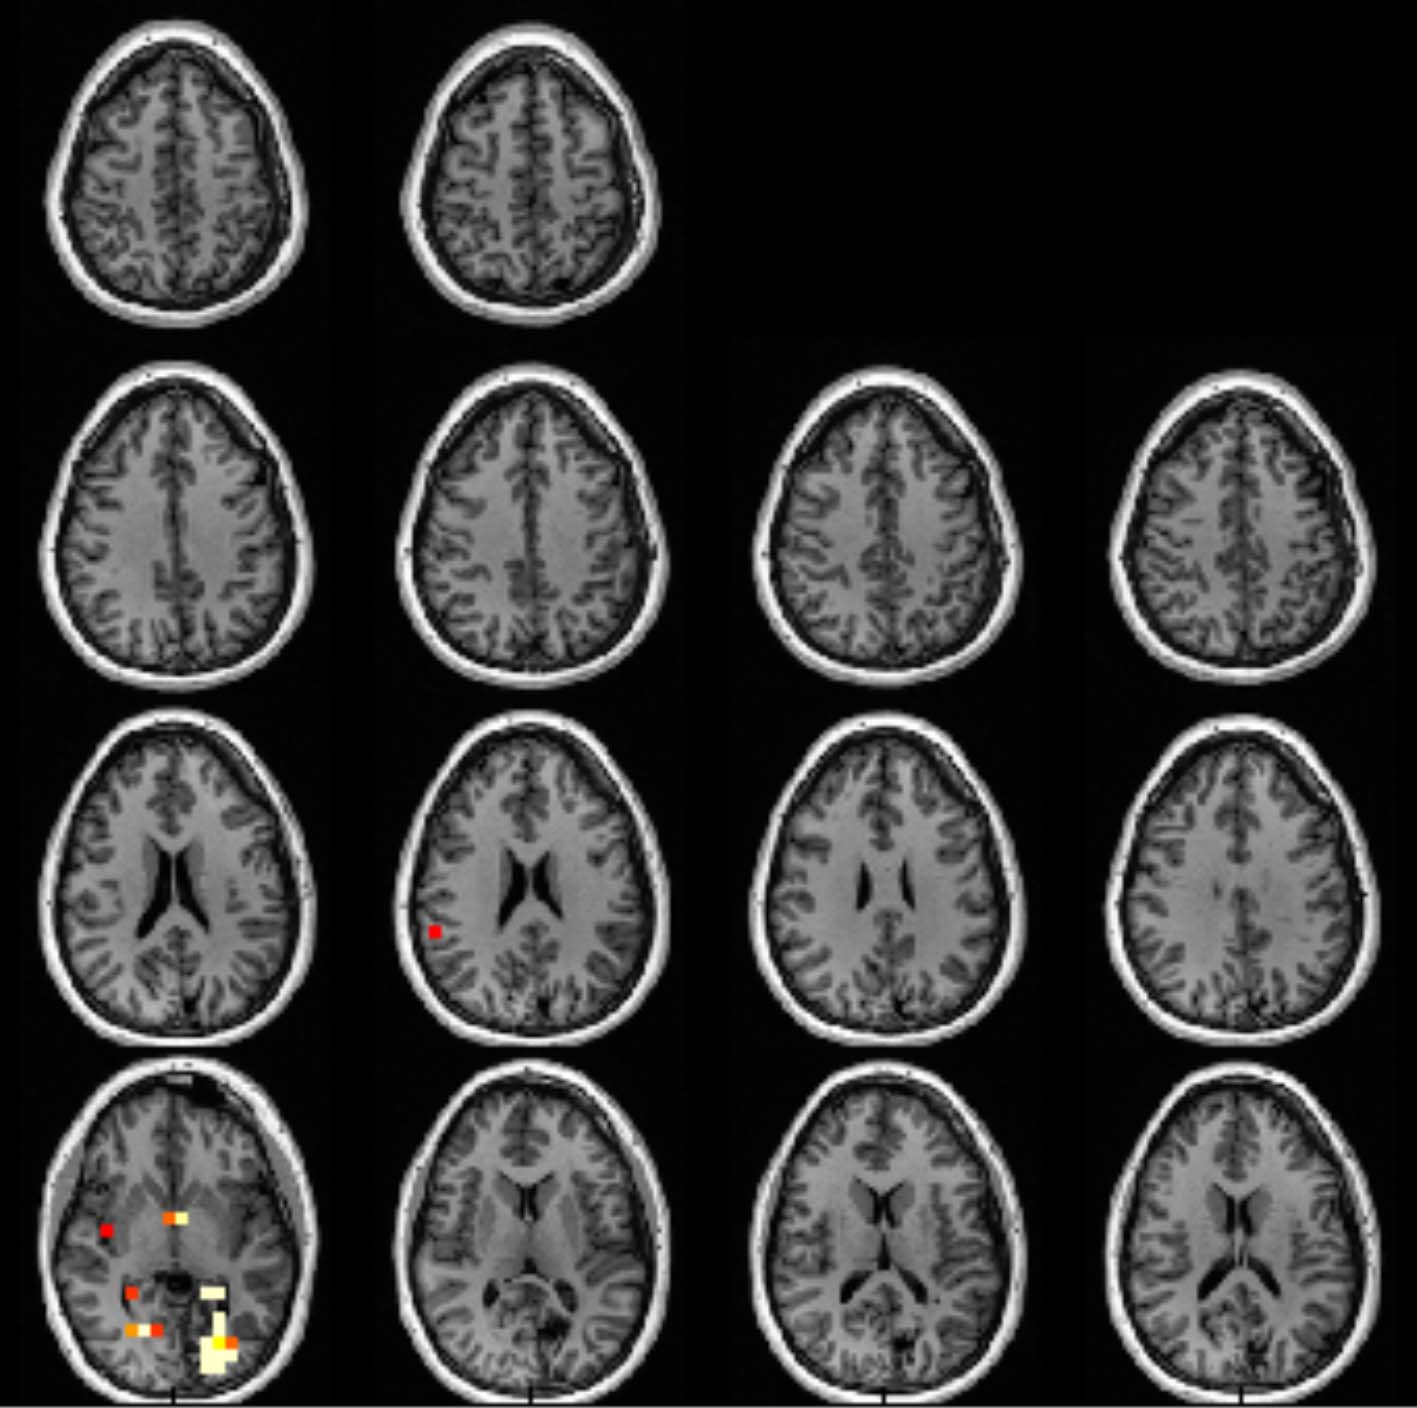
Fig. 1 (patient #1) was classified as medial temporal lobe epilepsy, and shows a distribution of abnormalities that includes the ipsilateral medial temporal lobe, insula and portions of the anterior cingulate cortex, medial prefrontal cortex (ACC/mPFC) consistent with a network of limbic dysfunction. This type of distribution or subsets therein of Cr/NAA abnormality was common, and identified in 12/15 temporal lobe patients.The neocortical epilepsy was similar to the medial temporal group in the observation of dysfunction of the limbic and medial prefrontal cortex (seen in 8/10 patients). In n=7 patients, discrete regions of dysfunction were identified in neocortex, many of which correlated with structural lesions. Fig. 2 shows patient with a left occipital Sturge Weber lesion; scalp EEG identified seizures as arising from the left hippocampus. This patient underwent left hippocampal ablation, became seizure free for 5months but then relapsed to a ILAE III outcome. The MRSI demonstrated the metabolic dysfunction in the left occipital and left hippocampus in addition to what may be developing right (homotopic) posterior dysfunction.
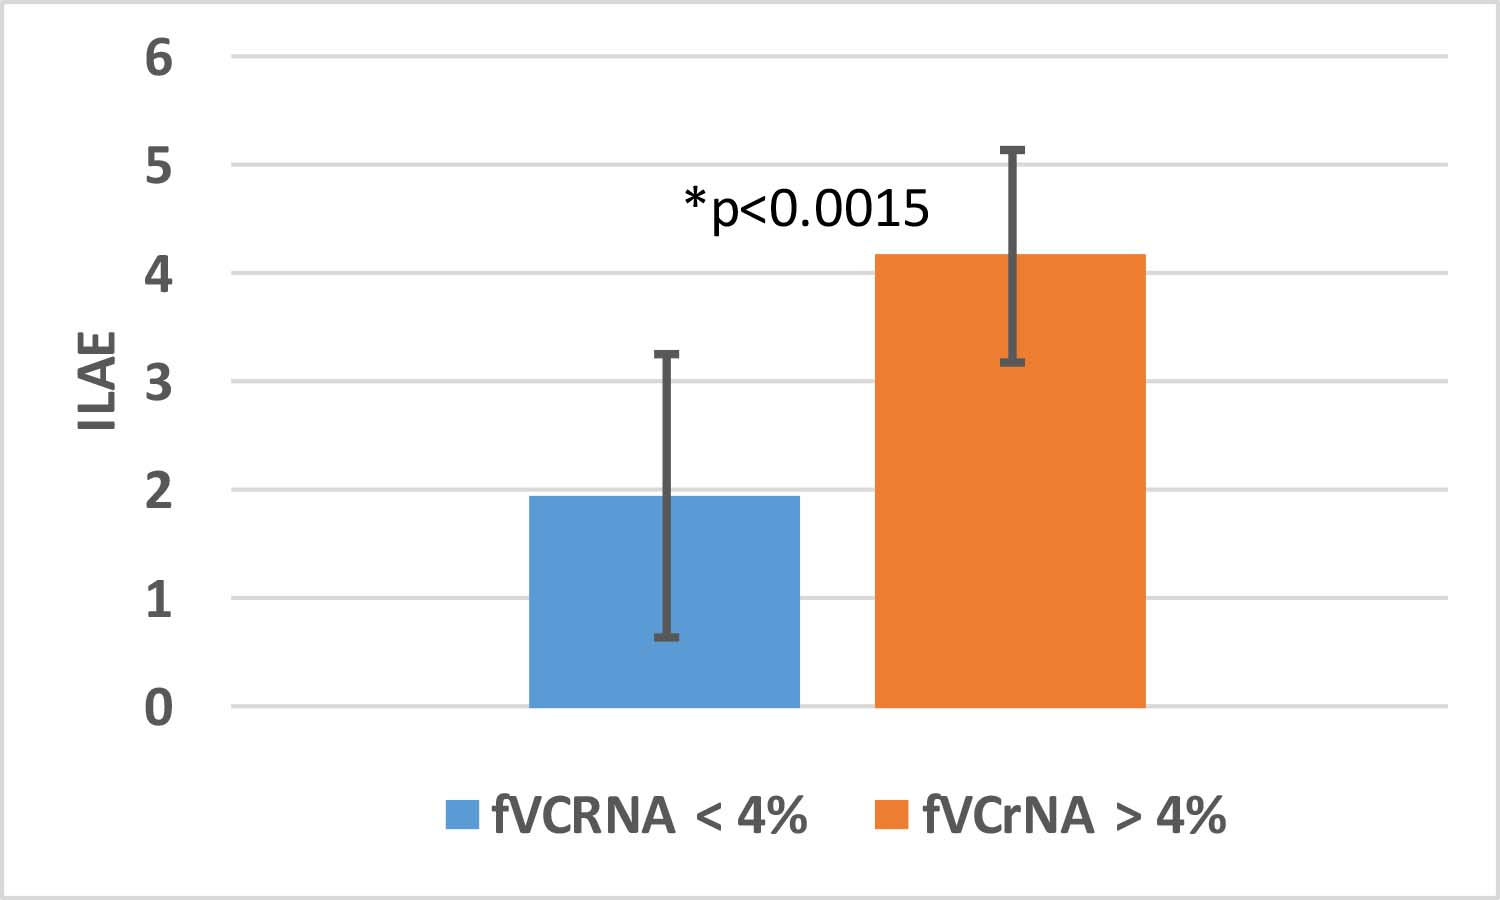
Overall, the MRSI-identified regions overlapped with the gyral region of surgery in 19/25 patients and was unhelpful or non-overlapped with gyral region of surgical therapy in 6. With a 2x1 contingency analysis, this gives a χ2 value of 6.76, significant at p<0.025. If the datasets are split, the 2x1 analysis with the smaller neocortical group becomes non-significant. Based on the notion that the fractional volume MRSI abnormality (fVCrNA) may influence outcome, the data were aggregated into two groups, with fVCrNA above and below 4%. The resulting ILAE scores between these groups (<=4%, >4%) was significantly different at p<0.0015 (Fig. 3) with an outcome of 1.9±1.3 and 4.2±1.0 respectively.
Discussion
The data show that MRSI can identify regions of concern that commonly involve the limbic network and other neocortical regions. However, at least 2/10 neocortical patients exhibited little abnormality or abnormalities of unclear significance. As the imaging did overlap with the regions of surgical therapy, we would need to conclude that the voxel size used is too large for the pathology and/or that the Cr/NAA parameter is insufficiently sensitive. Moving to higher field can address this as well as potentially measure other compounds such as GABA or glutamate. The other main problem is coverage into the anterior medial temporal lobes. We targeted the inferior slab separately from the superior slab to increase the inferior B0 homogeneity. However while we were able to evaluate the targeted posterior hippocampus, advanced shim hardware and strategies would be helpful for a consistent evaluation of the anterior hippocampus.Acknowledgements
This work supported by National Institutes of Health, NINDS R01NS090417, R01EB024408 and R01EB011639.References
1. Schirda, Magn Reson Med. 2018 May;79(5):2470.
2. Tal A, submitted Magn Res Med October 2019
Figures