1858
Microstructural Attributes of Hemispheric Lateralization: A Combined Evaluation of Diffusion Spectrum Imaging and MR Spectroscopic Imaging1Department of Biomarker Imaging Science, Hokkaido University Graduate School of Biomedical Science and Engineering, Sapporo, Japan, 2Hokkaido University Hospital, Sapporo, Japan, 3Siemens Healthineers, Tokyo, Japan, 4Siemens Healthineers, San Francisco, CA, United States, 5Department of Diagnostic and Interventional Radiology, Hokkaido University Hospital, Sapporo, Japan, 6Global Station for Quantum Medical Science and Engineering, Hokkaido University, Sapporo, Japan
Synopsis
We evaluated the extent of laterality of the diffusion spectrum imaging (DSI) indices, and tested the association of their laterality to laterality of neurometabolite concentrations derived from whole-brain MR spectroscopic imaging (MRSI). Leftward asymmetry was observed mainly in the motor structures and rightward asymmetry in the structures associated with attention and emotion. A similar pattern of GFA, NQA and FA laterality in NAA/Cr and Cho/Cr and a reversed pattern in ADC were observed. The combination of DSI and MRSI can be helpful for a better understanding of ongoing neural processes. Hemispheric lateralization needs to be paid attention when interpreting pathologies.
Introduction
The human brain exhibits hemispheric asymmetry or laterality, believed to be associated with differences in neural architecture between the dominant and the other hemispheres1. However, the exact underlying neural processes responsible for hemispheric laterality have not been thoroughly explored.Diffusion spectrum imaging (DSI) is an advanced diffusion imaging sequence known as highly sensitive to changes in tissue microstructure, through model-free quantification of motion of water molecules. The anisotropic indices derivable from DSI include generalized fractional anisotropy (GFA), normalized quantitative anisotropy (NQA), and fractional anisotropy (FA). Laterality in the DSI anisotropic indices is reported in a few white matter tracts2, but its extent and the neural basis are not known.
The knowledge about laterality is important in interpreting pathological states. It is possible that DSI in combination with other quantitative MRI techniques can unveil the neural underpinnings associated with hemispheric laterality.
The purposes of this study were to identify the extent of laterality of the DSI indices and test the association of laterality of these indices with laterality in the essential neurometabolite concentrations estimated with whole-brain MR spectroscopic imaging (MRSI).
Methods
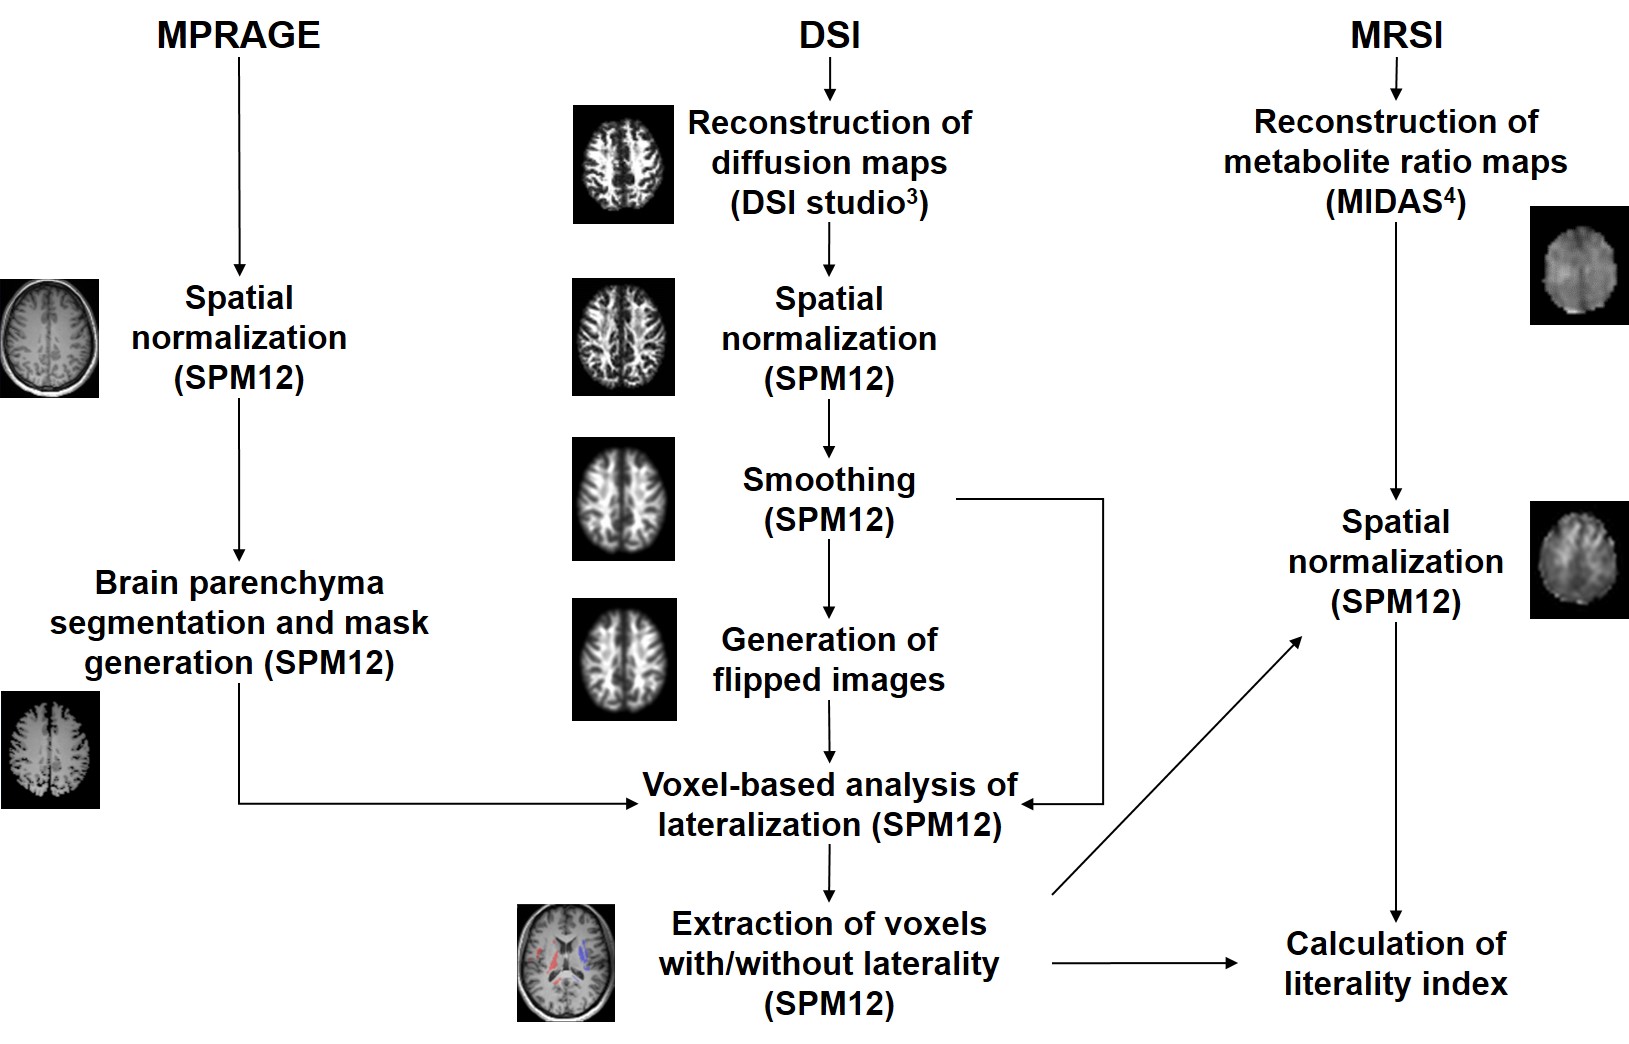
Twenty-six right-handed healthy volunteers (12 women and 14 men), aged 22 to 60 years (mean age = 34.56 ± 10.74 years), were included in this prospective study. MRI of the brain was performed using a 3T scanner (MAGNETOM Prisma, Siemens Healthineers, Erlangen, Germany) and a 64-channel head/neck coil. DSI was acquired using a spin-echo echo-planar sequence (TR/TE = 4000/100 ms, slice thickness = 2.5 mm, 128 isotropically distributed diffusion-weighted directions, bmax = 8000 s/mm2) and the whole-brain MRSI was performed using a volumetric spin-echo echo-planar imaging technique (Siemens prototype sequence, TR/TE/TI = 1710/17/198 ms, flip angle = 73°, sampling of 50 × 50 × 18 k-space points over 280 × 280 ×180 mm3). The GFA, NQA, FA and apparent diffusion coefficient (ADC) maps were generated from the DSI data3 and N-acetyl-aspartate (NAA)/creatine (Cr), choline (Cho)/Cr, glutamate and glutamine (Glx)/Cr and myo-inositol (mI)/Cr maps were generated from the MRSI data4. Voxels with significant laterality were identified from the spatially-normalized GFA, NQA and FA maps by using paired t-tests. Laterality in ADC, NAA/Cr, Cho/Cr, Glx/Cr and mI/Cr in these voxels was tested by using repeated-measures ANOVA and post-hoc Bonferroni analyses. Further details about image data processing are given in Figure 1. The influence of scan conditions on laterality was ruled out through repeated scans with switched encoding directions.Results
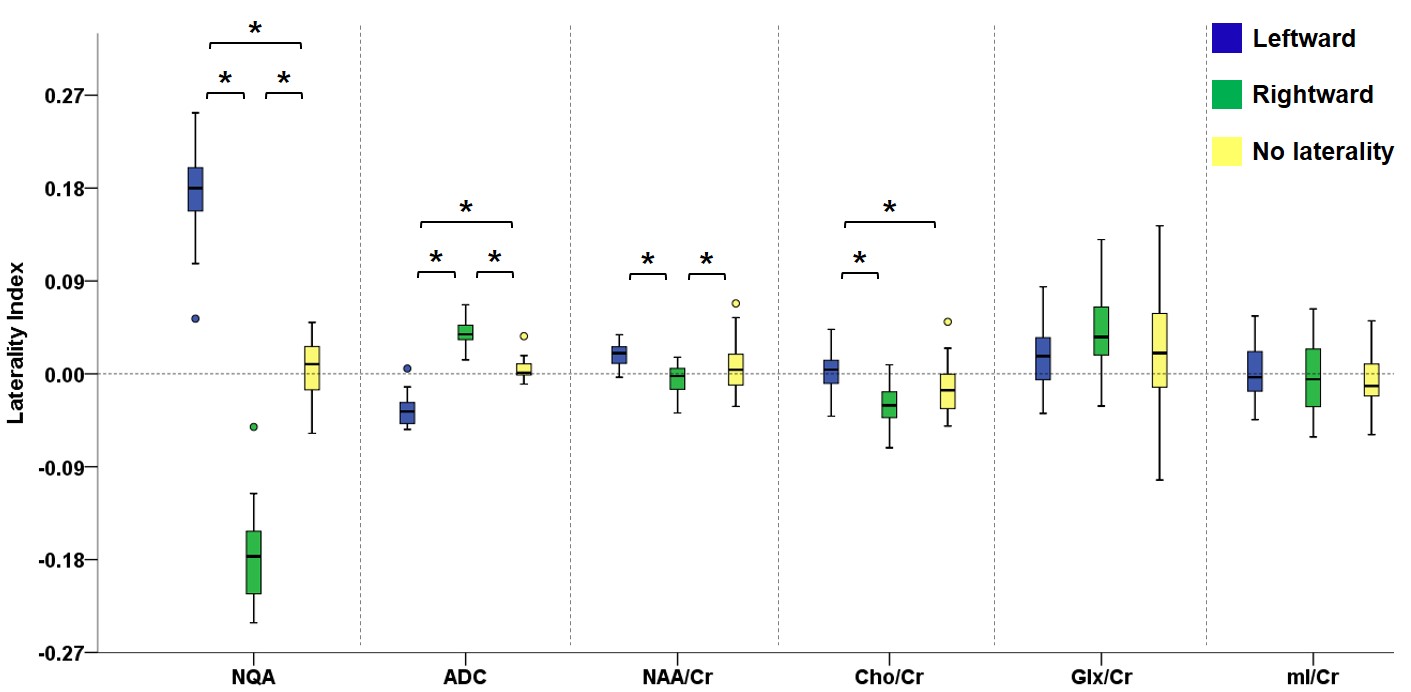
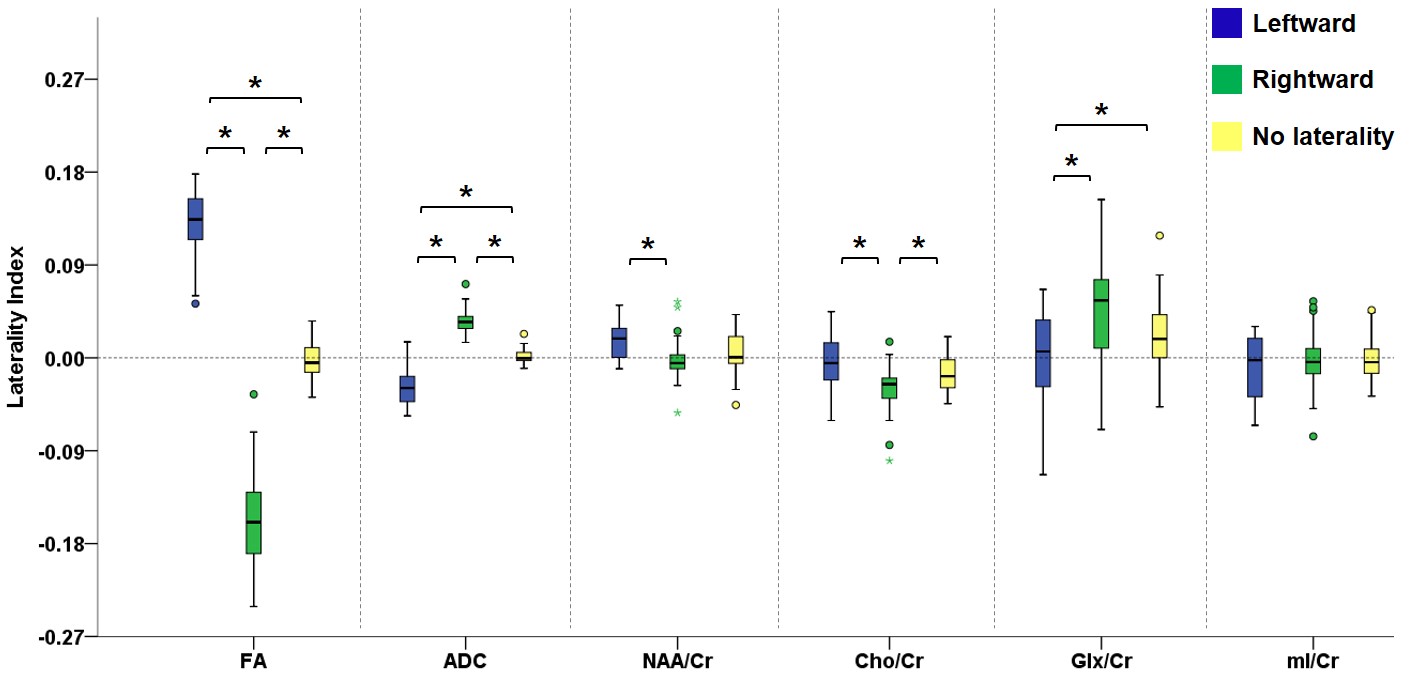
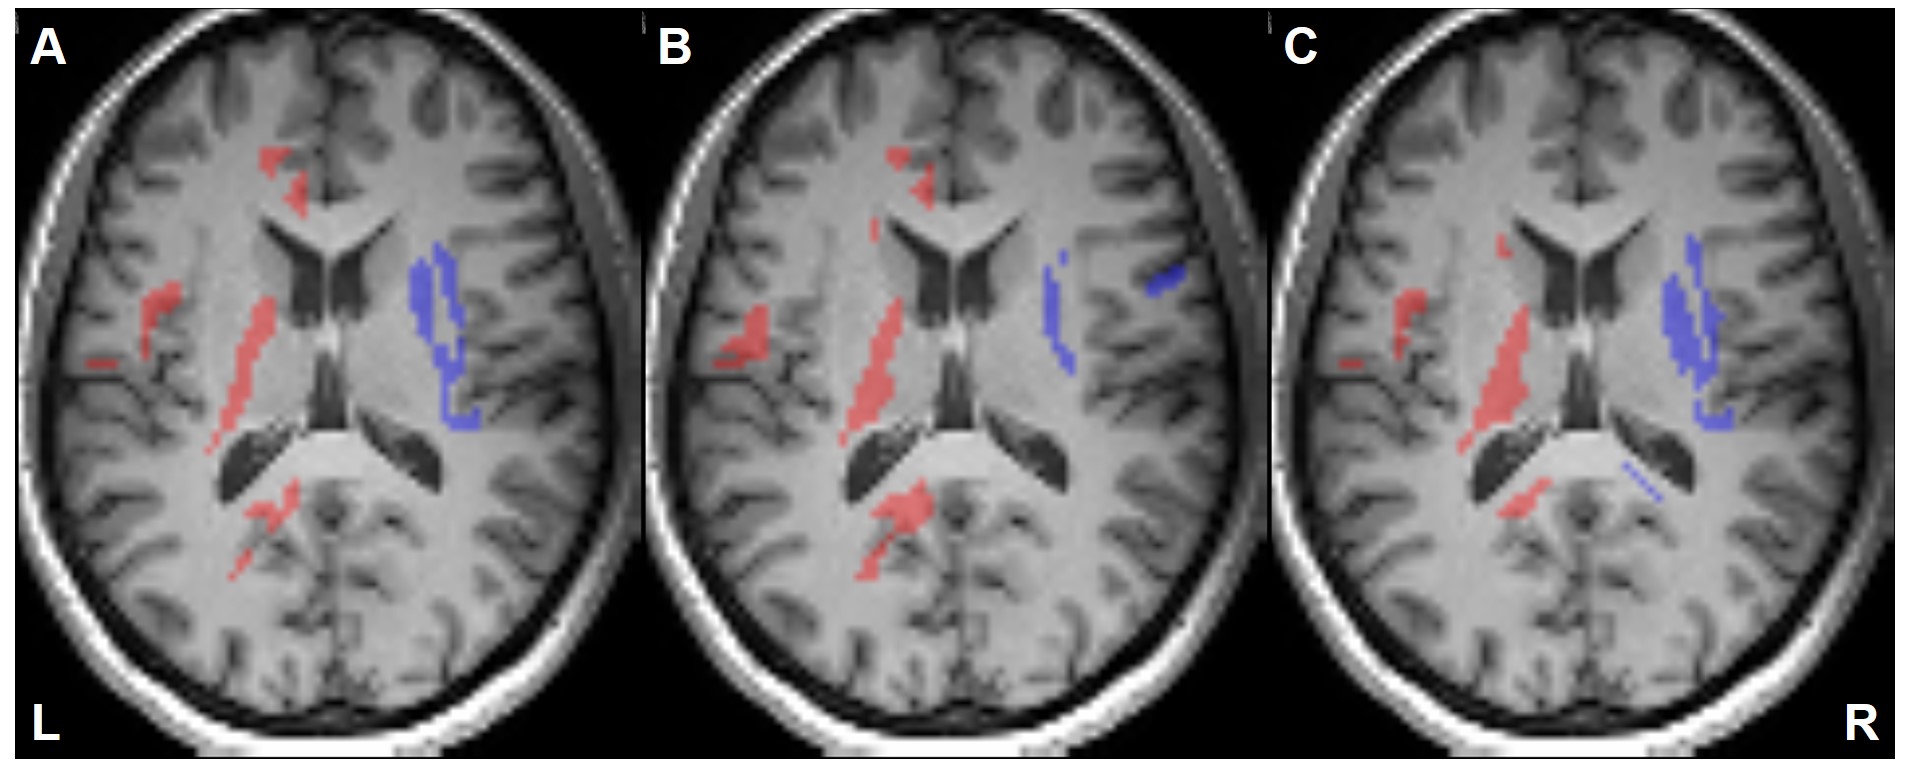
Figure 2 illustrates the voxels with significant laterality in the GFA, NQA, and FA across the brain (uncorrected P<0.001). Leftward asymmetry was mainly observed in the precentral gyrus, internal capsule, cingulate and thalamus, whereas rightward asymmetry mainly in the prefrontal cortex, insula, lentiform nucleus and hippocampus. The area exhibiting leftward asymmetry appeared larger than that of the rightward asymmetry. In these areas exhibiting laterality in the GFA, NQA and FA, a similar pattern of laterality in NAA/Cr and Cho/Cr and a reversed pattern in ADC were observed (corrected P<0.05). The voxels with FA laterality also showed a reversed pattern of Glx/Cr laterality (corrected P<0.05). Laterality in mI/Cr was not observed. The patterns of laterality of the ADC and neurometabolites are summarized in Figures 3-5.Discussion
Leftward asymmetry in motor function and rightward asymmetry in processing of attention, emotion and musical abilities have been reported5-8. This laterality in brain function has been linked to laterality in brain structures: leftward laterality of FA in internal capsule has been reported, for example9. The pattern of asymmetry of GFA, NQA and FA observed in this study agrees with these previous reports in that leftward asymmetry is observed in the motor structures such as the precentral gyrus and internal capsule5,9 and rightward asymmetry in the structures associated with attention and emotion such as prefrontal cortex6, insula and hippocampus7. Controversies exist on FA asymmetry in cingulate10,11. Our study shows leftward asymmetry of this structure.Larger area of leftward asymmetry may be because the left hemisphere forms the dominant hemisphere in right handers. Handedness is reported to play in hemispheric asymmetry12.
Laterality of GFA, NQA, FA, along with that of NAA/Cr, is thought to suggest the abundance of highly-ordered neurons13. A similar pattern of laterality of Cho/Cr may be explained by the role of Cho in the preservation of neuron structures14, as the majority of Cho is present in membrane and myelin. Lack of laterality in mI/Cr may imply that the contribution of glial cells in laterality of tissue microstructure is small when gender effect is negligible. According to literature, men have denser glial cell population in the right hemisphere than women, and vice versa15. This gender-related asymmetry might have been cancelled out in our study which included almost equal number of men and women. The laterality pattern of Glx/Cr still needs to be explained.
Conclusions
There is widespread asymmetry of the DSI indices and metabolite concentrations. Due consideration about normal hemispheric asymmetry of these indices is required in evaluating pathological states. Combined evaluation of DSI and MRSI provides insights about neural underpinnings associated with laterality – which otherwise would not have been achieved if only one of them was employed.Acknowledgements
The authors would like to thank Dr. Andrew Maudsley and Dr. Sulaiman Sheriff for provision of MIDAS software and technical support.
This study was supported by the Grants-in-Aid for Scientific Research by the Japan Society for Promotion of Science (15K01358, 24591741).
References
1. Fernández-Miranda JC, Wang Y, Pathak S, Stefaneau L, Verstynen T, Yeh FC. Asymmetry, connectivity, and segmentation of the arcuate fascicle in the human brain. Brain Struct Funct. 2015, 220:1665-1680.
2. Panesar SS, Yeh FC, Deibert CP, Fernandes-Cabral D, Rowthu V, Celtikci P, Celtikci E, Hula WD, Pathak S, Fernández-Miranda JC. A diffusion spectrum imaging-based tractographic study into the anatomical subdivision and cortical connectivity of the ventral external capsule: uncinate and inferior fronto-occipital fascicles. Neuroradiology. 2017, 59:971-987.
3. http://dsi-studio.labsolver.org
4. http://mrir.med.miami.edu:8000/midas
5. Taylor HG, Heilman KM. Left-hemisphere motor dominance in righthanders. Cortex. 1980, 16:587-603.
6. Shulman GL, Pope DL, Astafiev SV, McAvoy MP, Snyder AZ, Corbetta M. Right hemisphere dominance during spatial selective attention and target detection occurs outside the dorsal frontoparietal network. J Neurosci. 2010, 30:3640-3651.
7. Gainotti G. The Role of the Right Hemisphere in Emotional and Behavioral Disorders of Patients With Frontotemporal Lobar Degeneration: An Updated Review. Front Aging Neurosci. 2019, 11:55.
8. Tramo MJ, Bharucha JJ. Musical priming by the right hemisphere post-callosotomy. Neuropsychologia. 1991, 29:313-325.
9. Seizeur R, Magro E, Prima S, Wiest-Daesslé N, Maumet C, Morandi X. Corticospinal tract asymmetry and handedness in right- and left-handers by diffusion tensor tractography. Surg Radiol Anat. 2014, 36:111-24.
10. Gong G, Jiang T, Zhu C, Zang Y, He Y, Xie S, Xiao J. Side and handedness effects on the cingulum from diffusion tensor imaging. Neuroreport. 2005, 16:1701-1705.
11. Das SK, Wang JL, Bing L, Bhetuwal A, Yang HF. Regional Values of Diffusional Kurtosis Estimates in the Healthy Brain during Normal Aging. Clin Neuroradiol. 2017, 27:283-298.
12. Kim SG, Ashe J, Hendrich K, Ellermann JM, Merkle H, Uğurbil K, Georgopoulos AP. Functional magnetic resonance imaging of motor cortex: hemispheric asymmetry and handedness. Science. 1993, 261:615-617.
13. Uylings HB, Jacobsen AM, Zilles K, Amunts K. Left-right asymmetry in volume and number of neurons in adult Broca's area. Cortex. 2006, 42:652-658.
14. Degaonkar MN, Khubchandhani M, Dhawan JK, Jayasundar R, Jagannathan NR. Sequential proton MRS study of brain metabolite changes monitored during a complete pathological cycle of demyelination and remyelination in a lysophosphatidyl choline (LPC)-induced experimental demyelinating lesion model. NMR Biomed. 2002, 15:293–300.
15. Amunts VV. Individual variability in the structural asymmetry of the dorsomedial nucleus of the thalamus in men and women. Neurosci Behav Physiol. 2008, 38:715-720.
Figures
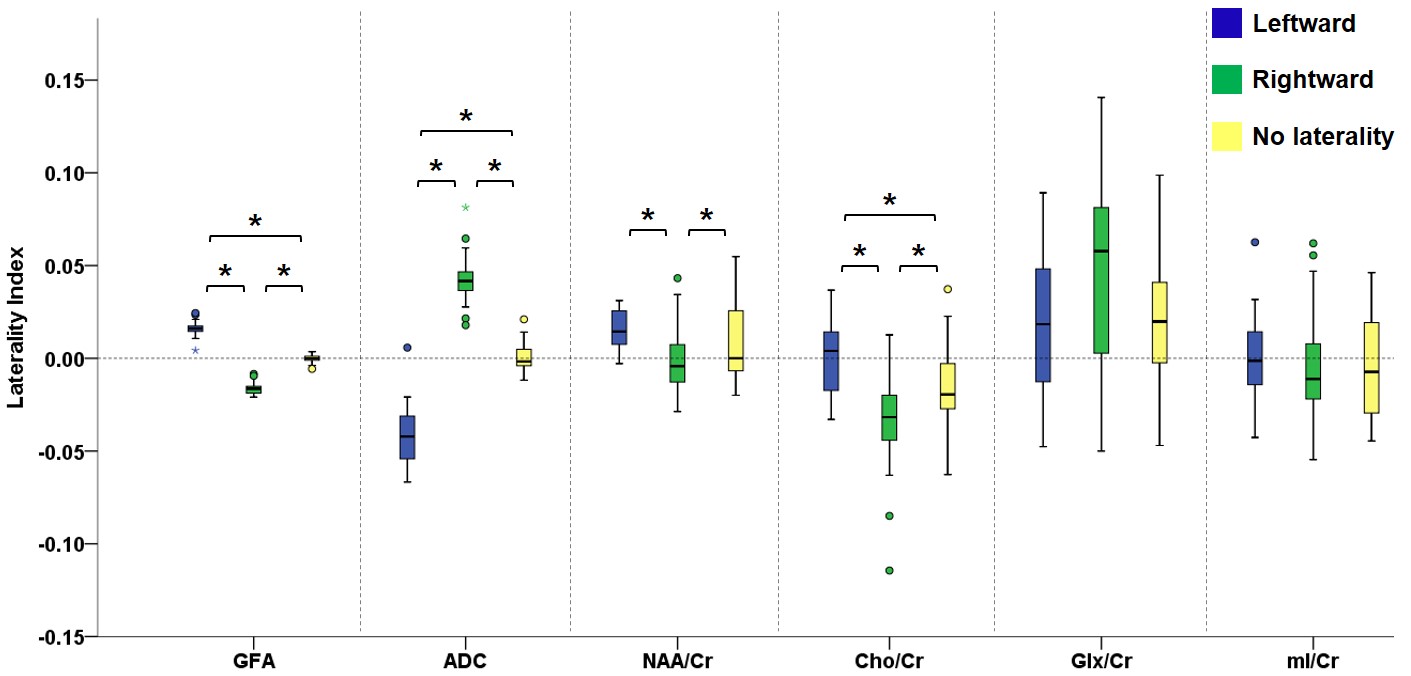
Boxplots in the leftmost part show the laterality index of GFA in voxels with leftward asymmetry (blue), rightward asymmetry (green) and without any laterality (yellow). The pattern of laterality of the ADC and metabolite ratio maps in these voxels is determined by calculating the laterality index. Brackets and asterisks denote statistical significance (corrected P<0.05). A similar pattern of laterality is observed with NAA/Cr and Cho/Cr, and a reversed pattern with ADC.