1857
Comparison of three tissue sodium concentration quantification methods at 3T and 7T MRI.
Lazar Fleysher1, Mounir El Mendili2, Guilaume Madelin3, Fernando Boada 3, and Matilde Inglese2
1Mount Sinai Medical Center, New York, NY, United States, 2Icahn School of Medicine at Mount Sinai, New York, NY, United States, 3NYU School of Medicine, New York, NY, United States
1Mount Sinai Medical Center, New York, NY, United States, 2Icahn School of Medicine at Mount Sinai, New York, NY, United States, 3NYU School of Medicine, New York, NY, United States
Synopsis
We report results of a comparison of three methods of tissue sodium concentration (TSC) quantification which use GRE, FLORET and TPI acquisition techniques at different field strengths. Results demonstrate a good inter-method agreement (better than 10%) in TCS quantification.
Introduction
We report results of a comparison of three methods of tissue sodium concentration (TSC) quantification which use GRE, FLORET and TPI acquisition techniques at different field strengths.Methods
Acquisition. Nine healthy volunteers (four females) were studied. Images were acquired with 7T Siemens Magntom and 3T Siemens Prisma MRI scanners (Siemens, Erlangen, Germany) equipped with a custom-made dual-tuned Na/H head coils. Acquisition protocol included 1H-MPRAGE and sodium images using a TPI-based[1], FLORET-based[2] and GRE-based[3] sequences. TPI-based acquisition was conducted at 3T, while the other two were done at 7T. For the purposes of tissue sodium concentration (TSC) quantification, 150mmol/L and 100mmol/L reference tubes were used at 7T, while at 3T the vitreous body of the eye was used as a signal reference. It was not possible to place reference tubes in the FOV at 3T due to a small size of the head coil. To evaluate the pair-wise differences between the methods, Bland-Altman plots[4] were used. To avoid partial-volume effects with CSF, signal from the white matter was used in the comparison.Systematic errors between the methods. Vertical axis in Bland-Altman plots depicts the measurement of the difference between the two methods with 95% confidence interval marked as dashed-dotted lines. Consequently, a non-zero average (solid line) represents a combination of systematic methodological and instrumental differences between the two compared methods. The systematic error could be caused by un-accounted B0 and B1 inhomogeneities, B0 and B1-offsets, image SNR, signal calibration technique and (in case of GRE acquisition) signal decay correction. The scatter of values along the vertical axis represents a combination of intra-subject methodological and instrumental systematic errors.
Biological spread. The absolute values on the horizontal axis represent the average of the two compared TSC concentrations and the horizontal scatter represents a combination of subject-to-subject biological variations (mostly due to age differences) and intra-subject methodological/instrumental systematic errors.
Results
The obtained measurements show that FLORET vs TPI systematic difference is about 3.2%, GRE vs FLORET one is 6.5% and GRE vs TPI one is 9.7%. On average, GRE-based method produces the lowest TSC values, while TPI method produces the highest ones. The GRE-FLORET 95% confidence interval is the shortest probably due the fact that the two images were acquired in a single session at 7T which increases SNR and minimizes differences due to B1 and B0 inhomogeneities. TPI images were acquired in a separate session on a 3T scanner therefore contribution of noise, B1 and B0 effects into the quantification could be very different increasing the random-appearing scatter in the values.Conclusions
In this work we demonstrate a good inter-method agreement (better than 10%) in TCS quantification.Acknowledgements
This study was supported in part by NS099527.References
1.Qian et al. Magnetic Resonance Imaging 27:656 (2009)
2. Madelin et al. Scientific Reports 4:4763 (2014)
3. Fleysher et al. NMR Biomed 26:9 (2013)
4. Bland et al. Statistical Methods in Medical Research 8:135 (1999)
Figures
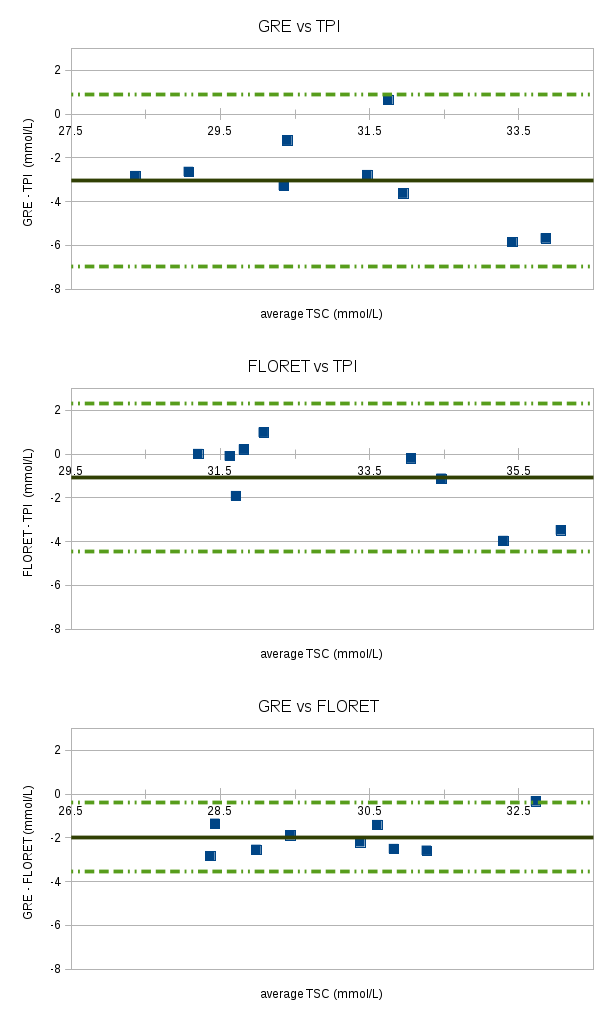
Bland-Altman plots for pair-wise method comparison. Solid line is the
mean difference, dashed line is 95% confidence interval.