1855
Diffusion of NAA as a marker for tau pathology in Alzheimer's disease - a combined diffusion weighted MRS and positron emission tomography study.
Nicola Spotorno1, Markus Nilsson2, Boel Hansson2, Felix Andersson3, Antonie Leuzy3, Danielle van Westen2, Oskar Hansson3, and Itamar Ronen4
1Department of Medicine, University of Pennsylvania, Philadelphia, PA, United States, 2Department of Diagnostic Radiology, Lund University, Lund, Sweden, 3Department of clinical sciences Malmö, Lund University, Lund, Sweden, 4Department of Radiology, Leiden University Medical Center, Leiden, Netherlands
1Department of Medicine, University of Pennsylvania, Philadelphia, PA, United States, 2Department of Diagnostic Radiology, Lund University, Lund, Sweden, 3Department of clinical sciences Malmö, Lund University, Lund, Sweden, 4Department of Radiology, Leiden University Medical Center, Leiden, Netherlands
Synopsis
Intraneuronal tau accumulation is a hallmark of Alzheimer's disease. Currently, positron emission tomography with tau specific ligands (Tau-PET) is the only neuroimaging method for measuring tau in AD. In this study that combines Tau-PET with diffusion weighted MRS we show that the apparent diffusion coefficient of NAA, a neuronal metabolite, is significantly lower in AD patients compared to healthy controls in a brain region that shows elevated levels of uptake of the tau-PET ligand. Standard MRS data shows elevated level of glial metabolites, suggesting concomitant gliosis of neuroinflamation. We propose ADC(tNAA) as a putative marker for tau aggregation in AD.
Introduction
Alzheimer’s disease (AD) is characterized by aggregation of the proteins amyloid beta (Aβ) and hyperphosphorylated tau, a protein crucial to the structural stabilization of microtubules. Although cerebral accumulation of Aβ occurs earlier in the disease time course of AD, tau pathology is more closely linked to disease outcome1 and the distribution of cortical tau appears to recapitulate disease spreading in AD2. Importantly, the onset of tau pathology precedes atrophy and neuronal death3. So far no MR based modality has provided evidence that can be directly linked to intracellular tau aggregation and positron emission tomography (PET) is the only neuroimaging tool for in vivo detection and quantification of cortical tau pathology. Diffusion weighted magnetic resonance spectroscopy (DW-MRS) is a unique tool for probing cytomorphological properties in a cell-specific manner4. DW-MRS measures, such as metabolite apparent diffusion coefficients (ADC) are thus independent from metabolite concentrations measured by standard MRS. We hypothesized that tau aggregation in neurons will selectively affect the diffusion of N-acetylaspartate (NAA), a metabolite specific to neurons in the CNS5, and that changes in the ADC of NAA are independent form changes in NAA concentration, which are related to neuronal death. In this study we measured DW-MRS and conventional MRS in a cohort of AD patients and healthy controls, who were also scanned with tau-PET.materials and methods
Study population: 5 AD patients (participants with dementia due to AD, accordingly to published criteria6; patient characteristics in table 1) and 4 healthy controls with no evidence of cerebral amyloidosis accordingly to CSF Aβ42/40 ratio (HC) were included so far. MRI and MRS scans were performed on a 7T whole-body MRI scanner (Philips medical, Best, The Netherlands) equipped with a dual transmit 32-channel receive RF coil (Nova, Wilmington MA, USA). Following a localizer and a T1-weighted image, a 2x2x2 cm3 volume of interest (VOI) was positioned on the posterior cingulate cortex (PCC, figure 1), a region in which tau accumulates early in the disease time course7-9. MRS (sLASER, TR/TE=4000/30ms) and DW-MRS (bipolar DW-MRS sequence based on sLASER, TR/TE=4 heart beats/110ms, 3 orthogonal diffusion weighting directions at b=100/4000 s/mm2) were acquired, followed by a short acquisition of the water signal with similar DW conditions for eddy current correction. The same scans were repeated on a VOI in the anterior cingulate cortex (ACC), a region in which tau accumulation becomes significant much later in the disease time course7-9. PET protocol: The second-generation tau-PET tracer [18F]-RO-948 (previously referred to as [18F]-RO6958948) was synthesized in situ, and PET scans were performed on a GE Discovery 690 PET scanner (General Electric Medical Systems). FreeSurfer parcellation (v6; http://surfer.nmr.mgh.harvard.edu/), carried out in anatomical MRI space, was applied to processed, co-registered, and time-averaged PET emission images in order to extract regional uptake values. [18F]-RO-948 standardized uptake value ratio (SUVR) images were obtained from the mean uptake over a 70-90 min post-injection interval10, globally normalized to the mean uptake in an inferior cerebellar gray matter (reference) region11.results
Figure 2 shows averaged standardized uptake value ratio (SUVR) maps of [18F]-RO-948 in the AD patients and in HC. The difference in uptake between AD and HC is clearly seen, as well as the difference in uptake in AD between the PCC and ACC. Figure 3 shows the apparent diffusion coefficients (ADC) of NAA, choline compounds (tCho) and total creatine (tCr) in both VOIs in AD and HC. The ADC(tNAA) in the PCC of AD was significantly lower than in the PCC of HC (p=0.0089). The difference in ADC(tNAA) between AD and AC in the ACC VOI was not significant. Metabolites levels (normalized to tCr) in the PCC also showed significant differences, particularly a significantly higher level of glial metabolites (Glutamine, myo-inositol and tCho) in AD than in HC (figure 4). Differences in NAA levels in neither VOI have reached statistical significance.Discussion and conclusions
Results at this stage of this project show strong evidence to support the notion that ADC(tNAA) is a putative biomarker for intraneuronal tau aggregation in AD. Intracellular diffusion has already been shown to be sensitive to cytomorphological changes in disease, and previous studies in multiple sclerosis already indicated the potential of ADC(tNAA) as a marker for intraneuronal pathology12 13. While tNAA concentration differences in the PCC between AD and HC were not significant, concentration of glial markers associated with inflammatory processes and gliosis showed significant differences in the PCC between AD and HC, contributing to the overall picture of pathology in the PCC in this cohort. As additional analyses when more subjects are included, we intend to correlate individual ADC(tNAA) and [tNAA] with average SUVR [18F]-RO-948 values within the spectroscopic VOIs in the PCC and ACC to provide converging evidence that differences in ADC(tNAA) are related to tau aggregation.We will also include early stage AD patients (MCI) to examine whether DW-MRS detects changes in ADC(tNAA) that precede atrophy and drop in tNAA concentrations. We will also analyze DTI data acquired from the same cohort (not shown) for correlation with water diffusion values. In conclusion, ADC(tNAA) as measured by DW-MRS is a promising specific putative marker for intracellular tau aggregation in AD, and uniquely enriches the pathological picture of AD provided by MR.Acknowledgements
No acknowledgement found.References
- Jack CR, Jr., Bennett DA, Blennow K, et al. NIA-AA Research Framework: Toward a biological definition of Alzheimer's disease. Alzheimers Dement 2018;14(4):535-62. doi: 10.1016/j.jalz.2018.02.018 [published Online First: 2018/04/15]
- Vogel JW, Mattsson N, Iturria-Medina Y, et al. Data-driven approaches for tau-PET imaging biomarkers in Alzheimer's disease. Hum Brain Mapp 2019;40(2):638-51. doi: 10.1002/hbm.24401 [published Online First: 2018/10/29]
- Cavedo E, Lista S, Khachaturian Z, et al. The Road Ahead to Cure Alzheimer's Disease: Development of Biological Markers and Neuroimaging Methods for Prevention Trials Across all Stages and Target Populations. The journal of prevention of Alzheimer's disease 2014;1(3):181-202. doi: 10.14283/jpad.2014.32 [published Online First: 2015/10/20]
- Palombo M, Shemesh N, Ronen I, et al. Insights into brain microstructure from in vivo DW-MRS. Neuroimage 2017 doi: 10.1016/j.neuroimage.2017.11.028
- Choi JK, Dedeoglu A, Jenkins BG. Application of MRS to mouse models of neurodegenerative illness. NMR Biomed 2007;20(3):216-37. doi: 10.1002/nbm.1145
- Diagnostic and Statistical Manual of Mental Disorders. fifth ed: American Psychiatric Association 2013.
- Palmqvist S, Scholl M, Strandberg O, et al. Earliest accumulation of beta-amyloid occurs within the default-mode network and concurrently affects brain connectivity. Nat Commun 2017;8(1):1214. doi: 10.1038/s41467-017-01150-x [published Online First: 2017/11/02]
- Hoenig MC, Bischof GN, Seemiller J, et al. Networks of tau distribution in Alzheimer's disease. Brain 2018;141(2):568-81. doi: 10.1093/brain/awx353 [published Online First: 2018/01/10]
- Jacobs HIL, Hedden T, Schultz AP, et al. Structural tract alterations predict downstream tau accumulation in amyloid-positive older individuals. Nat Neurosci 2018;21(3):424-31. doi: 10.1038/s41593-018-0070-z [published Online First: 2018/02/07]
- Kuwabara H, Comley RA, Borroni E, et al. Evaluation of (18)F-RO-948 PET for Quantitative Assessment of Tau Accumulation in the Human Brain. J Nucl Med 2018;59(12):1877-84. doi: 10.2967/jnumed.118.214437 [published Online First: 2018/08/12]
- Maass A, Landau S, Baker SL, et al. Comparison of multiple tau-PET measures as biomarkers in aging and Alzheimer's disease. Neuroimage 2017;157:448-63. doi: 10.1016/j.neuroimage.2017.05.058 [published Online First: 2017/06/08]
- Wood ET, Ercan E, Sati P, et al. Longitudinal MR spectroscopy of neurodegeneration in multiple sclerosis with diffusion of the intra-axonal constituent N-acetylaspartate. Neuroimage Clin 2017;15:780-88. doi: 10.1016/j.nicl.2017.06.028
- Wood ET, Ronen I, Techawiboonwong A, et al. Investigating axonal damage in
multiple sclerosis by diffusion tensor spectroscopy. J Neurosci 2012;32(19):6665-9. doi: 10.1523/JNEUROSCI.0044-12.201232/19/6665
[pii] [published Online First: 2012/05/11]
Figures
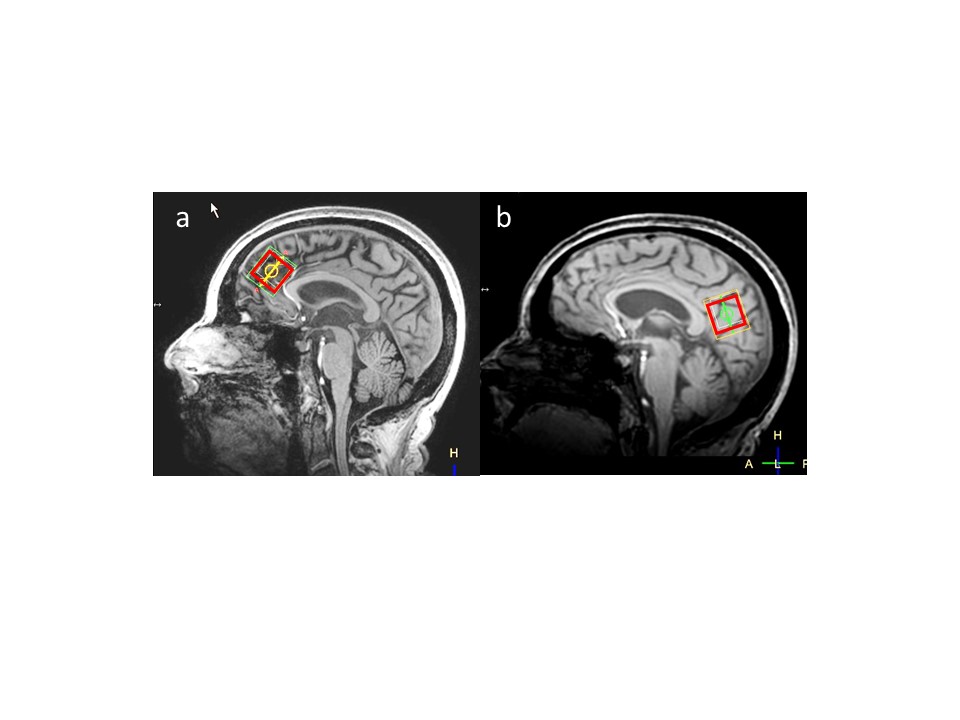
Figure 1: The volumes of interest
for the DW-MRS and MRS measurements in this study: (a) ACC (anterior cingulate cortex); (b) PCC (posterior cingulate cortex).
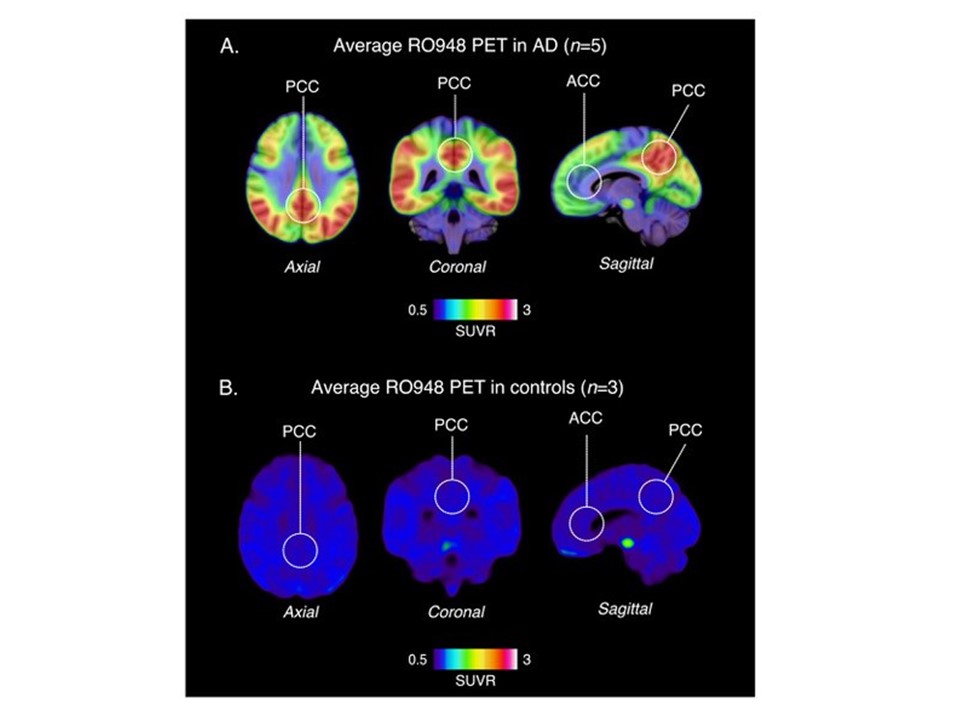
Figure 2: Average SUVR maps for
[18F]-RO-948 uptake in the AD cohort (A) and in HC (B) shown in axial, coronal
and sagittal orientations. Maps are displayed on MNI brain templates.
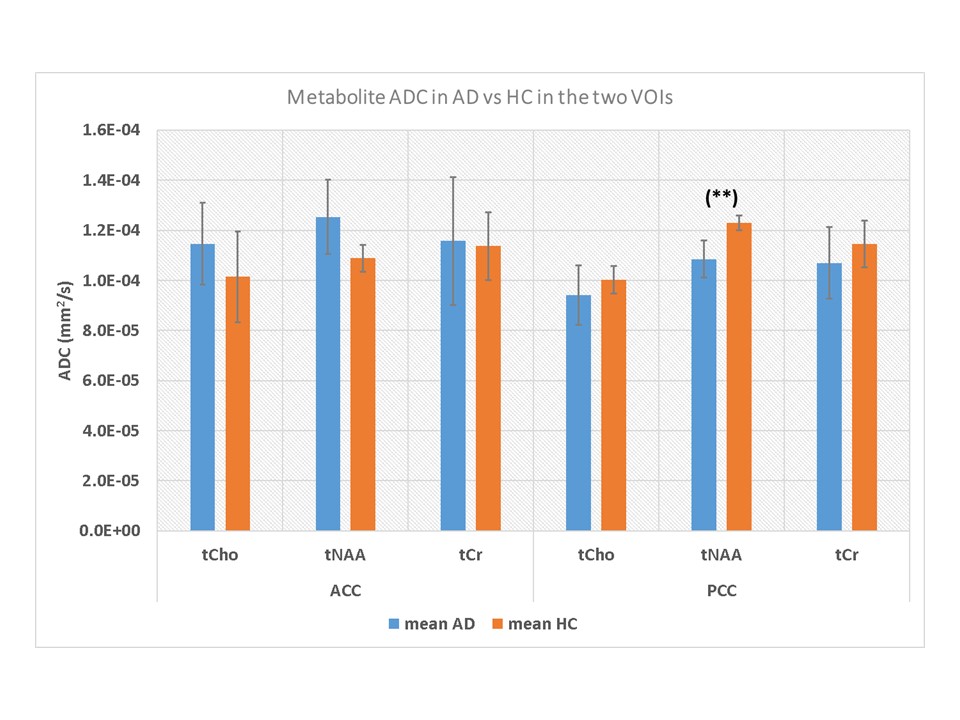
Figure 3: ADC values for total
choline (tCho), total creatine (tCr) and NAA+NAAG (tNAA) in AD and HC, as
calculated form the DW-MRS data acquired in the two VOIs: ACC and PCC. The only
significant difference was the one in ADC(tNAA) in the PCC between AD and HC
(p=0.0089).
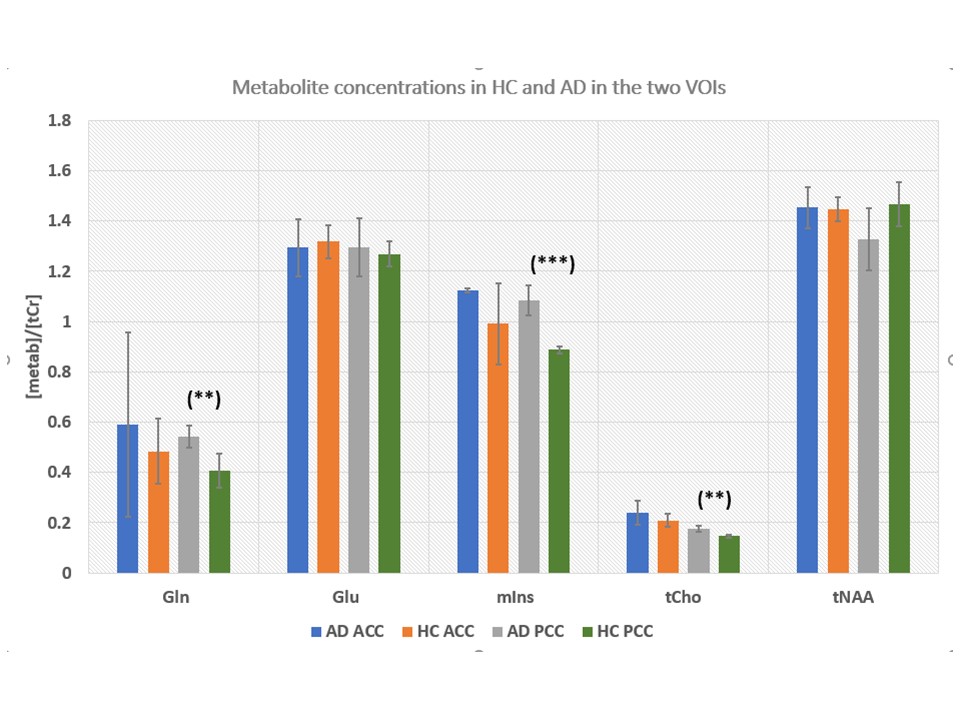
Figure 4: Metabolite
concentrations expressed as a ratio to [tCr] in the ACC and PCC of AD and HC.
Significant differences in glial metabolites (Gln, mIns and tCho) were found in
the PCC between AD and HC, suggesting gliosis or neuroinflammation in the PCC
of AD patients.
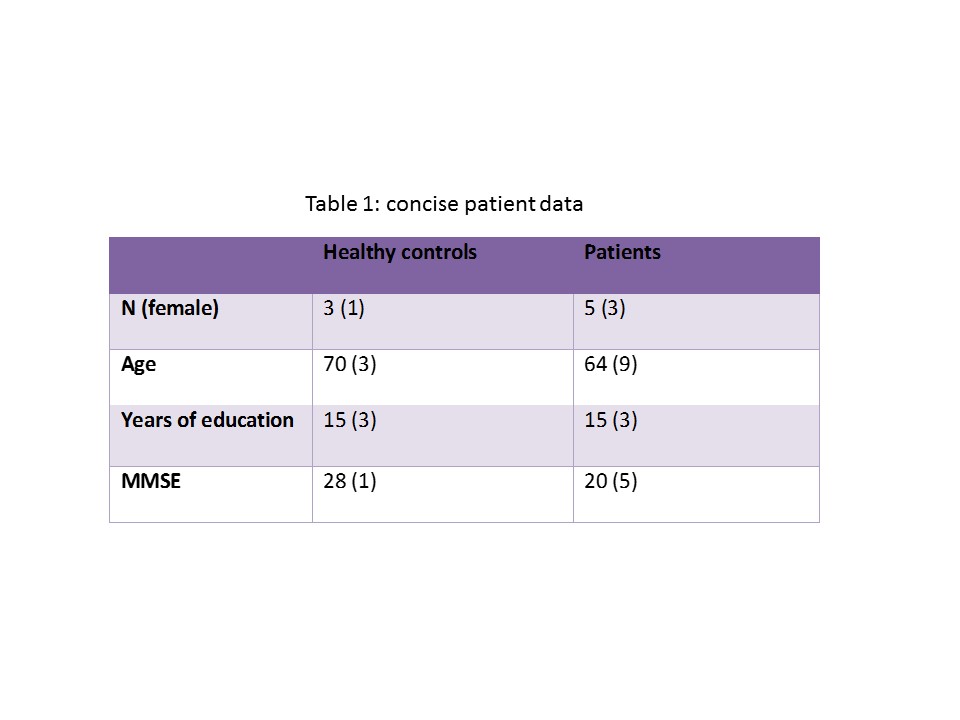
Table 1: demographic and clinical
data of the AD and HC cohorts