1854
Neurochemistry and cognition across age: Examining the link between working memory and neuronal and glial markers measured with 1H-MRS at 7T1Danish Research Centre for Magnetic Resonance, Centre for Functional and Diagnostic Imaging and Research, Copenhagen University Hospital Hvidovre, Hvidovre, Denmark, 2Center for Magnetic Resonance, Department of Electrical Engineering, Technical University of Denmark, Lyngby, Denmark, 3Department of Clinical Medicine, Faculty of Health and Medical Sciences, University of Copenhagen, Copenhagen, Denmark, 4Department of Neurology, Copenhagen University Hospital Bispebjerg, Copenhagen, Denmark, 5Department of Radiation Sciences, Umeå University, Umeå, Sweden, 6Institute of Sports Medicine Copenhagen, Copenhagen University Hospital Bispebjerg, Copenhagen, Denmark
Synopsis
Ageing has been associated with widespread neurochemical changes and cognitive decline. The increased sensitivity and resolution of 1H-MRS at 7T could shed new light on the potential relationship between neurochemistry and cognition during ageing. Our data show that primarily levels of glial metabolic markers, and not neuronal markers, differed between younger, middle-aged and older normal individuals and were correlated with visuo-spatial working memory performance across these age groups. This suggests that glial markers may be more affected by ageing than neuronal markers and that there is a potential association between glial markers and visuo-spatial working memory performance during ageing.
Introduction
Ageing is associated with widespread neurochemical alterations with concomitant changes in cognitive performance1. 1H-MRS has been used to study neurochemical changes across the lifespan but results have been inconclusive thus far. The five most commonly investigated brain metabolites in 1H-MRS ageing studies are myo-inositol (mIns), creatine (Cr), choline (Cho), N-acetyl aspartate (NAA) and glutamate (Glu)2. MIns, Cr and Cho have higher concentrations in glial cells; NAA and Glu are commonly regarded as markers of neuronal health and function. Neurochemical changes during ageing appear to be region dependent3. The aim of this study was to improve the understanding of regional metabolic differences across age groups using 7T 1H-MRS and to investigate the potential relationship between brain metabolites and cognitive ageing.Methods
ParticipantsSixty normal participants were included, 20 in each of three age groups: younger (18-26 years), middle-aged (39-50 years) and older (69-79 years) (M/F=50%/50% in all groups). One participant from the older group was excluded due to an unexpected pathological finding. Experiments were performed in accordance with local ethical guidelines.
MR
A Philips 7T whole body MR scanner (Philips, Best, Netherlands) was used in combination with a dual transmit coil and a 32-channel receive head coil (Nova Medical, Wilmington, MA, USA). A T1-weighted magnetization prepared rapid gradient echo (MPRAGE) sequence (slices=380, slice thickness=0.5, TR=8.0 ms, TE=3.2 ms, flip angle=7 degrees, field of view=256x256x190, acquisition matrix=64x64x380) was acquired for anatomical reference and tissue classification. A semi-localised by adiabatic selective refocusing (sLASER) sequence4,5 (TR/TE=3700/32 ms, bandwidth=4 kHz, data points=2048) was used in the medial ACC (20x20x20 mm3, 16 acquisitions), left DLPFC (12x20x20 mm3, 32 acquisitions), left hippocampus (30x15x15 mm3, 64 acquisitions) and left thalamus (16x12x16 mm3, 64 acquisitions) (Figure 1). At the beginning of each scan, a non-water suppressed spectrum was acquired and afterwards variable pulse power and optimized relaxation (VAPOR) delay water suppression6 was applied. The FASTERMAP algorithm was used for second order B0 shimming for each voxel separately with the shim box 15 mm larger in each direction than the voxel and centered on the voxel. Fractions of grey matter (GM), white matter (WM) and cerebrospinal fluid (CSF) in each voxel were calculated with voxel-based morphometry using CAT127 implemented in SPM12.
Spectral fitting and quantification
Spectra were fitted with LCModel8 using a basis set with 20 metabolites and a measured macromolecular baseline. Levels of mIns, total Cr (tCr, Cr+PCr), total Cho (tCho, GPC+PCh), total NAA (tNAA, NAA+NAAG) and Glu were used for the main analyses. Overall spectral quality was good (Table 1). Metabolite concentration estimates were corrected for tissue fractions in the voxel9,10 including tissue specific attenuation factors for T1 and T2 relaxation times11,12.
Cognitive testing
Cognitive testing was performed on a tablet using the Cambridge Neuropsychological Test Automated Battery (CANTAB) (Cambridge Cognition Ltd., Cambridge, United Kingdom). Two tests targeting spatial working memory were included, the paired associates learning (PAL) and spatial working memory (SWM) test. PAL and SWM scores were correlated and thus summed into a composite visuo-spatial working memory (vsWM) score.
Statistics
SPSS25 (Chicago, IL, US) was used for statistical analyses. Threshold of significance was set to p<0.05, after correction for multiple comparisons where applicable. MANCOVA was used to investigate overall and regional age-related metabolite differences. Significant main effects were further qualified by post-hoc ANCOVA and pairwise comparisons. Partial correlations were used to investigate potential correlations between metabolites that differed across age groups within a brain region and vsWM score. GM/WM ratio was used as a covariate in all tests.
Results
For all metabolites in all brain regions, there was a significant main effect of age group (F10,436=12.49, p<0.001) and a significant age group x brain region interaction (F30,1105=1.87, p=0.003). There was a significant main effect of age group in all separate brain regions, ACC (F10,104=4.06, p < 0.001), DLPFC (F10,104=4.20, p < 0.001), hippocampus (F10,102=6.75, p < 0.001), thalamus (F10,102=2.35, p = 0.015). These differences were further qualified with post-hoc testing for each metabolite; see Figure 2 for boxplots of metabolite levels separated by region and age group, including statistics.PAL, SWM and vsWM scores significantly differed between age groups. VsWM score correlated negatively with mIns in hippocampus and thalamus, and with tCr and tCho in the ACC. See Figure 3 for plots and statistics.
Discussion
This study provides 7T 1H-MRS evidence that older individuals generally have higher levels of glia-related metabolites which are negatively correlated with vsWM performance. This was most evident in regions known to be more sensitive to ageing. Except for Glu levels in DLPFC, neuronal markers did not show age-related differences. These results indicate that brain ageing and the concomitant cognitive decline could be related to glial proliferation, but an association with lower neuronal integrity was not observed.Conclusion
The present study applied 7T 1H-MRS to investigate metabolite differences and their relation to vsWM across three age groups. Our findings highlight the role of glial cells across multiple brain regions in brain ageing and the concomitant cognitive decline in vsWM.Acknowledgements
The 7T scanner was donated by the Danish Agency for Science, Technology and Innovation grant no. 0601-01370B, and The John and Birthe Meyer Foundation.References
1. Cleeland C, Pipingas A, Scholey A, White D (2019). Neurochemical changes in the aging brain: A systematic review. Neurosci Biobehav Rev 98:306–319.
2. Cichocka M, Bereś A (2018). From fetus to older age: a review of brain metabolic changes across the lifespan. Ageing Res Rev 46:60–73.
3. Eylers VV, Maudsley AA, Bronzlik P, Dellani PR, Lanfermann H, Ding XQ (2016). Detection of normal aging effects on human brain metabolite concentrations and microstructure with whole-brain MR spectroscopic imaging and quantitative MR imaging. Am J Neuroradiol 37:447–454.
4. Boer VO, van Lier ALHMW, Hoogduin JM, Wijnen JP, Luijten PR, Klomp DWJ (2011). 7-T 1H MRS with adiabatic refocusing at short TE using radiofrequency focusing with a dual-channel volume transmit coil. NMR Biomed 24:1038–1046.
5. Arteaga de Castro CS, Boer VO, Andreychenko A, Wijnen JP, van der Heide UA, Luijten PR, Klomp DWJ (2013). Improved efficiency on editing MRS of lactate and γ-aminobutyric acid by inclusion of frequency offset corrected inversion pulses at high fields. NMR Biomed 26:1213–1219.
6. Tkac I, Andersen P, Adriany G, Merkle H, Ugurbil K, Gruetter R (2001). In vivo 1H NMR spectroscopy of the human brain at 7T. Magn Reson Med 46:199-251.
7. Gaser C, Dahnke R (2016). CAT-A computational anatomy toolbox for the analysis of structural MRI data. Hum Brain Mapp 32:336–348.
8. Provencher SW (2001). Automatic quantitation of localized in vivo 1H spectra with LCModel. NMR Biomed 14:260–264.
9. Gasparovic C, Yeo R, Mannell M, Ling J, Elgie R, Phillips J, Doezema D, Mayer AR (2009). Neurometabolite concentrations in gray and white matter in mild traumatic brain injury: An 1H–magnetic resonance spectroscopy study. J Neurotrauma 26:1635–1643.
10. Quadrelli S, Mountford C, Ramadan S (2016). Hitchhiker’s guide to voxel segmentation for partial volume correction of in vivo magnetic resonance spectroscopy. Magn Reson Insights 27:1–8.
11. Rooney WD, Johnson G, Li X, Cohen ER, Kim SG, Ugurbil K, Springer CS (2007). Magnetic field and tissue dependencies of human brain longitudinal 1H2O relaxation in vivo. Magn Reson Med 57:308–318.
12. Bartha R, Michaeli S, Merkle H, Adriany G, Andersen P, Chen W, Ugurbil K, Garwood M (2002). In vivo 1H2O T2+ measurement in the human occipital lobe at 4T and 7T by Carr-Purcell MRI: Detection of microscopic susceptibility contrast. Magn Reson Med 47:742–750.
Figures
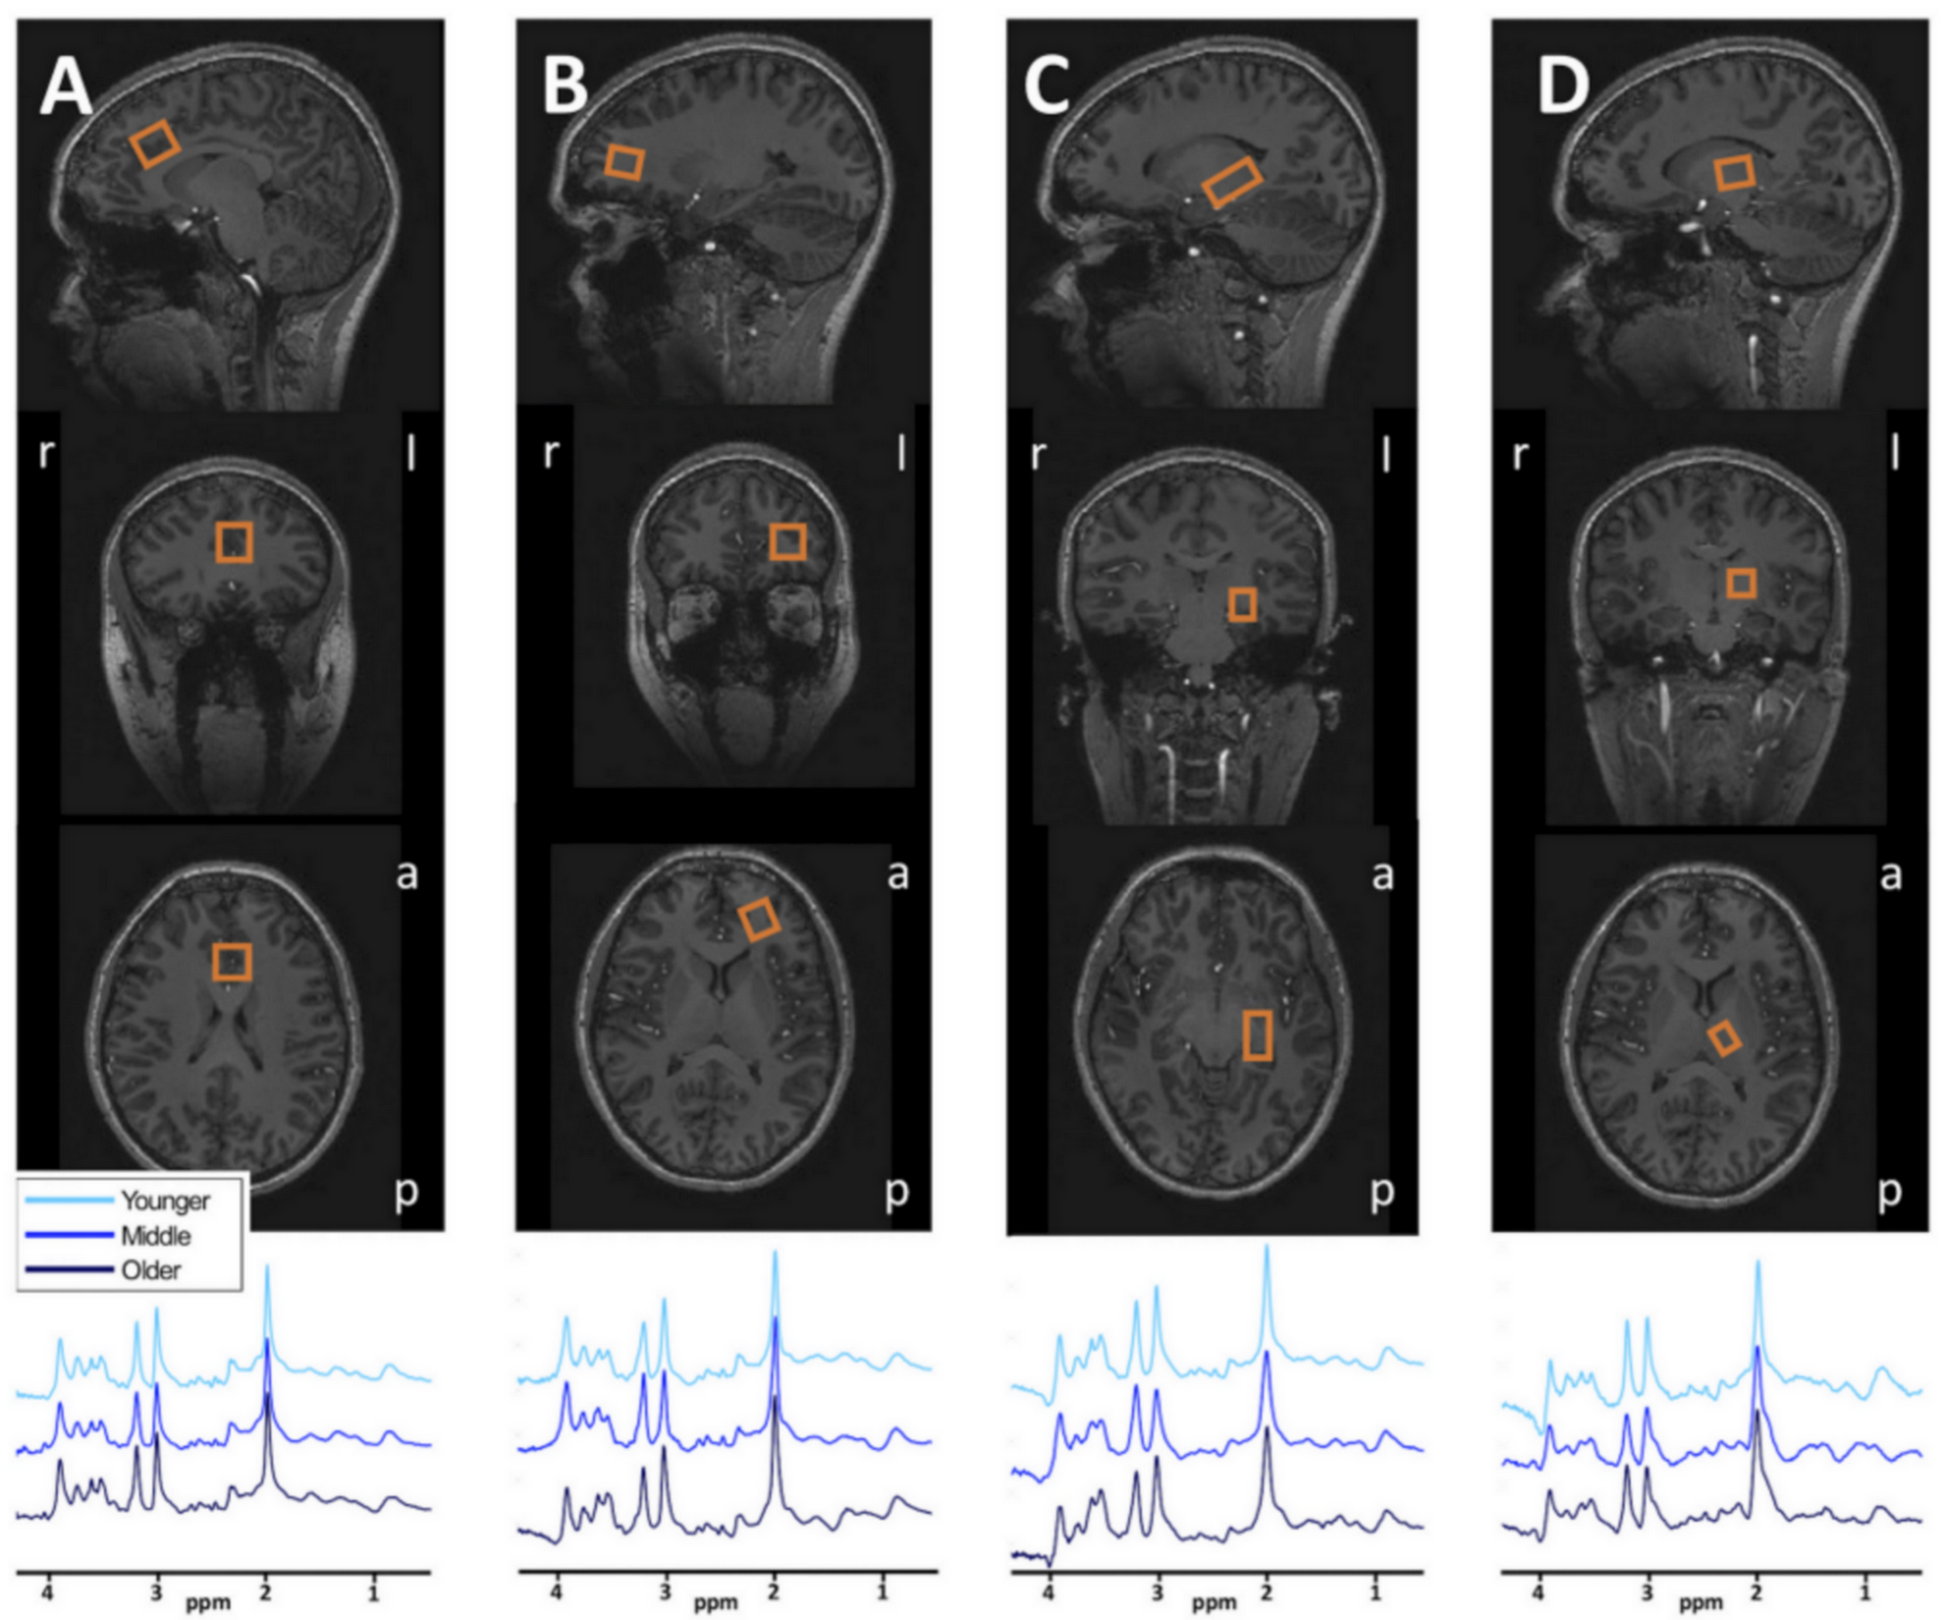
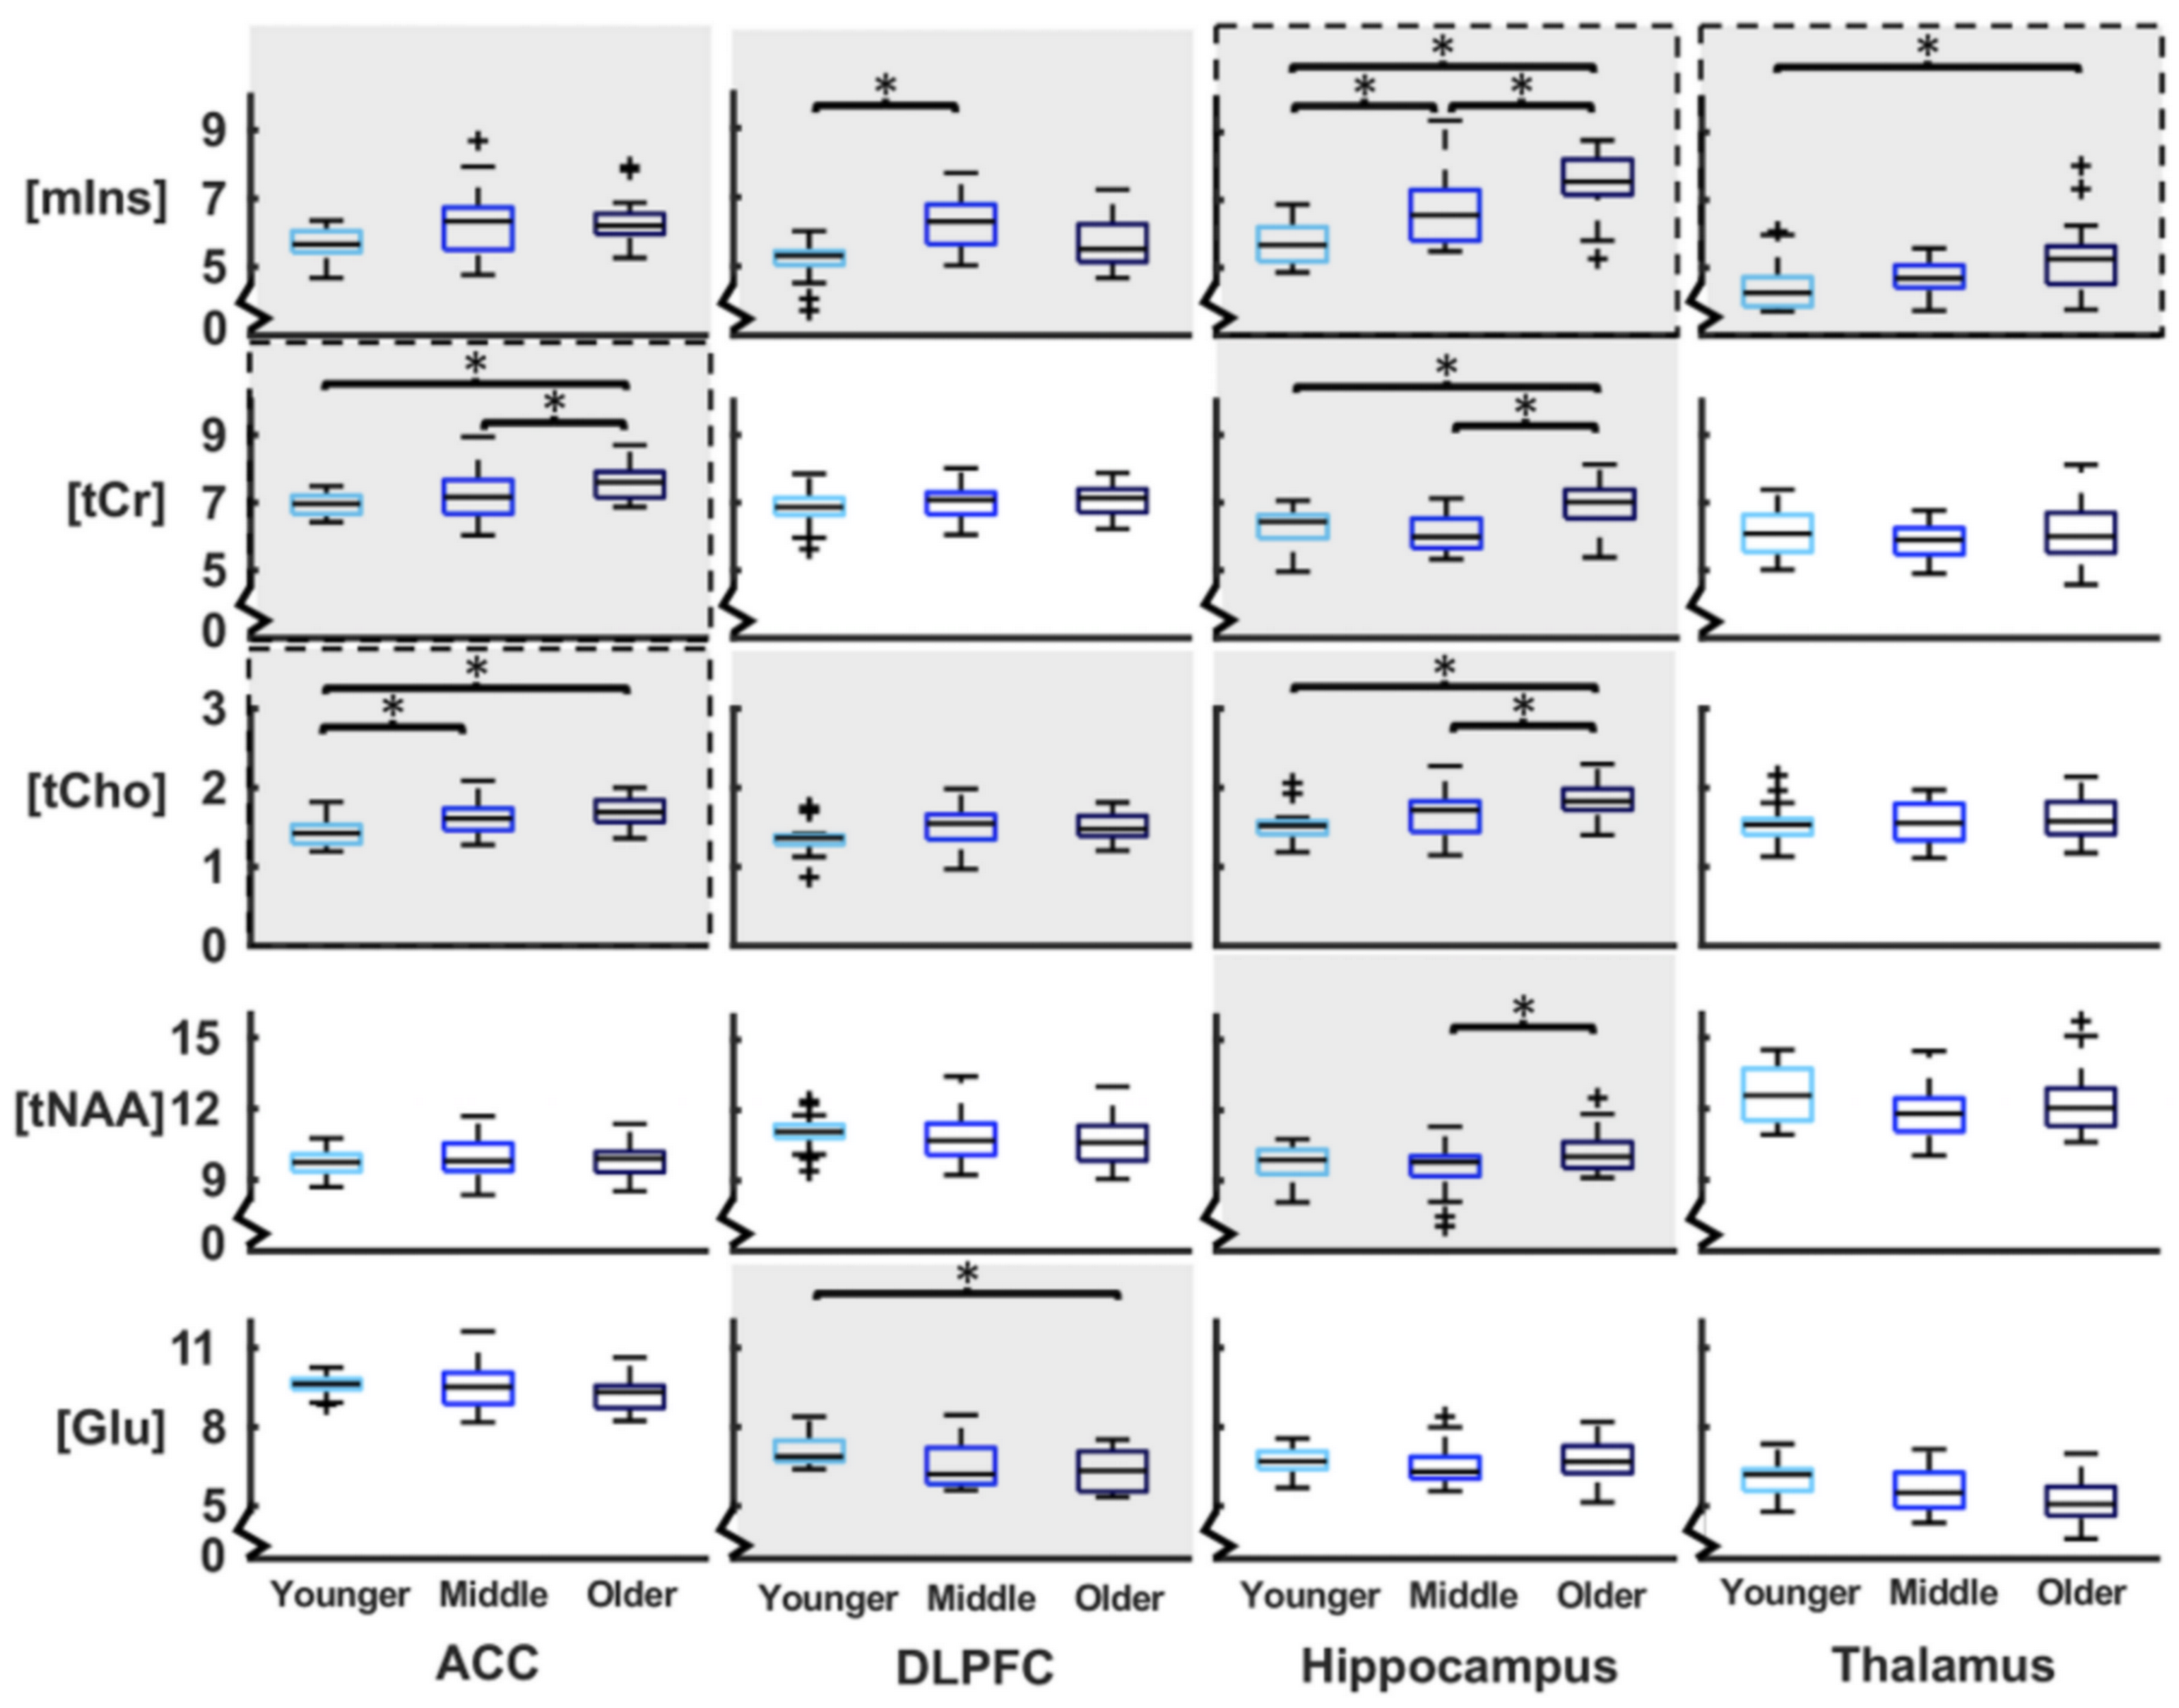
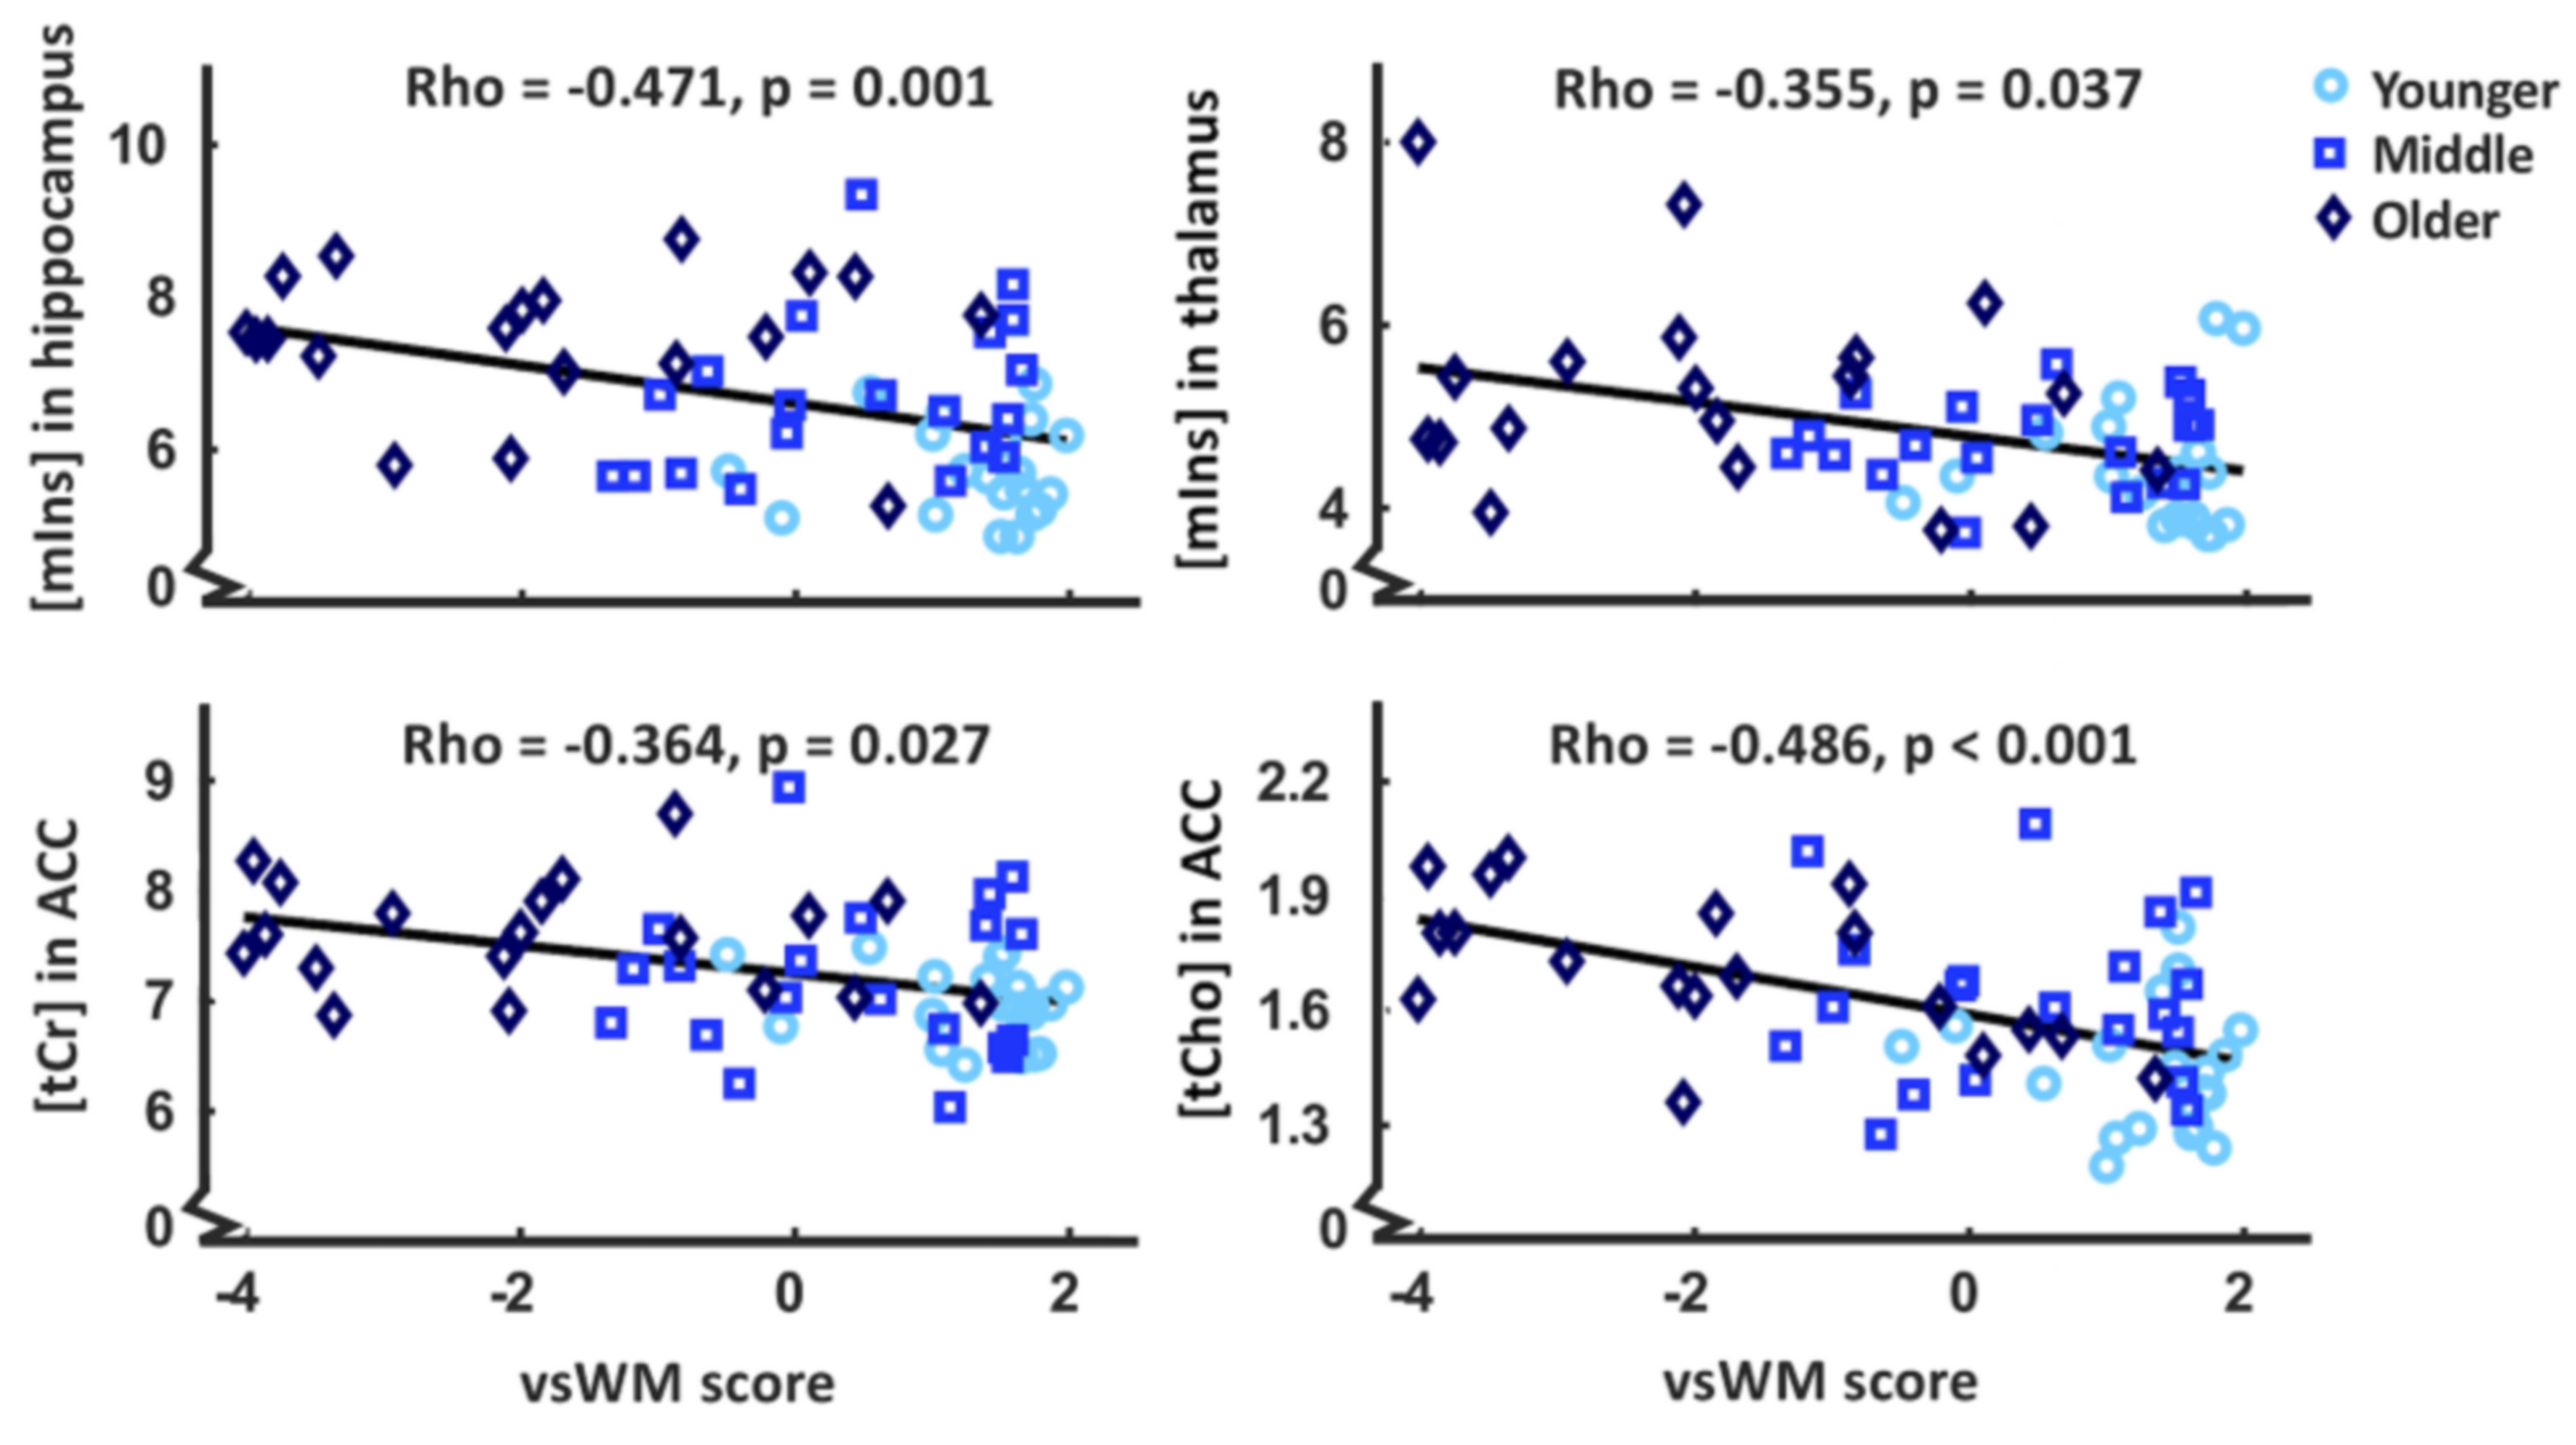
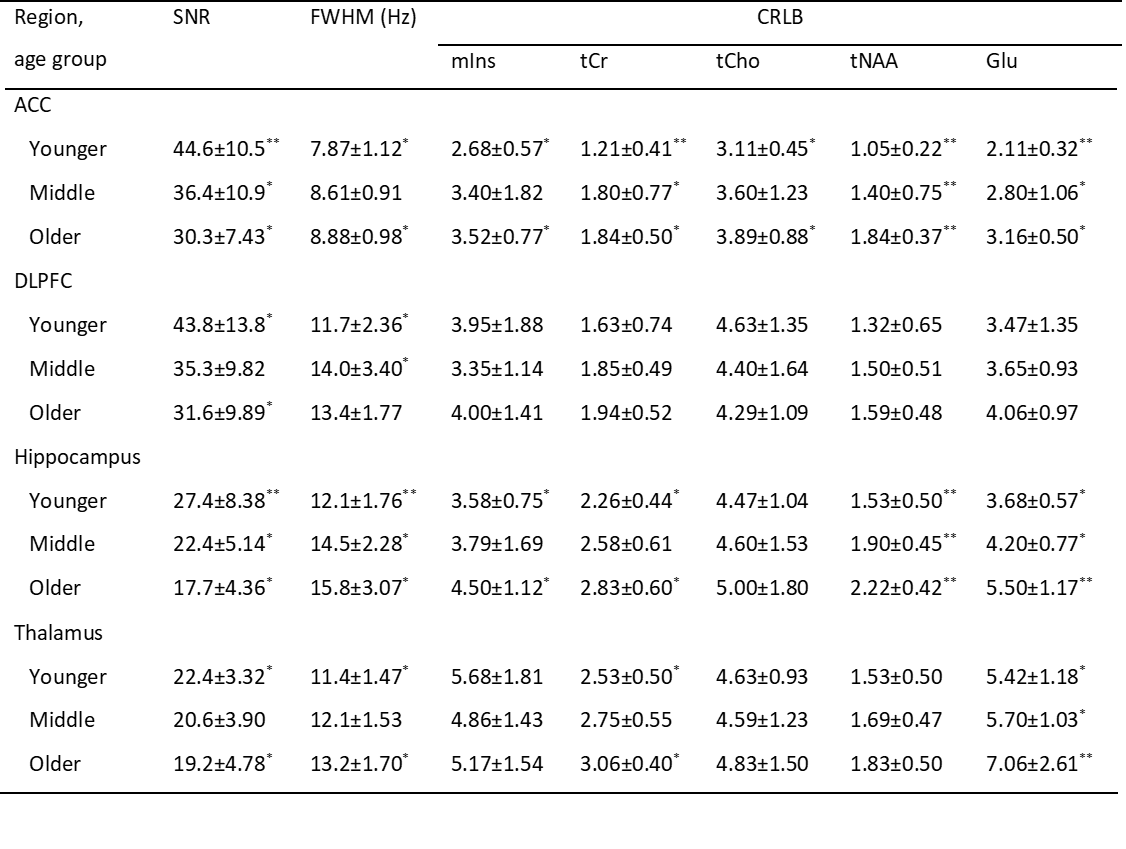
Table 1: Quality variables for the 1H-MRS measurements reported as mean ± SD.
Note: Age groups that are pairwise significantly different (p<0.05) are marked with ** if different from both other groups and * if different from one other group. SNR: signal to noise ratio, linewidth (FWHM) CRLB: Cramér-Rao lower bound, mIns: myo-inositol, tCr: total creatine (Cr+PCr), tCho: total choline (GPC+PCh), tNAA: total N-acetyl aspartate (NAA+NAAG), Glu: glutamate.