1852
Hippocampal concentration of glutamate: A comparative study of CEST and 1HMRS measurements at 7T.
Tomohisa Okada1, Ravi Prakash Reddy Nanga2, Koji Fujimoto1, Dinh Ha Duy Thuy1, Ravinder Reddy2, Hideto Kuribayashi3, Yuta Urushibata3, Ravi Teja Seethamraju4, Sinyeob Ahn5, and Tadashi Isa1
1Kyoto University, Kyoto, Japan, 2University of Pennsylvania, Philadelphia, PA, United States, 3Siemens Healthcare K.K., Tokyo, Japan, 4Siemens Healthineers USA, Burlington, MA, United States, 5Siemens Healthineers USA, Berkeley, CA, United States
1Kyoto University, Kyoto, Japan, 2University of Pennsylvania, Philadelphia, PA, United States, 3Siemens Healthcare K.K., Tokyo, Japan, 4Siemens Healthineers USA, Burlington, MA, United States, 5Siemens Healthineers USA, Berkeley, CA, United States
Synopsis
Chemical exchange saturation transfer of the glutamate (GluCEST) contrast is considered from glutamate to be about 70 - 75 %. Its values at the bilateral hippocampus were compared to those of 1HMRS in 10 healthy subjects. Correlation between GluCEST contrast and glutamate from 1HMRS measurements of all subjects was marginally significant (r = 0.44, p = 0.054), but it was statistically significant (r = 0.56, p = 0.030) when analysis was limited to 1HMRS measurements with SNR ≥ 10. The GluCEST map gives regional difference in glutamate concentration in high resolution and is expected to facilitate investigation of the hippocampus.
INTRODUCTION
Glutamate is the main excitatory neurotransmitter in the brain that is altered in many brain disorders. Proton magnetic resonance spectroscopy (1HMRS) can detect glutamate peaks at 2.35 ppm and other metabolites and quantify their concentrations, but information on the distribution is limited even when 2D/3D acquisition is applicable, because of a long scan time and low spatial resolution. Chemical exchange saturation transfer (CEST) is another method that is sensitive to various brain metabolites1,2 inclusive of glutamate (GluCEST)3, which provides markedly higher spatial resolution and sensitivity when compared with 1HMRS. This relatively new method has been successfully applied to hippocampus to detect epileptogenic side of the hippocampus4. About 70-75% of GluCEST contrast is considered from glutamate, but confirmation based on a comparison between GluCEST and 1HMRS of the glutamate is limited. The purpose of this study was to make additional confirmation on the relationship between GluCEST contrast and glutamate amount observed by 1HMRS.METHODS
Ten healthy volunteers (7 males and 3 females, mean age 22.7 years, aged 21 - 26 years), who had no known history of neuropsychiatric disorders or substance abuse, were enrolled with written informed consent under an IRB-approved protocol. Scans were conducted on a 7T whole-body scanner (70 mT/m maximum amplitude, 200 mT/m/ms maximum slew rate; Siemens, Erlangen, Germany) using a single-transmit volume coil and a 32-channel receiver head coil (Nova Medical, MA, USA). Dielectric pads of CaTiO3 suspension in D2O (40% v/v) was placed at bitemporal areas5. After a sagittal T2-weighted imaging to localize the bilateral hippocampus, additional T2-weighted imaging was conducted para-axial to the bilateral hippocampus. A single-slice 2D GluCEST imaging (Siemens prototype sequence: gradient-echo readout, TR/TE = 6.2/3 ms, flip angle (FA) = 10°, shot TR = 10 s, shots-per-slice = 2, averages = 1, field-of-view = 200×169 mm, in-plane resolution = 0.78 mm × 0.78 mm, slice thickness = 10 mm), prepared with an 800 ms saturation pulse train at a B1rms of 3.06 µT, was conducted on the bi-hippocampal plane at varying saturation offset frequencies from ±1.8 to ±4.2 ppm (relative to water resonance) with a step size of ±0.3 ppm (scan time 6 min). Gradient-echo images were collected at two echo times (TR/TE1/2 = 300/4.24/5.26 ms, FA = 30°) for a B0 map and flip angles of 30° and 60° for a B1 map (TR/TE = 6.2/3 ms). 1HMRS measurements were conducted separately for right and left hippocampus using a short-TE STEAM sequence (Siemens prototype sequence: TR/TE/TM = 4000/5/45 ms, spectral width = 6kHz, data points = 2048, averages = 48, scan time = 3min:48sec) for a voxel of 30×18×10 mm3 placed on the GluCEST imaging plane. FASTMAP shimming (Siemens prototype sequence) and additional manual shimming were conducted. Water unsuppressed spectra were also acquired for eddy-current correction and quantitation (mmol/L, institutional values). GluCEST image processing and analysis were conducted with in-house programs. CEST images in a saturation range of ±1.8 - 4.2 ppm were interpolated (cubic spline) to images with a step size of 0.01 ppm. B0-corrected CEST images saturated at ±3 ppm were generated to derive GluCEST map that shows percent asymmetry calculated as 100 × (signal@-3ppm – signal@+3ppm) / signal@-3ppm. Artifacts from B1 inhomogeneity in GluCEST maps were removed using B1 calibration curves6. The B0-and B1-corrected GluCEST maps were then averaged within rectangular regions-of-interest placed separately at bilateral hippocampi. For 1HMRS, spectral and signal-to-noise (SNR) analysis was carried out using LCModel (version 6.3-1L)7. Correlation analysis was conducted between GluCEST and 1HMRS measurements. Subgroup analysis was also conducted for 1HMRS measurements with SNR ≥ 10 for a higher measurement reliability.RESULTS
Measurement results of all subjects are summarized in Table 1, and a representative GluCEST image and 1HMR spectra are presented in Figure 1. In MRS, Cramér-Rao lower bound (CRLB) of the glutamate were 4 to 9 %. SNR was 7 to 19 and for 5 measurements SNR was < 10. The correlation between GluCEST maps and glutamate from 1HMRS measurements of all subjects was marginally significant (r = 0.44, p = 0.054). When the analysis was limited to 1HMRS measurements with SNR ≥ 10, the correlation was statistically significant (r = 0.56, p = 0.030; See Figure 2).DISCUSSION
The majority of GluCEST contrast is from glutamate, and this study confirmed significant correlation to glutamate concentration observed by 1HMRS, when low SNR measurements of 1HMRS were excluded because of difficulty in MRS measurement at the hippocampus. The measured glutamate concentration by 1HMRS was lower in this study compared to former studies3,4. In 1HMRS, a relatively large voxel is placed, and partial volume effect may affect the results. 2D-MRS imaging may decrease this effect, but 2D-MRS measurement at the hippocampus in a good shimming condition is highly difficult. The GluCEST map gives regional difference in glutamate concentration in high resolution and is expected to facilitate investigation of the hippocampus as one of the most important brain structures for pathological conditions including Alzheimer’s disease.CONCLUSION
Significant correlation between GluCEST maps and glutamate from 1HMRS measurements was confirmed in this study. This result will further promote employment of GluCEST for investigation of the hippocampus.Acknowledgements
This project was supported by NIBIB of NIH (award number P41EB015893), NINDS of NIH (R01NS087516) and a research grant of Siemens Healthcare K.K.References
1. Cai, K. et al. CEST signal at 2 ppm (CEST@2ppm) from Z‐spectral fitting correlates with creatine distribution in brain tumor. NMR in Biomedicine 28, 1–8 (2015). 2. DeBrosse, C. et al. Lactate Chemical Exchange Saturation Transfer (LATEST) Imaging in vivo: A Biomarker for LDH Activity. Scientific Reports 6, 19517 (2016). 3. Cai, K. et al. Magnetic resonance imaging of glutamate. Nat Med 18, 302 (2012). 4. Davis, K. et al. Glutamate imaging (GluCEST) lateralizes epileptic foci in nonlesional temporal lobe epilepsy. Science translational medicine 7, 309ra161 (2015). 5. Teeuwisse, W. M., Brink, W. M. & Webb, A. G. Quantitative assessment of the effects of high‐permittivity pads in 7 Tesla MRI of the brain. Magnetic Resonance in Medicine 67, 1285–1293 (2012). 6. Singh, A., Cai, K., Haris, M., Hariharan, H. & Reddy, R. On B1 inhomogeneity correction of in vivo human brain glutamate chemical exchange saturation transfer contrast at 7T. Magnet Reson Med 69, 818–824 (2013). 7. Provencher, S. Estimation of metabolite concentrations from localized in vivo proton NMR spectra. Magnetic resonance in medicine 30, 672–9 (1993).Figures
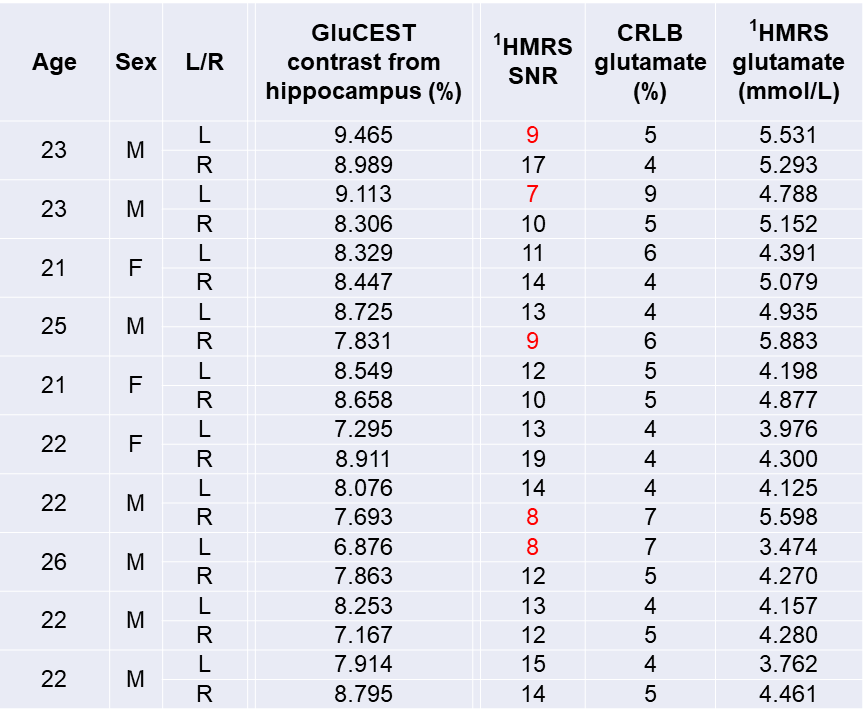
Table 1. Results of all subject. MRS measurements with SNR < 10 are indicated in red.
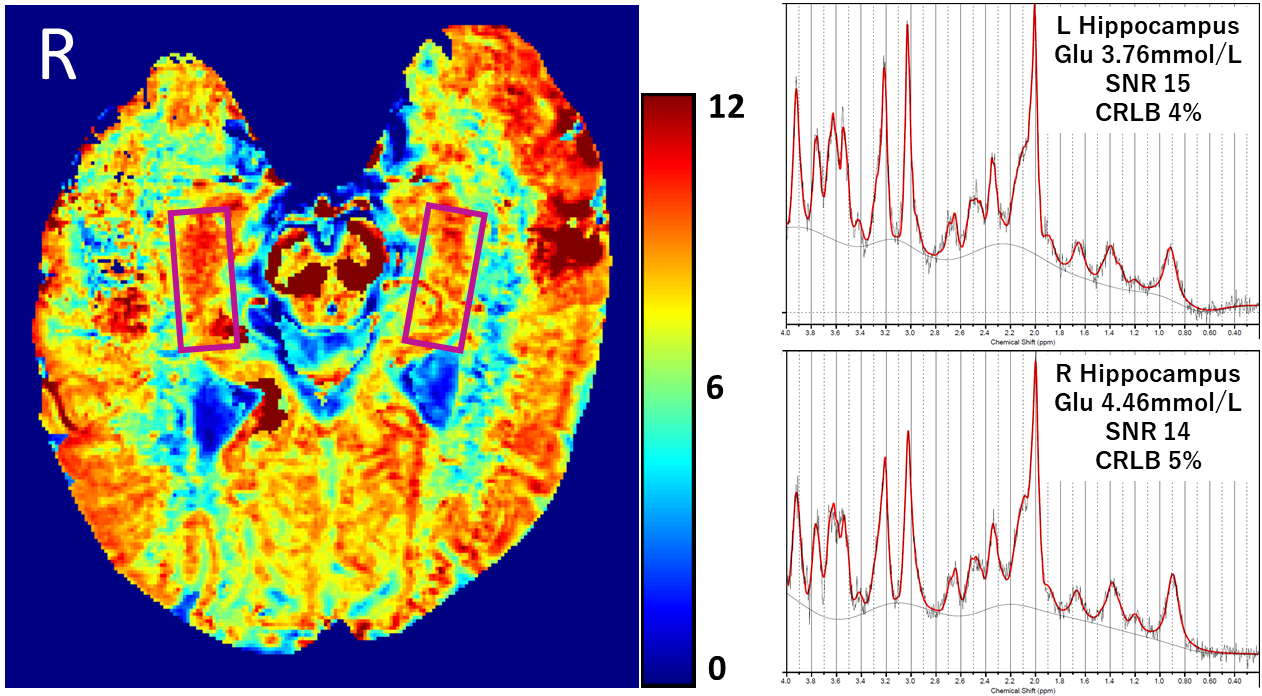
Figure 1. A representative case. ROIs are indicated with magenta boxes.
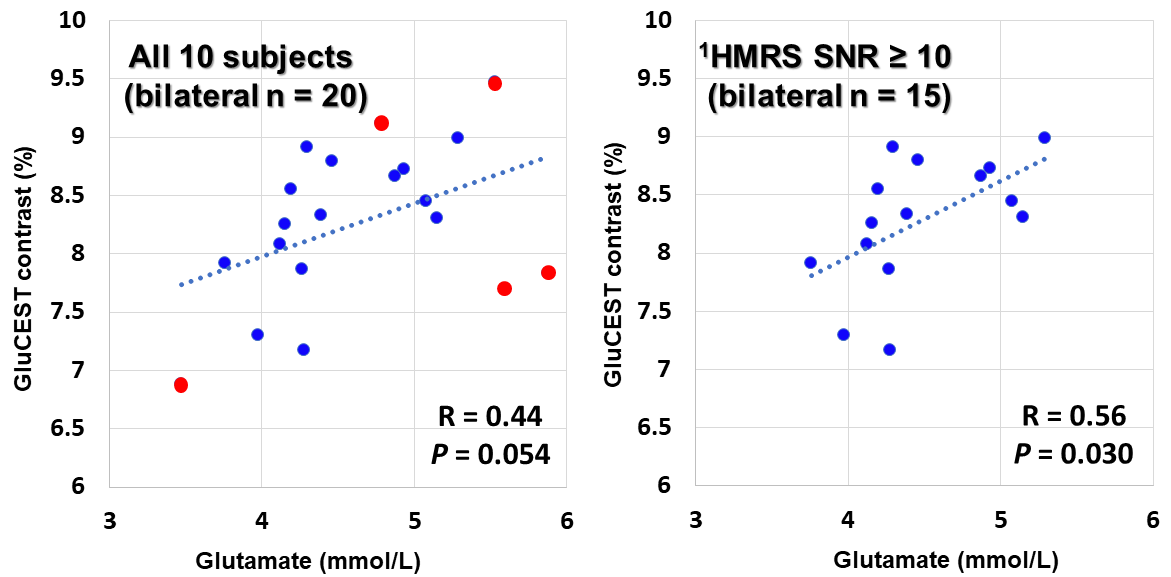
Figure 2. Glutamate CEST (y-axis) vs. 1HMRS (x-axis). MRS measurements with SNR < 10 are indicated in red. Statistically significant correlation was observed when MRS measurements were limited to SNR ≥ 10 (n = 15).