1850
Cross sectional evaluation of neurometabolic alterations in RRMS with fingolimod and injectable treatments using advanced MRS1School of Health Sciences, University of Newcastle, Newcastle, Australia, 2Hunter Medical Research Institute (HMRI), Newcastle, Australia, 3School of Medicine and Public Health, University of Newcastle, Newcastle, Australia, 4Department of Neurology, John Hunter Hospital, Newcastle, Australia
Synopsis
This novel study evaluated the amount of axonal injury with neurometabolite in RRMS patients on fingolimod(N=52) and injectable(N=46) treatments compared with 51 HCs in hippocampus using advanced MRS. PRESS-MRS of the hippocampal voxel(30x15x15mm3) and clinical assessments for RRMS and HCs were acquired. Hippocampal MR-spectra were analysed by LCModel. Hippocampal-NAA/tCr decreased (fingolimod:-17%,p=0.001;injectables:-15%,p=0.01) and in Glx/tCr increased (fingolimod:+16%,p=0.001;injectables:+15%,p=0.02) in RRMS compared to HCs. Total-ARCS (r=0.402) and memory in particular (r=0.428) displayed associations with hippocampal NAA/tCr. This study is the first cross-sectional in-vivo investigation comparing the impact of fingolimod and injectable treatments on the hippocampal metabolism in RRMS patients.
Background
MRI has a prominent role in the diagnosis and clinical management of MS pathology 1,2. However, disease in the normal-appearing brain tissue is undetectable with routine imaging. Therapeutic trials using MRI have demonstrated the efficacy of many disease-modifying treatments (DMT) including injectable glatiramer acetate (GA), interferon (IFN-b) and fingolimod in relapse-remitting MS (RRMS) in reducing MRI-detected disease activity3,4. Advanced MRI techniques of proton magnetic resonance spectroscopy (H-MRS) enables monitoring metabolic alterations in relatively small volumes of interest and can diagnose MS pathological processes in different tissue types, for example, MS lesions and normal-appearing white matter (NAWM). However, few studies have used H-MRS to monitor the response to DMTs in RRMS to assess if immunomodulatory therapies can reverse or prevent the progression of neuronal injury 5-7. H-MRS,has never been used to assess cross-sectional and longitudinal effects of fingolimod and to compare efficacy over time. In this study, we used H-MRS to evaluate the amount of axonal injury and brain metabolites in RRMS patients on DMTs with a different mode of action; fingolimod and injectables (INJ). These were compared to healthy controls (HCs) in a cross-sectional evaluation in hippocampus region. We also explored if hippocampal neurometabolic changes in RRMS were associated with severity of clinical symptoms.Materials and Methods
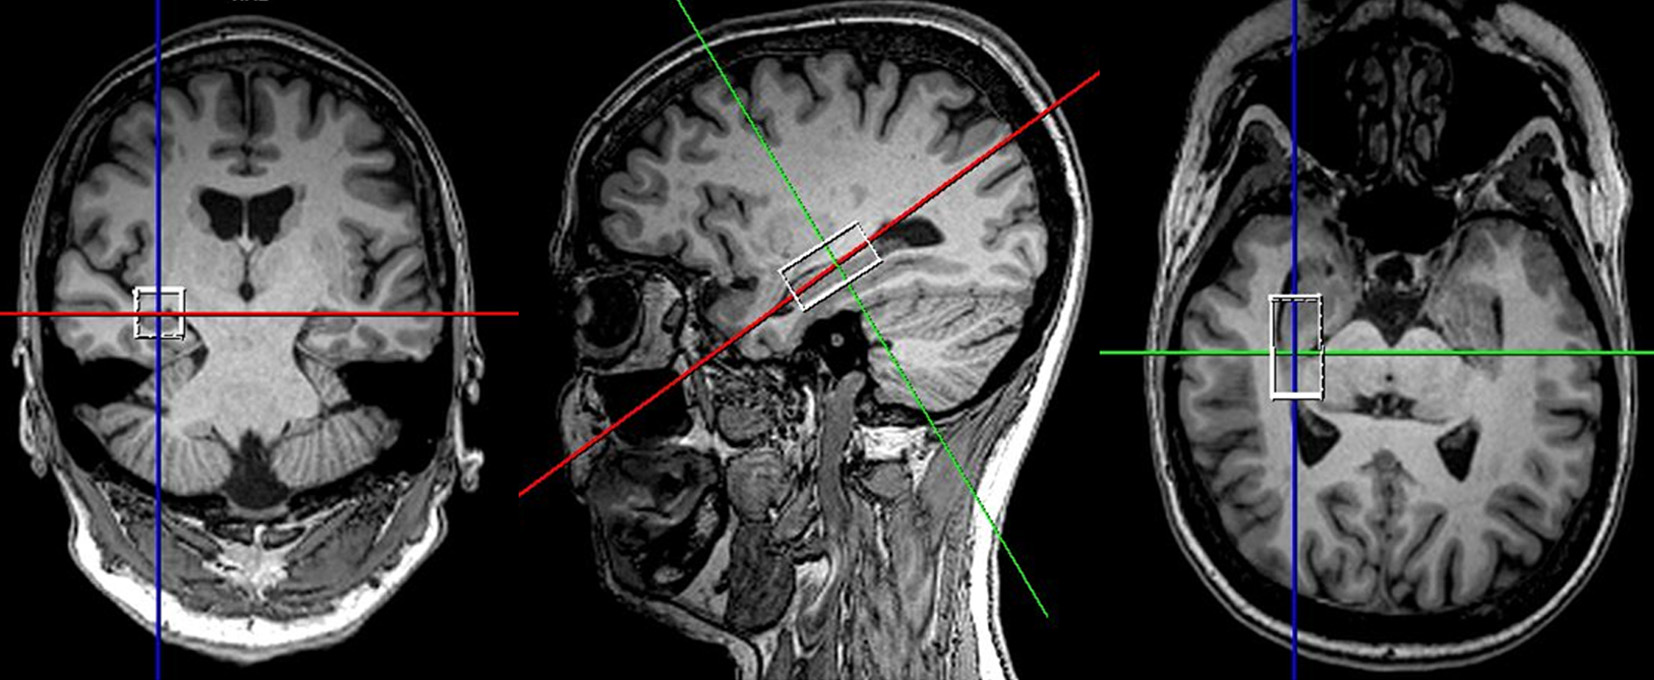
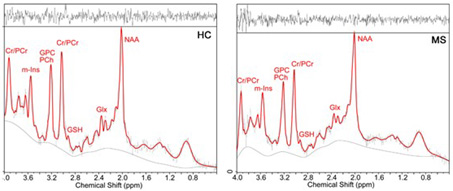
RRMS patients aged between 20 to 55 years, who have been on fingolimod (N=52) or injectables (IFN-b or GA, N=46) for a minimum of six months were included in this study. HCs (N=51) were age and sex-matched to the RRMS cohort. All MRI/MRS were undertaken on a 3T MRI Prisma scanner equipped with a 64 channel coil at the Hunter Medical Research Institute, Australia. Isotropic T1-MPRAGE (TR/TE/TI=2000/3.5/1100 ms, FOV: 256x256 mm, voxel size: 1mm3) as well as 3D T2-FLAIR (TR/TE/TI=5000/386/1800ms) were acquired. H-MRS of the hippocampus was acquired using a Point RESolved Spectroscopy (PRESS) sequence acquired from hippocampal region as shown in Figure 1.The following parameters were used: TR/TE=2000/30ms, voxel size =30x15x15 mm3, averages= 96, RF offset frequency =3.2 ppm and water suppression was enabled. All study participants (RRMS and HCs) were clinically assessed for Audio Recorded Cognitive Screen (ARCS), Depression Anxiety Stress Scales (DASS-21), Symbol Digit Modalities Test (SDMT), Modified Fatigue Impact Scale (MFIS) and Expanded Disability Status Scale (EDSS). SPM 8 was used to segment the spectroscopic voxel into CSF, grey matter (GM), white matter (WM). Lesions within the MRS voxel were segmented using the lesion growth algorithm described by Quadrelli et al.9 Total brain volume, including, peripheral grey matter and ventricular CSF volumes were calculated with partial volume estimation in FSL FAST 10. Single voxel H-MRS was analysed with LCModel using a basis set specifically designed for 3T and TE=30ms with water normalization. Sample of in-vivo hippocampal MR spectra analysed by LCModel is shown in Figure 2. To investigate the significant difference between MS and HCs groups, T-tests were applied using SPSS. The level of significant metabolic changes associated with the treatment groups was assessed using General Linear Model followed by post hoc testing using LSD. Correlation between clinical symptoms and metabolite levels was performed using Spearman’s rho.Results
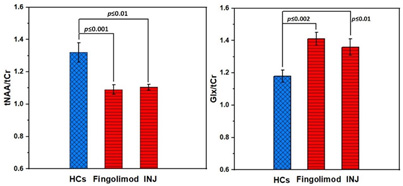
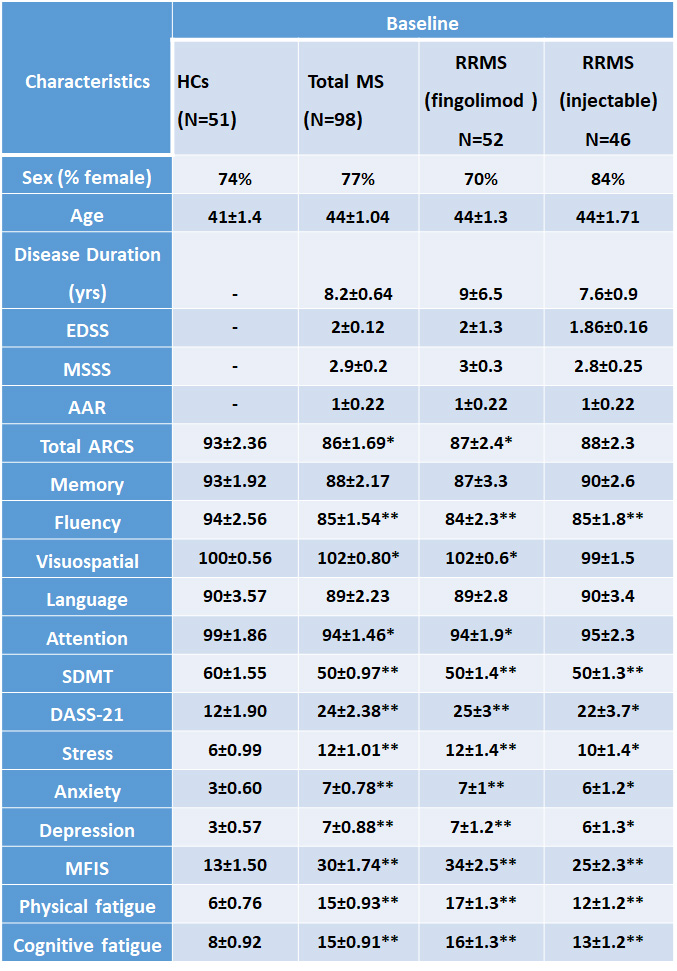
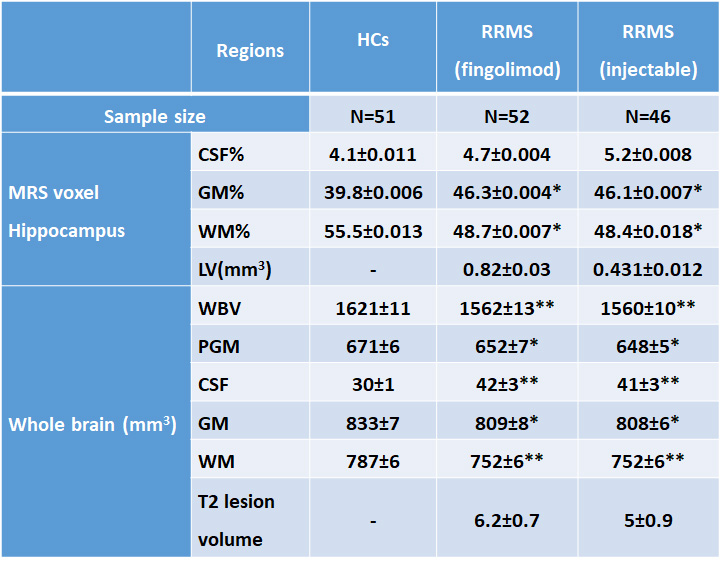
Demographic and clinical parameters of study cohorts are shown in Table 1. Using single voxel H-MRS, cross-sectional analysis identified a statistically significant reduction in hippocampal N-acetylaspartate/tCr (NAA/tCr) (fingolimod: -17%, p=0.001; injectables: -15%, p=0.01) and increase in glutamine+glutamate(Glx/tCr) (fingolimod: +16%, p=0.001; injectables: +15%, p=0.02) in RRMS at baseline, compared to HCs (Figure 3). There was a positive correlation between the levels of hippocampal myo-inositol (m-Ins) with the overall severity of mood symptoms (DASS-21, r=0.364) and depression (r=0.368). Cognitive domains evaluated by total ARCS (r=0.402) and memory in particular (r=0.428) displayed associations with hippocampal NAA/tCr only at baseline. Other hippocampal neurometabolic levels total choline (tCho) and glycerophosphocholine (GPC) were positively correlated with total brain and grey matter volumes. Spectroscopic voxel segmentation of hippocampal region and volume of brain fractions for RRMS patients compared to age and sex-matched HCs at baseline are shown in Table 2.Discussion
Using H-MRS techniques, we observed a significantly less NAA/tCr and more in Glx/tCr levels in hippocampus in both fingolimod and injectable treatment groups, in comparison to age and sex-matched healthy controls in the cross-sectional analyses. We confirmed the importance of NAA and m-Ins as indicators of axonal loss and gliosis 11-13. The clinical symptoms that showed the best associations with hippocampal metabolite levels in our RRMS (fingolimod group) were related to mood status and cognitive domains. Our results are consistent with a previous study11 that showed that decreasing NAA correlated with cognitive dysfunction.Conclusions
The current study is the first cross-sectional in-vivo investigation comparing the impact of fingolimod, interferon or GA treatment on the hippocampal metabolism in RRMS patients. Longitudinal studies are required to further clarify metabolic differences over time, and to determine an association between hippocampal metabolic levels and treatment efficacy. However, our findings suggest that H-MRS of brain metabolites in this region yields more sensitive markers than morphological changes.Acknowledgements
Funding for this study provided by Novartis Pharmaceuticals Australia. The authors thank the patients and controls who participated in this study and the Imaging Centre of the University of Newcastle and Hunter Medical Research Institute.References
1. Filippi M, Agosta F. Imaging biomarkers in multiple sclerosis. Journal of magnetic resonance imaging : JMRI 2010;31(4):770-788.
2. Traboulsee A, Simon JH, Stone L, et al. Revised Recommendations of the Consortium of MS Centers Task Force for a Standardized MRI Protocol and Clinical Guidelines for the Diagnosis and Follow-Up of Multiple Sclerosis. AJNR American journal of neuroradiology 2016;37(3):394-401.
3. Simpson D, Noble S, Perry C. Glatiramer Acetate. CNS Drugs 2002;16(12):825-850.
4. Hutchinson M. Natalizumab: A new treatment for relapsing remitting multiple sclerosis. Ther Clin Risk Manag 2007;3(2):259-268.
5. Sarchielli P, Presciutti O, Tarducci R, et al. 1H-MRS in patients with multiple sclerosis undergoing treatment with interferon beta-1a: results of a preliminary study. Journal of neurology, neurosurgery, and psychiatry 1998;64(2):204-212. 6. Toprak MK, Cakir B, Ulu EM, et al. The effects of interferon beta-1a on proton MR spectroscopic imaging in patients with multiple sclerosis, a controlled study, preliminary results. The International journal of neuroscience 2008;118(12):1645-1658.
7. Narayanan S, De Stefano N, Francis GS, et al. Axonal metabolic recovery in multiple sclerosis patients treated with interferon beta-1b. Journal of neurology 2001;248(11):979-986.
8. Ashburner J, Barnes G, Chen C , et al. SPM12 2015. 9. Quadrelli S, Mountford C, Ramadan S. Hitchhiker's Guide to Voxel Segmentation for Partial Volume Correction of In Vivo Magnetic Resonance Spectroscopy. Magn Reson Insights 2016;9:1-8. 10. Smith SM, Jenkinson M, Woolrich MW, et al. Advances in functional and structural MR image analysis and implementation as FSL. NeuroImage 2004;23 Suppl 1:S208-219.
11. Rovira À, Alonso J. 1H Magnetic Resonance Spectroscopy in Multiple Sclerosis and Related Disorders. Neuroimaging Clinics 2013;23(3):459-474.
12. Narayana PA. Magnetic resonance spectroscopy in the monitoring of multiple sclerosis. Journal of neuroimaging : official journal of the American Society of Neuroimaging 2005;15(4 Suppl):46S-57S.
13. Chard DT, Griffin CM, McLean MA, et al. Brain metabolite changes in cortical grey and normal-appearing white matter in clinically early relapsing-remitting multiple sclerosis. Brain : a journal of neurology 2002;125(Pt 10):2342-2352.
Figures