1843
Definition of Brainstem Nuclei: Ventral Tegmental Area (VTA) and Dorsal Raphe Nucleus (DRN)
Anna Crawford1, Stephen Jones1, and Mark Lowe1
1Imaging Institute, Cleveland Clinic Foundation, Cleveland, OH, United States
1Imaging Institute, Cleveland Clinic Foundation, Cleveland, OH, United States
Synopsis
Many advanced imaging application require the identification of seed and target ROIs. Due to size, and signal characteristics some brain structures including brainstem nuclei are difficult to identify with MR imaging, while other types of imaging such as PET have other drawbacks such as poor spatial resolution. We have come up with a “recipe” for defining the ventral tegmental area (VTA) as well as the dorsal raphe nucleus (DRN) using three anatomic atlases. The definition of these ROIs were confirmed with PET imaging. Our method allows for robust, reproducible ROIs using only a high resolution T1 weighted image.
Introduction
Many cutting edge applications of advanced imaging, such as resting state connectivity and HARDI connectivity, necessarily require identification of seed and target ROIs. While larger brain structures, such as the sensorimotor cortex can be reliably identified in most humans using MRI, smaller structures such as dopaminergic and serotonergic nuclei are more difficult to identify, both due to their small size, and signal characteristics that are similar to adjacent brain tissue. Another alternative is using nuclear medicine tracers to identify these small foci, but the drawback is relatively poorer spatial resolution of PET systems, and the subsequent need to co-register the two modalities. Therefore, there is great utility is providing well-defined “recipes” on how to locate these small nuclei in conventional MRI. We present here two such methods for identification of the ventral tegmental area (VTA) and dorsal raphe nucleus (DRN) of the brainstem.Methods
A gold standard for locating the VTA and DRN was based on three anatomic atlases: Olszewski and Baxter's Cytoartchitecture of the Human Brainstem 2014, Paxinos and Huang's Atlas of the Human Brainstem 1995, and Duvernoy's Atlas of the Human Brain Stem and Cerebellum 2009. Both nuclei were drawn for each atlas. Using a grid of 1mmx1mm for each available slice, the nuclei were filled in if at least half of the grid block was full. Then the 3 atlases were merged together to form the DRN and VTA. This merged version was then 'smoothed' such that the nuclei as a whole would have a cohesive shape and removing any extraneous pieces not in a cluster.For both nuclei, the brain volume is oriented in the plane that runs through the middle of the mammillary body and the superior colliculus. If the head is rotated left or right, this should also be corrected.
For the DRN, all parts, ie ventral, dorsal, and intrafasicular parts were included. The DRN is 8mm thick. The inferior most level is at the isthmus, where the cerebral aqueduct forms into the 4th ventricle. The DRN lies at the midline of the brainstem and should follow along the cerebral aqueduct with the cerebral aqueduct being its posterior border. See Figure 1 for diagram.
For the VTA, the paranigral, interfasicaular, central linear, parabrachial pigmented, and rostral linear nuclei were included. These nuclei were included based on their projections to the limbic area, thalamus, and forebrain as well as the midline nuclei. The VTA is 6mm thick and extends inferiorly 2mm below the inferior red nucleus, but does not cross the decussation. The superior extent is approximately aligned with the inferior mammillary body. The VTA also lies at the midline of the brainstem with the interpeduncular fossa as its anterior border. See Figure 2 for diagram.
A validation of the above recipe to localize the DRN and VTA was performed with positron emission tomography studies that were made available from a previous nuclear medicine study. [18F]-MPPF scans were used to localize DRN in MRI scans co-localized to the PET imaging data. [11C]-FeCIT scans, used to measure dopamine transporter activity, were used to localize VTA in MRI scan similarly co-localized. ROI’s for each VTA and DRN were determined using the above described methods using the co-localized MRI scans and compared for spatial overlap.
Results
Figures 1 and 2 show the anatomical delineation of the ROI’s using the prescribed method. Figures 3 and 4 show a clear overlap of DRN and VTA ROI’s defined using the landmark method described here and those determined using the relevant PET ligand studies.Discussion
We have described a straightforward, anatomic landmark based methodology to produce ROI’s in the VTA and DRN of the brainstem. The method requires only a high resolution T1 weighted scan to produce the ROI’s. The landmarks employed are all conspicuous objects readily identifiable on MRI and the method is simply described to enable even researchers that are relatively naïve to cross sectional anatomy to produce robust, reproducible ROI’s.Conclusion
Based on multiple brainstem atlases, we provide “recipes” to locate the DRN and VTA on MRI anatomical imaging. These steps are useful for connectivity analysis that require these small nuclei as endpoints.Acknowledgements
This work was supported by Siemens Healthineers, Inc. The authors gratefully acknowledge the help of Tobias Kober of Siemens Healthineers for use of WIP944 (MP2RAGE).References
- Olszewski and Baxter. Olszewski and Baxter's Cytoartchitecture of the Human Brainstem.Basel, Switzerland: Karger, 2014. pp. 18-19, 44-56, 203-206, 217-218.
- G. Paxinos and XF Huang. Atlas of the Human Brainstem. 1995 ed. San Diego, California: Academic Press, 1995. Fig 50-62.
- T.P. Naidich, H.M Duvernoy, et al. Duvernoy's Atlas of the Human Brain Stem and Cerebellum. Austria: Springer-Verlag/Wien, 2009. pp. 55, 84-89
Figures
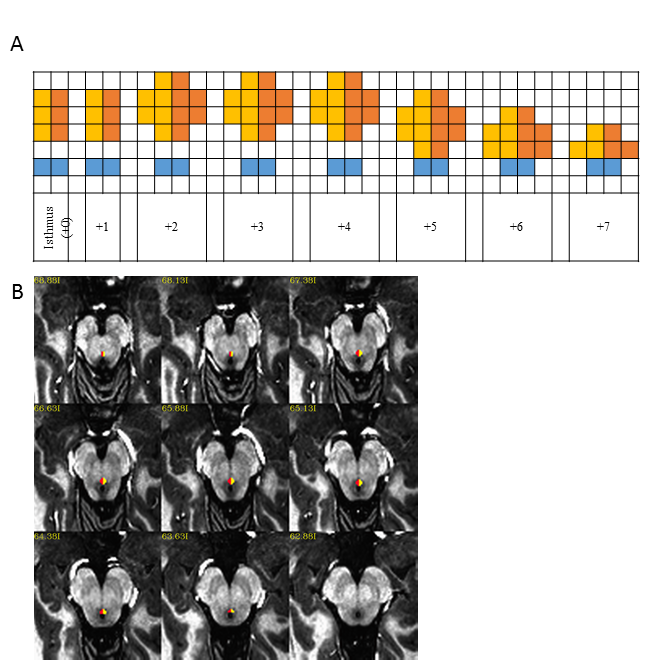
Figure 1: Definition of dorsal raphe nucleus
(DRN): A) Axial 1mm3 grid used to define DRN where yellow and orange
show left and right DRN and blue is the cerebral aqueduct, B) Example DRN
viewed on MP2RAGE axial image that is re-oriented to defined axis (Middle of
mammillary body – superior colliculus) at 0.75mm3 spacing.
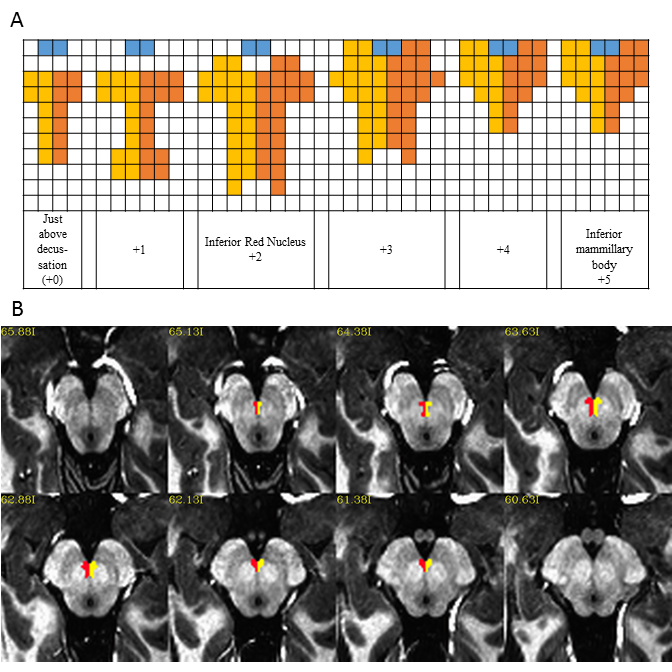
Figure 2: Definition of the ventral tegmental
area (VTA): A) Axial 1mm3 grid used to define VTA where yellow and
orange show the left and right VTA and blue is the interpeduncular fossa, B)
Example VTA viewed on MP2RAGE axial image that is re-oriented to defined axis
(Middle of mammillary body – superior colliculus) at 0.75mm3
spacing.
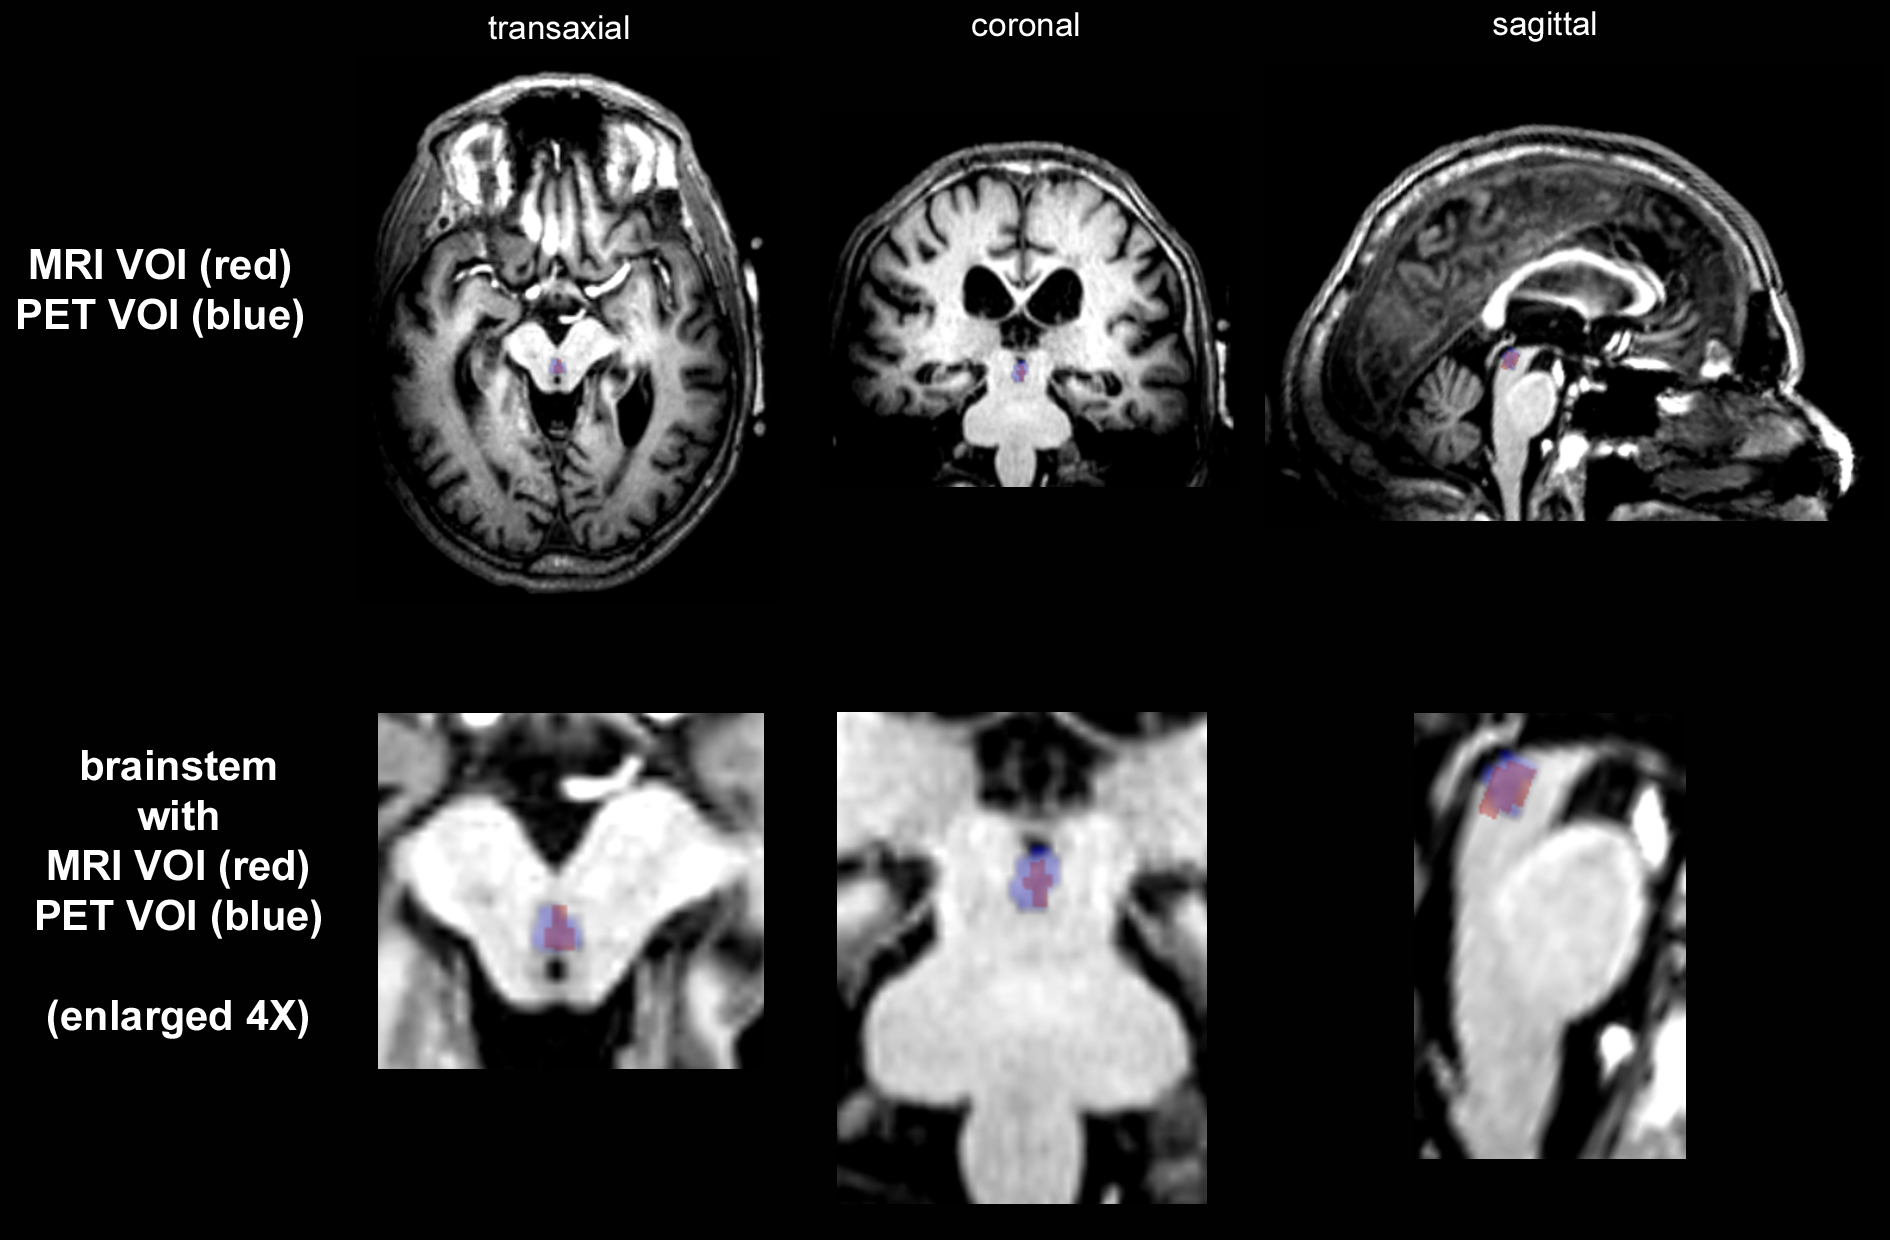
Figure 3: Overlay of DRN ROI from MRI
definition with PET determination
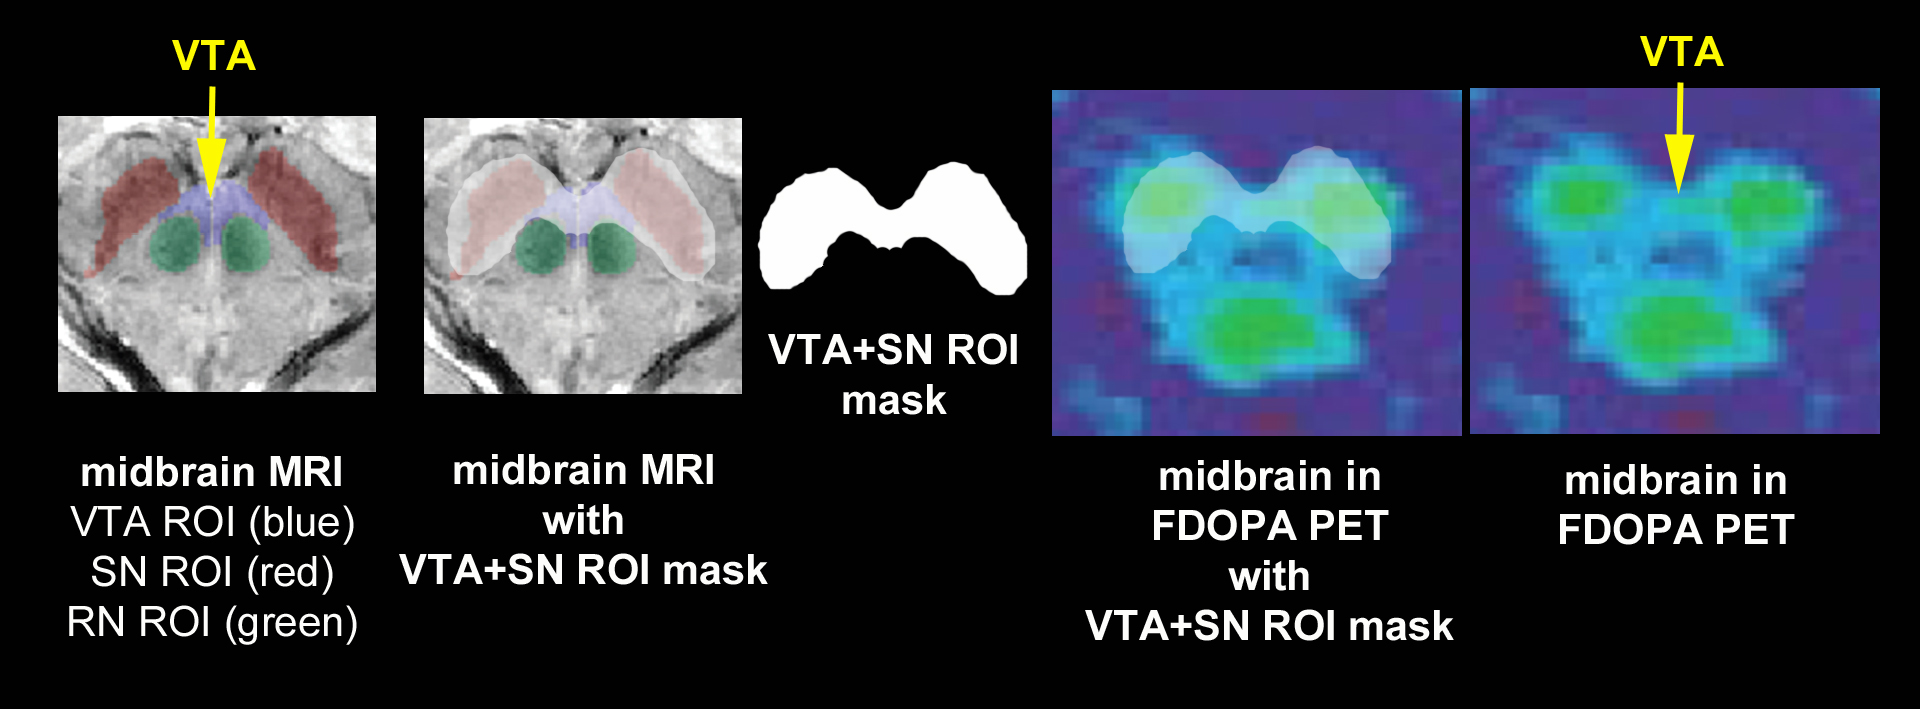
Figure 4: PET determination of VTA in same
area as defined with MRI