1842
The performance of mean-apparent-propagator diffusion model in assessing brain parenchymal microstructure changes of hypertensive patients1Department of radiology, affiliated hospital of Inner Mongolia medical university, Hohhot, China, 2MR Scientific Marketing, Shanghai, China, 3Shanghai Key Laboratory of Magnetic Resonance, Shanghai, China
Synopsis
The purpose of this study was to evaluate the value of diffusion spectrum imaging (DSI) MAP diffusion model in the changes of brain tissue microstructure in patients with primary essential hypertension, as well as the differences of various parameters including RTOP, RTAP, RTPP, QIV and MSD between the hypertensive group and the normal control group. The results showed that there were significant differences between RTOP and QIV. All the MAP-MRI parameters showed obvious differences in detecting the changes of brain structure microstructure in the early stage of hypertension, especially the RTOP and QIV parameters.
Objective
To investigate the changes of brain parenchyma microstructure in hypertensive patients using the mean-apparent-propagator (MAP)-MRI model based on the diffusion spectrum imaging (DSI) technique.Materials and methods
30 patients with hypertension who had not taken any antihypertensive drugs at the first diagnosis in our hospital were enrolled in this study, and 20 healthy subjects with matched age and gender were considered as control group. All subjects underwent routine head MRI scans, including 3D T1WI MPRAGE and DSI sequences on a 3T MR scanner (MAGNETOM Skyra, Siemens Healthcare, Erlangen, Germany). The DSI sequence parameters were as follows: TR=7000ms, TE=107mm, FOV=220*220mm, layer thickness=3.0mm, iPAT= 2, Bandwidth (Hz/Px) =2126, acquisition matrix= 98 x 98, maximum b value = 3000s /mm2. The MAP-MRI parameters were calculated using an in-house developed tool with Python, called NeuDiLab, which is based on an open-resource tool DIPY (Diffusion Imaging In Python, http://nipy.org/dipy). The MAP-MRI parameters included the return to the origin probability (RTOP), the return to the axis probability (RTAP), and the return to the plane probability (RTPP), the mean square displacement (MSD) and q-space inverse variance (QIV). The region of interest (ROI) was drawn in bilateral caudate nucleus cephalus, putamen nucleus, pallidum, thalamus, internal capsule, frontal cortex white matter, lateral ventricle posterior horn area white matter and corpus callosum pressure, and the mean values of the parameters in ROI were calculated. SPSS 20.0 software was used for statistical analysis of the measured data.Results
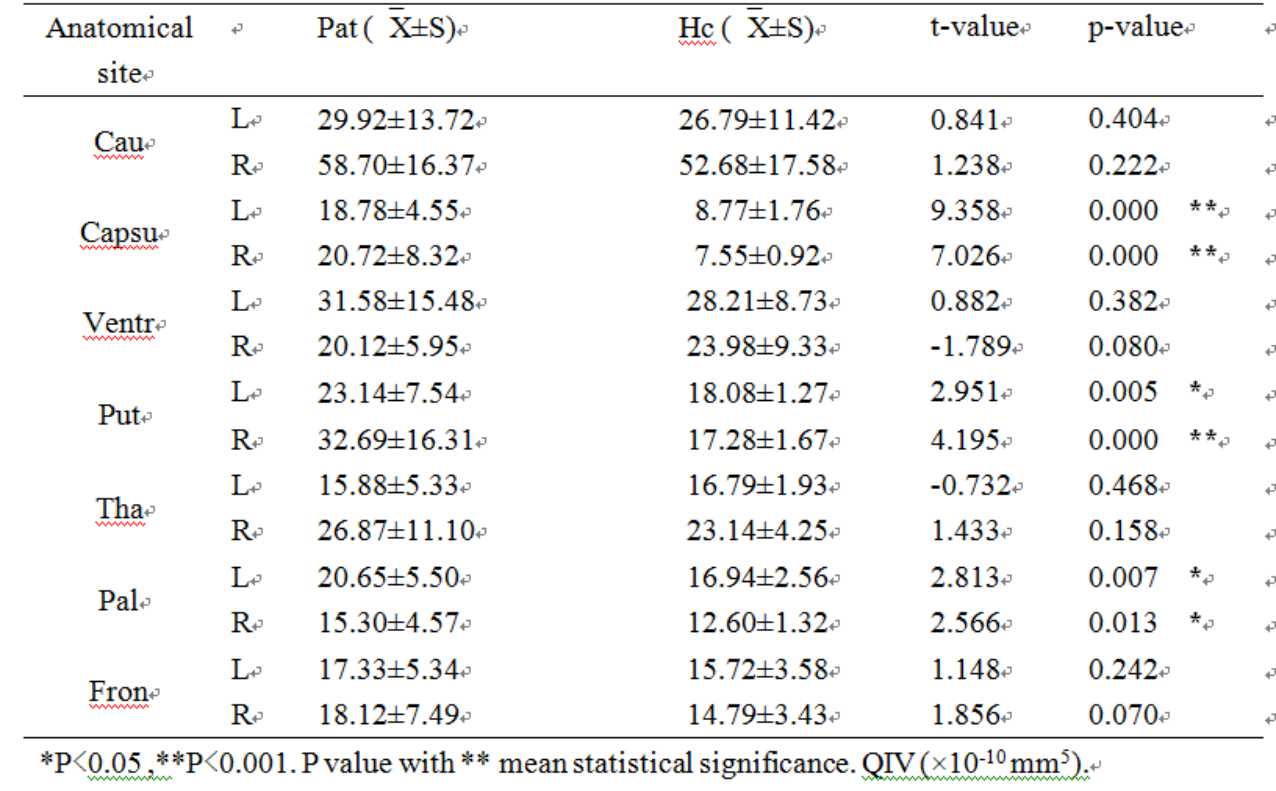
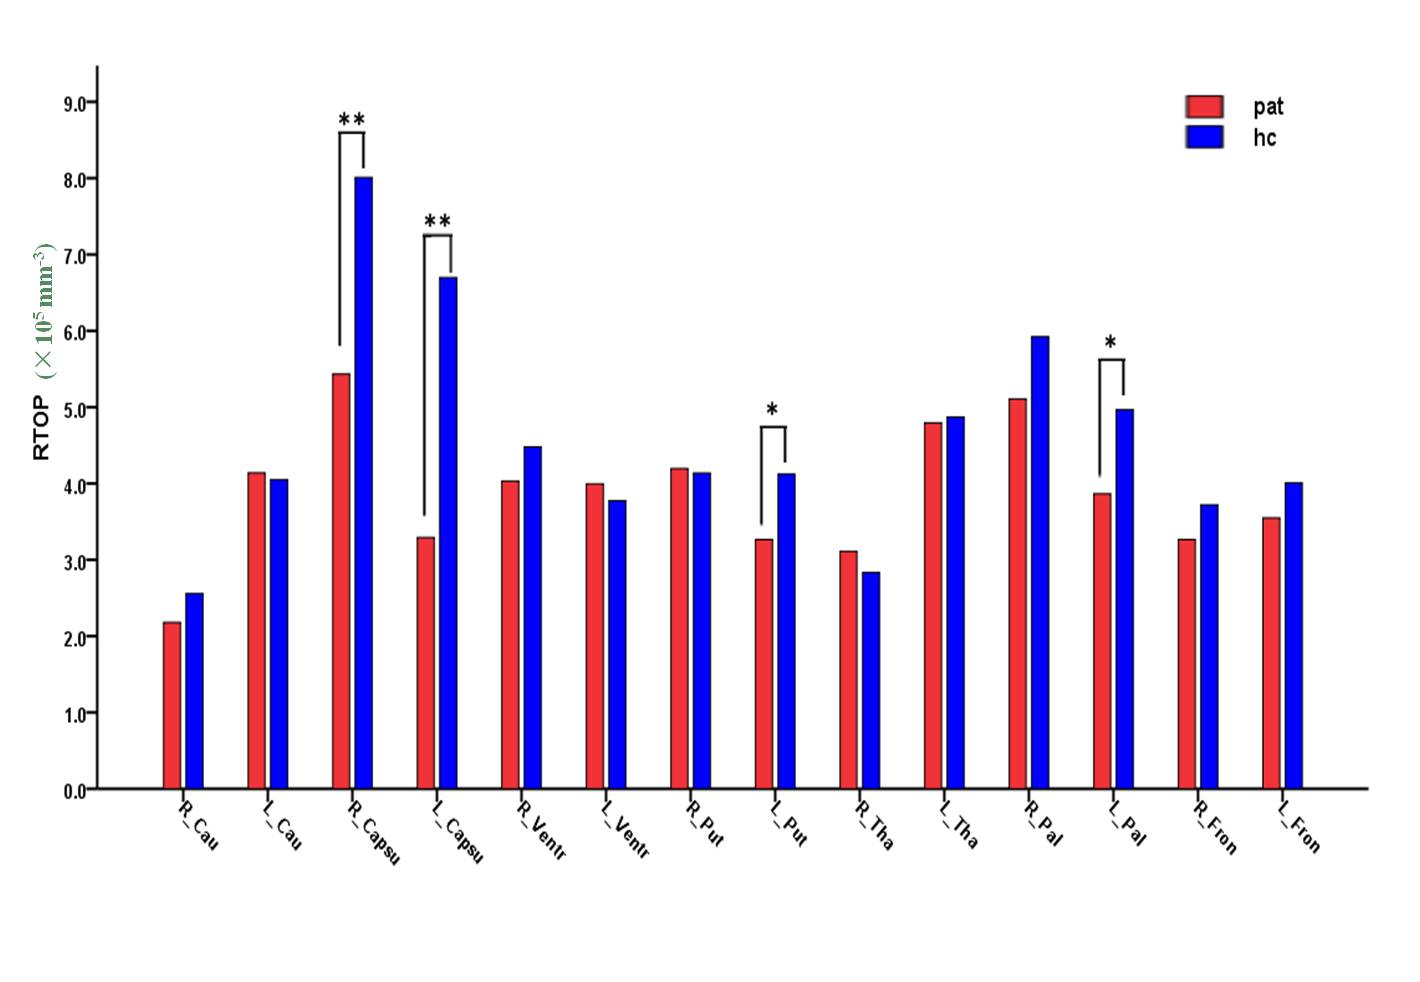
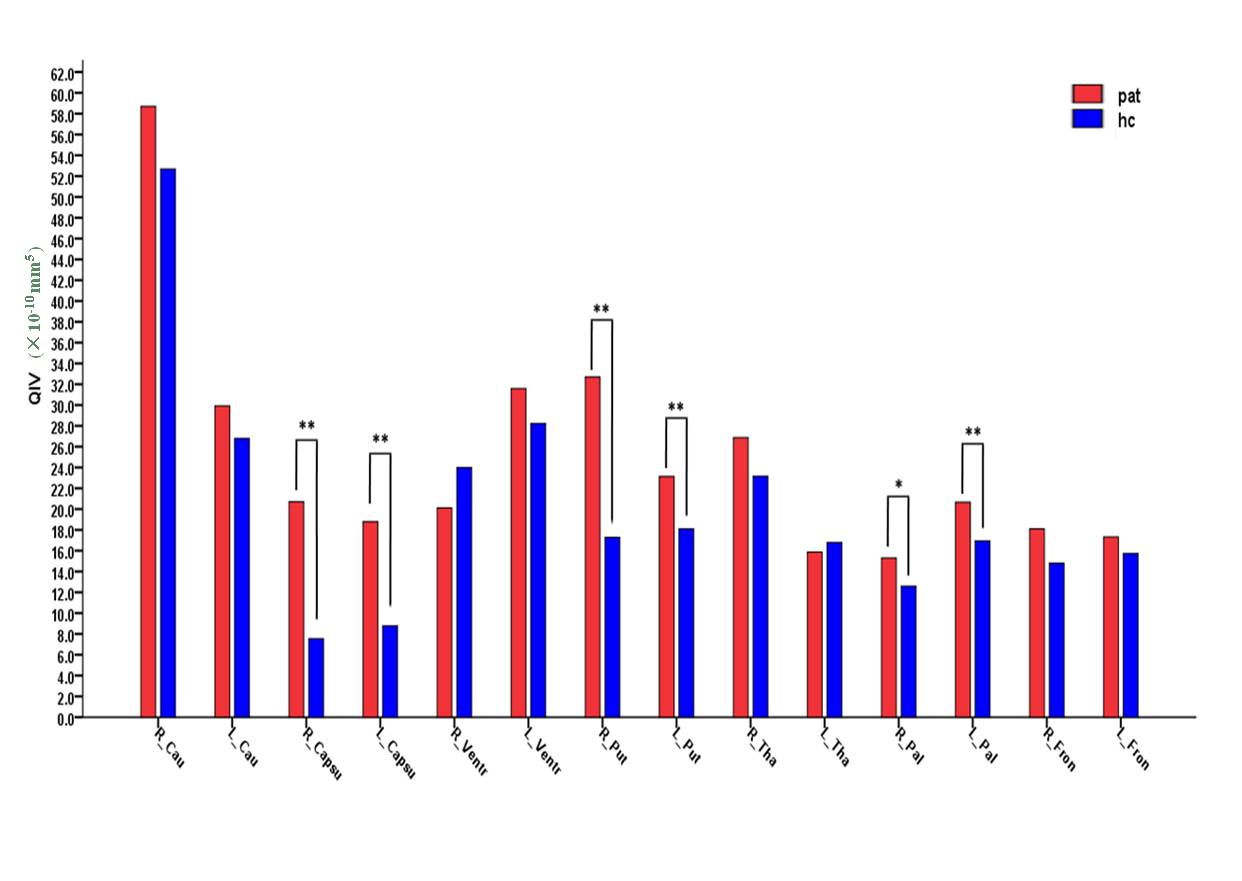
There was no significant difference in bilateral symmetry between hypertensive group and normal control group (P>0.05). The difference of RTOP, QIV and QIV in the right putamen between the two groups was statistically significant (P < 0.001). The RTOP values of the left shell nucleus and globus pallidum were statistically significant (P < 0.05). There were statistically significant differences in the QIV values of the left shell nucleus and bilateral pallidum (P < 0.05).Discussion
some scholars believe that even before cerebral hemorrhage, cerebral infarction and other craniocerebral changes that can be detected by conventional MRI, the cerebral parenchyma of hypertensive patients has changed, and the cognitive function can also decline in pre-clinical stage, causing a certain degree of brain damage and changes in brain microstructure. Due to the different components of the gray matter (white matter is mainly composed of neuronal processes covered by myelin sheath, while gray matter is mainly composed of neuronal cell bodies), its complexity is completely different, and conventional MRI cannot effectively detect changes in brain parenchymal microstructure.Conclusion
MAP-MRI parameters showed obvious differences in detecting the changes of brain structure microstructure in the early stage of hypertension, especially the RTOP and QIV parameters, which may provide an important biomarker for reflecting the etiology, pathogenesis and prognosis risk of cerebral hemorrhage in patients with hypertension.Acknowledgements
Thanks to director gao Yang of radiology department of affiliated hospital of Inner Mongolia medical university for his guidance on this subject, and thanks to Mr. Wang shaoyu of Siemens scientific research team and Mr. Yang guang of Shanghai key magnetic resonance laboratory of east China normal university for their analysis and processing of experimental data.References
1. Avram A V , Sarlls J E , Barnett A S , et al. Clinical feasibility of using mean apparent propagator (MAP) MRI to characterize brain tissue microstructure.[J]. Neuroimage, 2016, 127(3):422-434.
2. Ilaria B G , Lorenza B , Silvia O , et al. On the Viability of Diffusion MRI-Based Microstructural Biomarkers in Ischemic Stroke[J]. Frontiers in Neuroscience, 2018, 12:92-.
Figures
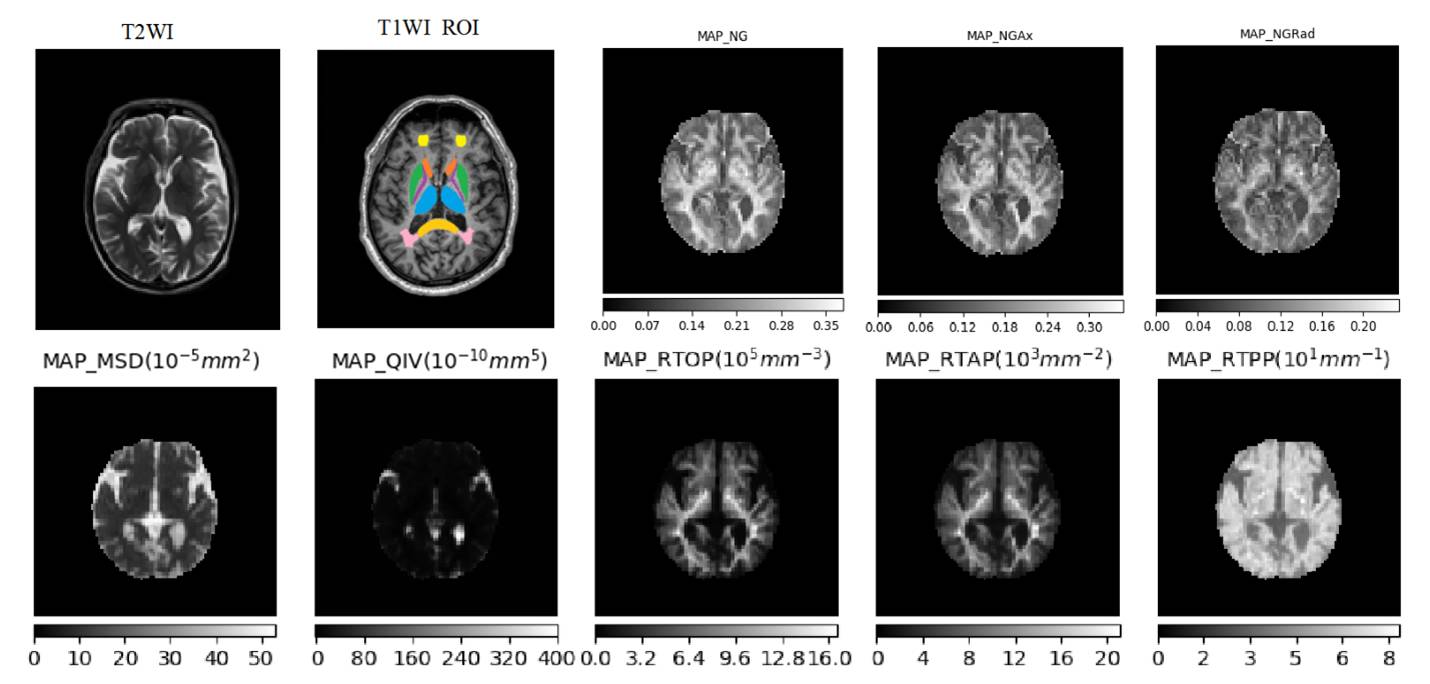
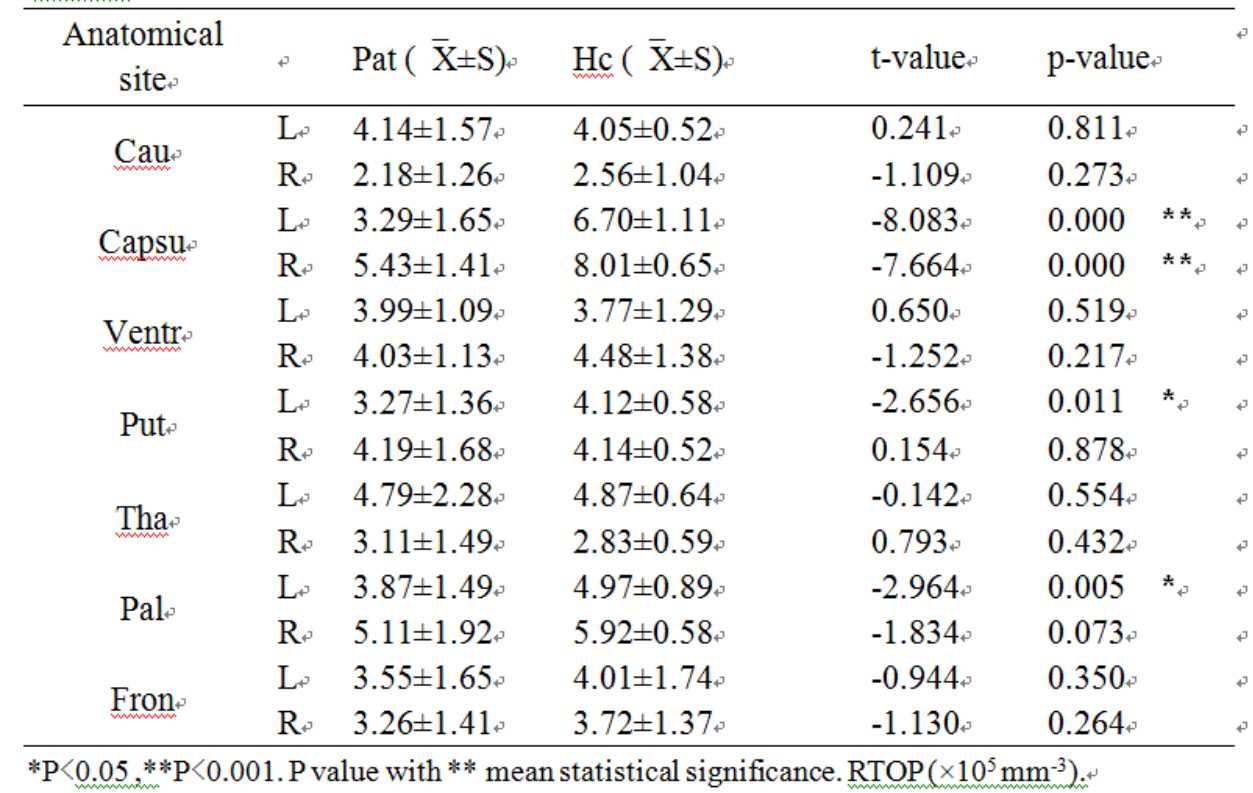
Table 1. Comparison of RTOP value of each anatomical part with that of normal control group