1841
Fluorine-19 MR Characterisation of Siponimod as MR Theranostic Approach in the Treatment of Multiple Sclerosis1Berlin Ultrahigh Field Facility (B.U.F.F.), Max Delbrück Center for Molecular Medicine in the Helmholtz Association, Berlin, Germany, 2MRI TOOLS GmbH, Berlin, Germany, 3Experimental and Clinical Research Center, a joint cooperation between the Charité Medical Faculty and the Max Delbrück Center for Molecular Medicine in the Helmholtz Association, Berlin, Germany
Synopsis
Siponimod is a trifluorinated anti-inflammatory drug indicated for Multiple Sclerosis that could be potentially tracked in pharmacokinetic studies by fluorine-19 (19F) MR techniques in order to support therapeutic monitoring. In this study, we investigated the 19F MR properties of siponimod and its dependency on environmental factors. We found a temperature dependence of the relaxation times T1 and T2 and identified a T2-drop in the presence of human serum. We identified UTE as SNR-efficient MR pulse sequence to study siponimod physiologically and show the potential of tailoring MR methods in the future to individual patient therapeutic needs.
Introduction
Siponimod is a recently FDA-approved anti-inflammatory drug indicated in the treatment of secondary progressive Multiple Sclerosis (SPMS), by retaining autoreactive lymphocytes in lymphatic tissue1. Apart from blood sampling, drug efficacy and distribution cannot be determined in clinical practice in vivo. Due to its three fluorine atoms, siponimod could be detected non-invasively and tracked in vivo by fluorine-19 (19F) MR techniques2. To identify the ideal MR pulse method and corresponding scan parameters for achieving best SNR efficiency in vivo, we characterized the 19F MR properties of siponimod in dimethylsulphoxide (DMSO) and in serum, with the latter modelling an in vivo situation where MR properties are expected to differ.Methods
Phantoms were prepared in 2ml syringes. Siponimod (Sigma) was dissolved at 57mM in DMSO (Roth) and at 9.4mM in human serum. Measurements were performed at room temperature (20°C; RT) and at 37°C, using a pre-calibrated water bath for heating phantoms. All MR experiments were performed on a 9.4T MR scanner (Bruker Biospec) using a dual-tunable 19F/1H mouse head RF coil3. Global single pulse MR spectroscopy (TR=1000ms) was used to detect the 19F signal and to make frequency adjustments. T1 and T2 were measured using MR spectroscopy. T1: a block pulse sequence with different TRs (100-10000ms). T2: CPMG sequence (TR=2000ms, 25 echos, echo spacing=10.7ms in DMSO and 2.8ms in serum). T1 mapping was performed using a saturation based RARE technique (TE=9.2ms, echo spacing=4.6ms ETL=4, FOV=16mmx16mm, matrix size=64x64, with 9 different repetition times (RARE-VTR; TR=25-8000ms). T2 mapping was performed using a multi-slice multi-echo technique (MSME; TR=2000ms, FOV=16mmx16mm, matrix size=64x64) with 25 TEs (TE=40-1000ms, increment 40ms). We optimized RARE (TR, TE, ETL)4, FLASH (Ernst angle), UTE (Ernst angle) and bSSFP (flip angle)5 sequences (FOV=28mmx28mm, matrix size=96x96, slice thickness=5mm) for comparing the SNR efficiencies (SNR/√time) for imaging siponimod in DMSO and in serum. Image processing and spectral analysis were performed in MATLAB R2018a and using ImageJ6. We calculated chemical shift, signal intensity, SNR, T1 and T2. We normalized the SNR efficiency to the highest value of each comparison.Results
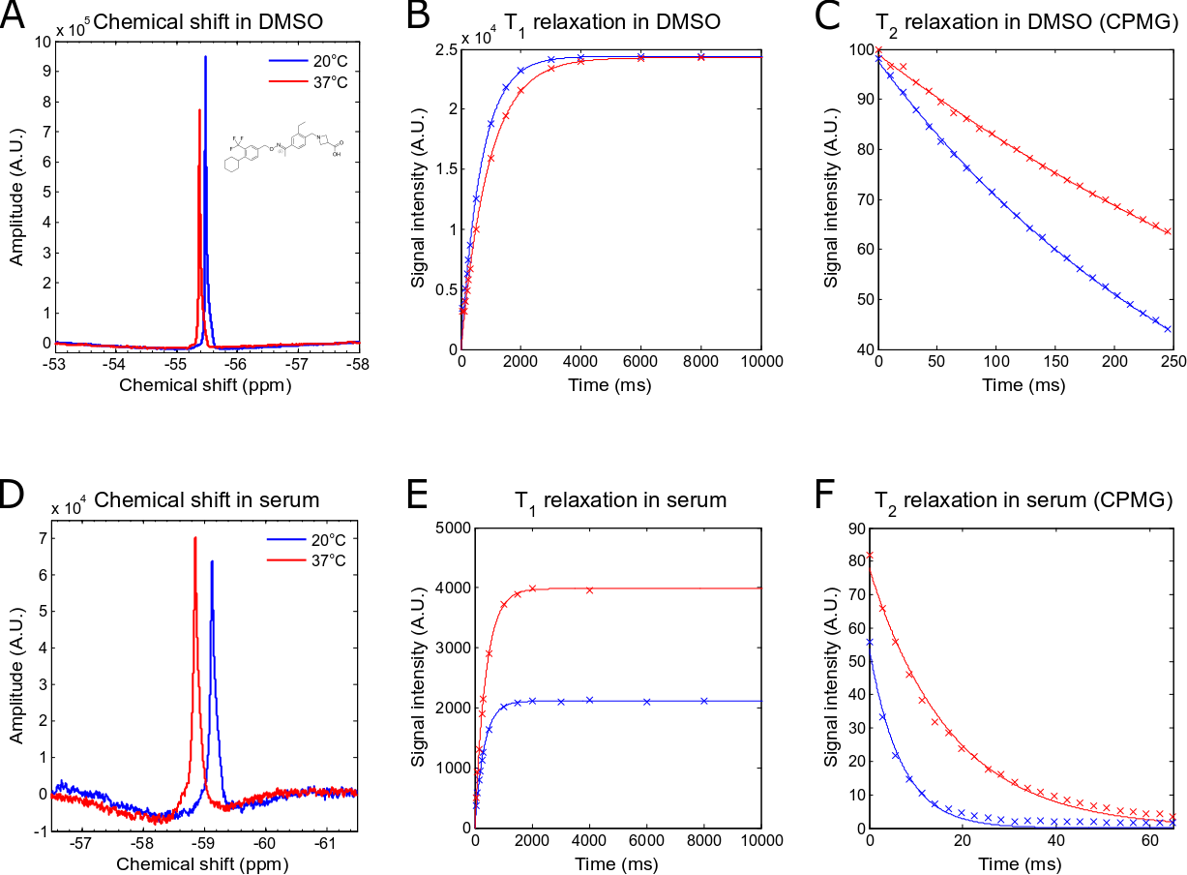
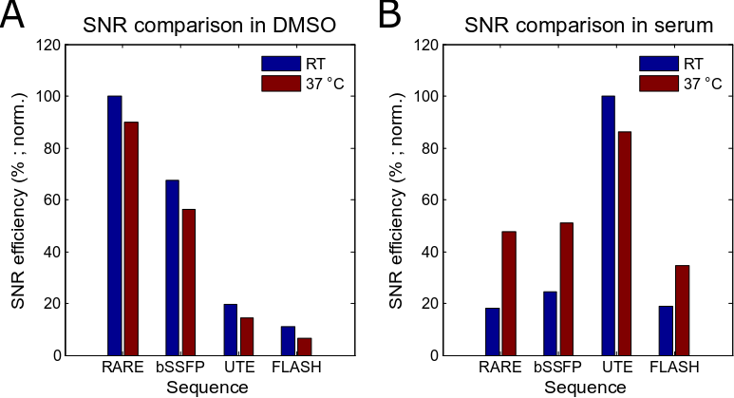
Siponimod in DMSO revealed a single peak spectrum with chemical shifts of ‑55.47ppm at RT and ‑55.36ppm at 37°C (Fig.1A). In DMSO and at 20°C, the spectroscopic determination of T1 yielded 680ms (Fig. 1B), matching T1 obtained with RAREVTR (T1=638 ms). At physiological temperatures (37°C), the spectroscopically obtained T1 of 928ms (Fig.1B) matches the RAREVTR acquired T1 of 907ms, showing an increase of 15ms/°C. T2 obtained with a CPMG sequence yielded 320ms (Fig.1C) and with MSME 219ms. At 37°C, T2 values increased to 547ms using CPMG (Fig. 1C) and 328ms for MSME, resulting in an increase of 9.9ms/°C. In the presence of serum, siponimod showed a single peak spectrum at chemical shifts of -59.06ppm at 20°C, and of ‑58.85ppm at 37°C (Fig.1D). Both T1 and T2 of siponimod were shortened in serum. T1 was shortened to 326ms at 20°C and 380ms at 37°C (Fig.1E). T2 was shortened to 7ms at 20°C, and 17ms at 37°C (Fig.1F), resulting in relative shortenings of 52% (59% at 37°C) for T1 and 98% (97% at 37°C) for T2. The SNR efficiency measured in DMSO revealed the highest value for the optimized RARE sequence (100%), followed by bSSFP (67%), UTE (20%), and FLASH (11%). At 37°C, the SNR efficiency for RARE was highest (90%), followed by bSSFP (56%), UTE (14%) and FLASH (7%)(Fig.2A). SNR efficiencies in serum at RT revealed a superiority of UTE (100%) over RARE (18%), bSSFP (25%) and FLASH (19%) at 20°C. At 37°C SNR efficiencies were 86% for UTE, 48% for RARE, 51% for bSSFP and 35% for FLASH (Fig.2B).Discussion
In this study, we characterized the 19F MR properties of siponimod. A temperature-related chemical shift and T1/T2 increase is in accordance with previous studies7 and identifies temperature as a critical influencing factor. Additionally, we identified that the biological environment in which siponimod is present in plays a crucial role with respect to its MR properties. The sharp drop in T2 in the presence of serum suggested that different pulse sequence methods might be required for signal detection. RARE and bSSFP techniques performed best in DMSO but were outperformed by UTE in serum. T2 is also expected to be shortened in vivo. Therefore, sequence and parameter selection for achieving maximally high SNRs in vivo need to be adapted according to the compound of interest and its environment.Conclusion
The characterization of siponimod revealed an influence of temperature and environment on its 19F MR properties. When studying the distribution of 19F drugs in MS patients, the most ideal pulse methods and sequence parameters will be essential for best detection. In addition to this, other technological developments such as cryogenically-cooled coils8, higher field strengths9, and compressed sensing will aid in further lowering detection limits. The goal of 19F MR detection is to enable 19F MR imaging of low drug concentrations in different tissues for non-invasively informing clinical studies and aiding patient-tailored drug dose modifications.Acknowledgements
This study is funded by Novartis, the Deutsche Forschungsgemeinschaft to S.W. (DFG-WA2804) and the European Research Council to T.N. (ERC advanced grant, ThermalMR, EU project 743077)
References
1. Rommer, P. S. et al. Immunological Aspects of Approved MS Therapeutics. Front Immunol 10, 1564, doi:10.3389/fimmu.2019.01564 (2019).
2. Reid, D. G. & Murphy, P. S. Fluorine magnetic resonance in vivo: a powerful tool in the study of drug distribution and metabolism. Drug discovery today 13, 473-480, doi:10.1016/j.drudis.2007.12.011 (2008).
3. Waiczies, H. et al. Visualizing brain inflammation with a shingled-leg radio-frequency head probe for 19F/1H MRI. Scientific reports 3, 1280, doi:10.1038/srep01280 (2013).
4. Faber, C. & Schmid, F. in Fluorine Magnetic Resonance Imaging (ed E. T. Ahrens, Flögel U.) 3-27 (Pan Stanford Publishing, 2016).
5. Scheffler, K. & Lehnhardt, S. Principles and applications of balanced SSFP techniques. European radiology 13, 2409-2418, doi:10.1007/s00330-003-1957-x (2003).
6. Schindelin, J. et al. Fiji: an open-source platform for biological-image analysis. Nature methods 9, 676-682, doi:10.1038/nmeth.2019 (2012).
7. Prinz, C. et al. Toward 19F magnetic resonance thermometry: spin–lattice and spin–spin-relaxation times and temperature dependence of fluorinated drugs at 9.4 T. Magnetic Resonance Materials in Physics, Biology and Medicine, doi:10.1007/s10334-018-0722-8 (2018).
8. Waiczies, S. et al. Enhanced Fluorine-19 MRI Sensitivity using a Cryogenic Radiofrequency Probe: Technical Developments and Ex Vivo Demonstration in a Mouse Model of Neuroinflammation. Scientific reports 7, 9808, doi:10.1038/s41598-017-09622-2 (2017).
9. Waiczies, S. et al. Fluorine-19 MRI at 21.1 T: enhanced spin–lattice relaxation of perfluoro-15-crown-5-ether and sensitivity as demonstrated in ex vivo murine neuroinflammation. Magnetic Resonance Materials in Physics, Biology and Medicine, doi:10.1007/s10334-018-0710-z (2018).
Figures