1839
MR radiomic features Correlate with EEG Connectivity during Intermittent Photic Stimulation in Patients with Cavernous Malformation1Department of Biomedical Imaging and Radiological Sciences, National Yang-Ming University, Taipei City, Taiwan, 2Department of Neurosurgery, Neurological Institute, Taipei Veteran General Hospital, Taipei, Taiwan, 3School of Medicine, National Yang-Ming University, Taipei, Taiwan, 4Brain Research Center, National Yang-Ming University, Taipei, Taiwan, 5Department of Neurology, Neurological Institute, Taipei Veterans General Hospital, Taipei, Taiwan, 6Institute of Brain Science, National Yang-Ming University, Taipei, Taiwan, 7Department of Radiology, Taipei Veteran General Hospital, Taipei, Taiwan
Synopsis
Cavernous malformation (CM) is one of the common cause for seizure attacks. Till now, the relationships between the structural characteristics of CM and the resultant abnormality of neural activity are still less explored. We employed MR radiomics analysis and EEG functional connectivity analysis to investigate whether quantitative and non-invasive features derived from these approaches can be used to differentiate CM patients with and without seizure. Furthermore, the association between structural and functional characteristics of CM were unraveled.
Background and Purpose
The commonly reported clinical symptoms of cavernous malformation (CM) include seizure, intracranial hemorrhage, and neurological dysfunctions.1 Researchers suggested that CM-related seizures, which could be observed by abnormal electroencephalography (EEG) patterns in the brain, were the consequences of repeated micro-hemorrhages from CM.2 Clinical MRI, in another way, provides superior tissue contrast and detection power of intracranial hemorrhages, and hence is suitable for measuring characteristics of CM. However, the relationships between the structural characteristics of CM lesion site (including the hemorrhage pattern, vascular structure, and hemosiderin deposition) and the abnormality of neural activity patterns still remain unclear. In this study, we aim to perform MR radiomics analysis and EEG functional connectivity analysis to unravel the relationship between image traits of CM structures and the corresponding alterations in brain functional connectivity.Materials and Methods
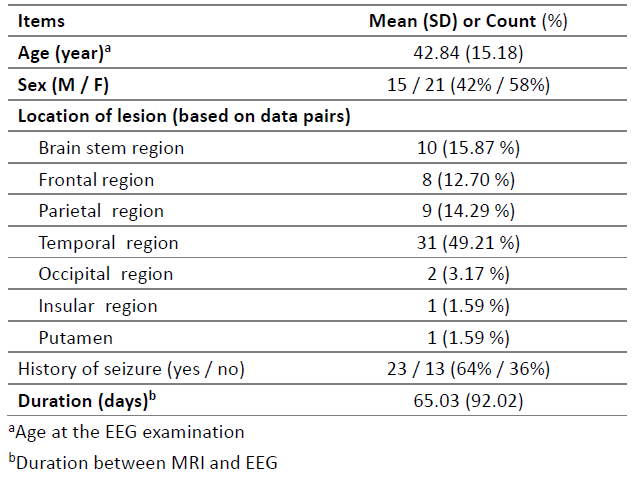
Patient Data: This study was approved by the local Institutional Review Board. We retrospectively reviewed 103 matched MRI and EEG data pairs from 68 CM patients with or without seizure history in Taipei Veteran General Hospital. After standardized data processing, we excluded 40 data pairs from analysis (15 insufficient information and signal quality of EEG and 25 poor quality of MRI). The remaining 63 data pairs from 36 CM patients were included for subsequent analysis. The average duration between MRI and EEG exams was about 65 days.Data acquisition: All the routine MRI and EEG data were collected. The MRI data, including T1+C or T1W, T2W, DWI, T2 FLAIR, and 3D gradient-echo time-of-flight (TOF) images, were acquired on a 1.5T GE scanner. T2 FLAIR and TOF images were only available for a part of patients. The EEG data were recorded during intermittent photic stimulations (IPS, with frequencies of 5, 7, 9, 11, 13, 15, 17, 19, and 21 Hz by a flashing LED light) using 19 scalp electrodes distributed according to the international 10-20 system (Fp1, Fp2, F7, F3, Fz, F4, F8, C3, Cz, C4, P3, Pz, P4, O1, O2, T3, T5, T4, and T6). The sampling rates were ranged from 250 to 500 Hz (Nicolet EEG v32, CareFusion Corp., San Diego, CA, USA) and resampled to 250 Hz for further analyses. The impedance for all electrodes was less than 10 kilo ohms. The duration of each frequency of IPS was 10 s followed by a 10 s resting interval. The patient was instructed to close eyes during entire session.
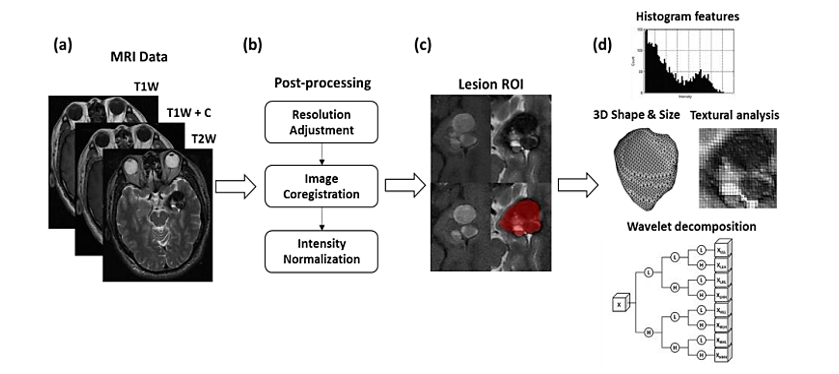
MR radiomics: Several processing steps on MRIs were applied to improve the reliability of radiomics analysis: 1) adjustment of image resolution to 0.50 x 0.50 x 3.00 mm3, 2) image coregistration between all MRI contrasts, and 3) intensity normalization. CM lesion ROIs including the surrounding hemosiderin rim, were delineated by experienced neuroradiologists and researchers. Overall 1763 radiomic features, including histogram, shape/size, and texture features, with wavelet decomposed MRIs were obtained by using the MR Radiomics Platform (Figure 1).3
EEG functional connectivity: Independent component analysis derived from EEGLAB was first applied to correct eye-movement artifacts and electrode impedance patterns4. Processed EEG data were then band-pass filtered between 1 to 50 Hz5, and divided into approximate 200 epochs with a length of 500 data points and a 50% overlap. Finally, the time-frequency cross mutual information approach (from 5 to 21 Hz) was used to estimate the functional connectivity between EEG electrodes, and a summation of connectivity strength across electrodes was calculated to estimate global (whole-brain) strength.6
Results and Discussion
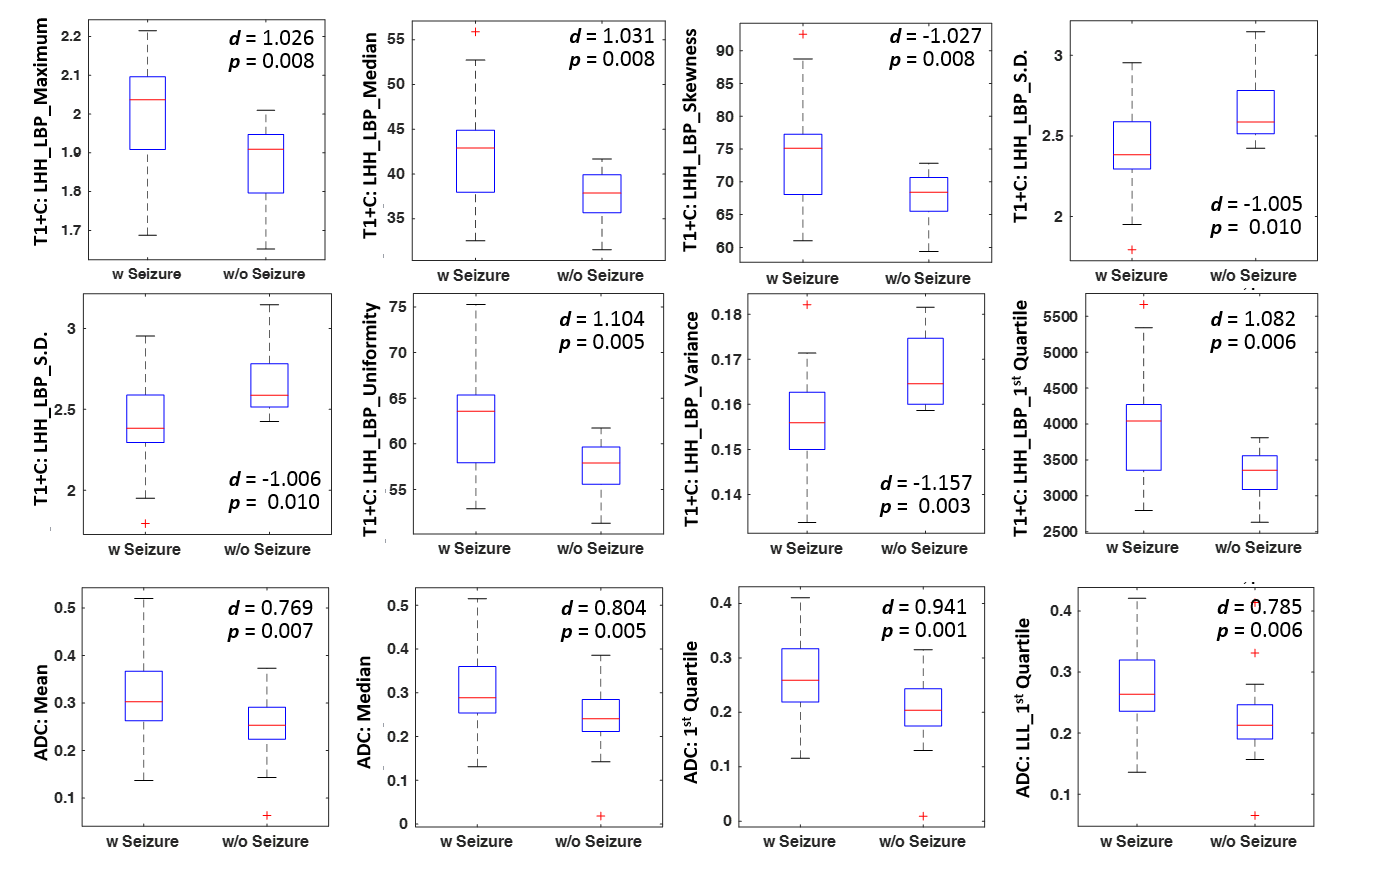
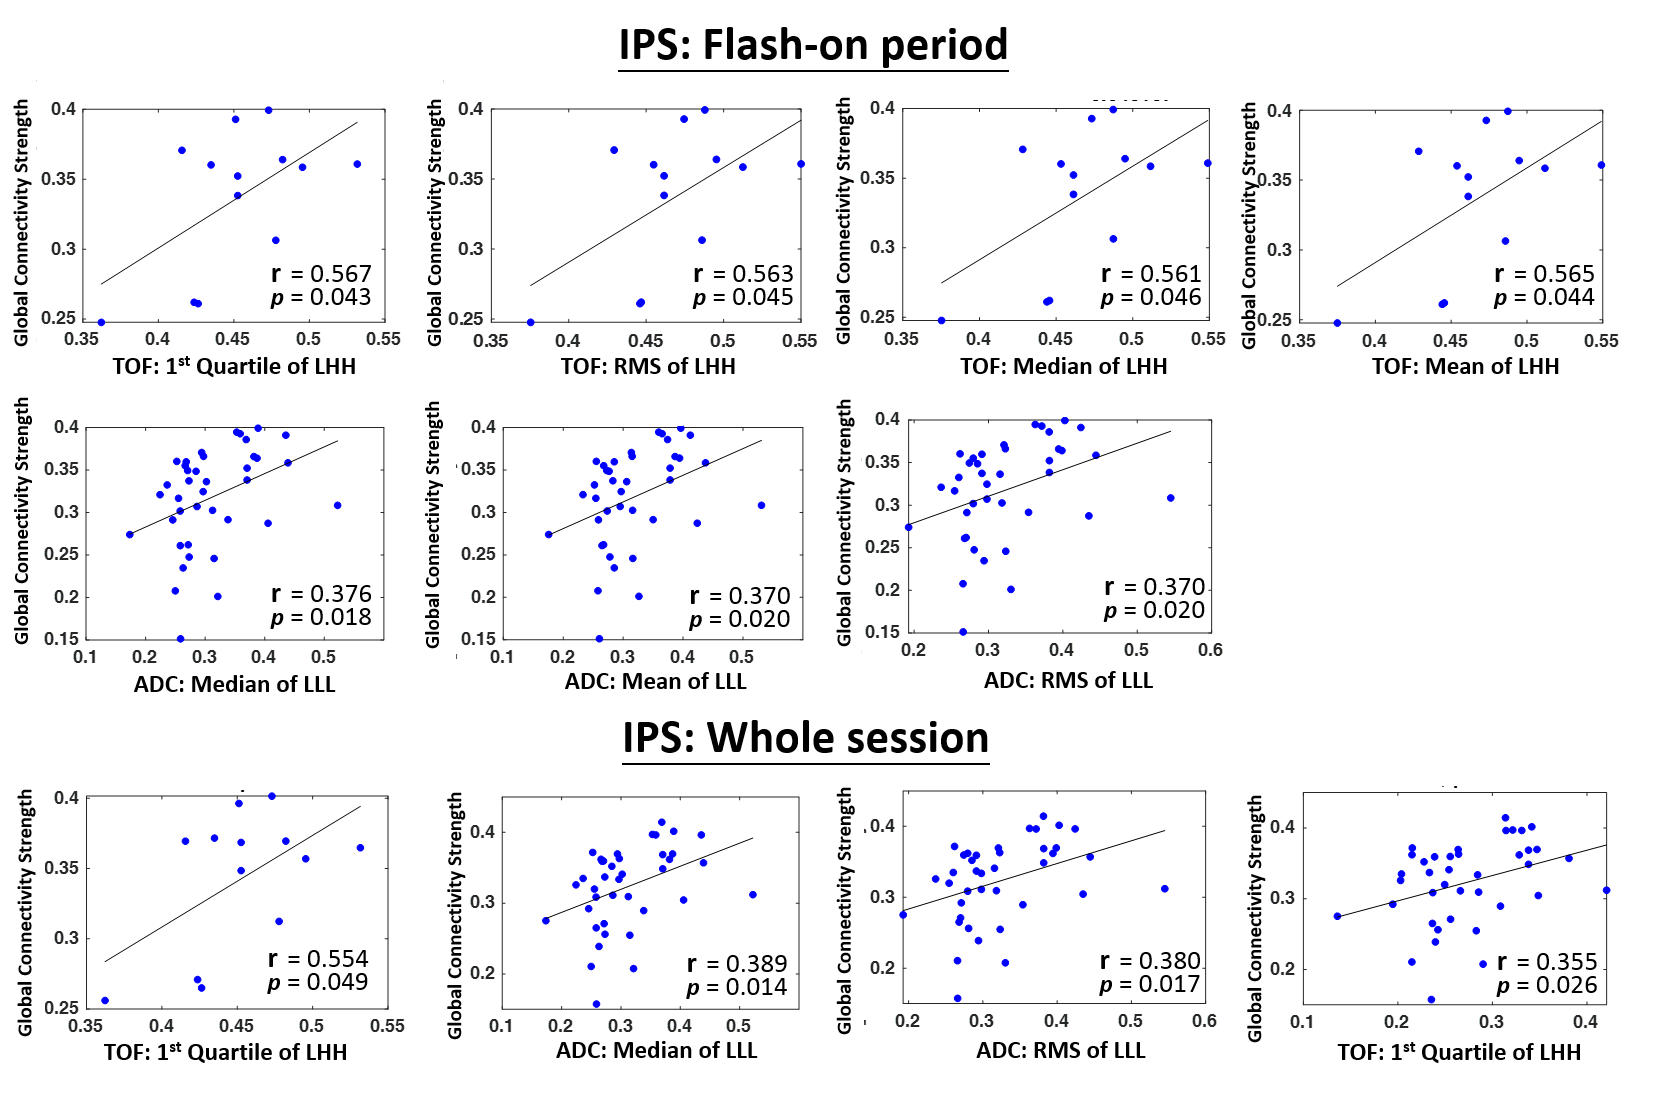
The clinical characteristics of recruited patients are listed in Table 1. It was noted that most CM lesions in patients with seizure history were located in the temporal lobe (only four of 23 patients were not). For the EEG functional connectivity analysis during the IPS flash-on period, no significant difference was observed in the comparison of global connectivity strength between seizure and non-seizure CM patients (p=0.694, two-sample t test). However, significant changes of global connectivity strength were observed between IPS flash-on and resting periods (p<0.001 in the seizure group and p=0.035 in the non-seizure group, paired t test), indicating the significant modulating effect from IPS on the global connectivity strength. For the MR radiomics analysis, 12 radiomic features (8 features from T1+C and 4 from DWI derived apparent diffusion coefficients, ADC) showed significant differences between seizure and non-seizure CM patients (p<0.01, Cohen effect size > 0.75, two-sample t test, Figure 2). These results suggested that MR radiomics was capable to differentiate the occurrence of CM-related seizure attacks. Finally, the correlation analysis was performed to investigate the relationships between MR radiomics and EEG global connectivity strength in the seizure group of CM patients. Figure 3 shows that several radiomic features extracted from TOF images (characterizing vascular structures within CM) and ADC (relating to extracelluar water diffusion) were significantly correlated with global connectivity strength (either during the IPS flash-on period or full period of IPS session including resting interval). Higher correlation coefficients were observed associated with TOF radiomic features.Acknowledgements
This work was supported by the Ministry of Science and Technology, Taiwan (MOST 106-2221-E-010-016-MY3, MOST 108-2321-B-010-012-MY2).References
1. Horne, M. A., et al. Clinical course of untreated cerebral cavernous malformations: a meta-analysis of individual patient data. The Lancet Neurology. 2016;15(2): 166-173.
2. Akers, A., et al. Synopsis of Guidelines for the Clinical Management of Cerebral Cavernous Malformations: Consensus Recommendations Based on Systematic Literature Review by the Angioma Alliance Scientific Advisory Board Clinical Experts Panel. Neurosurgery. 2017;80(5):665-680.
3. Lu CF, Hsu FT, Hsieh KL, Kao YC, Cheng SJ, Hsu JB, Tsai PH, Chen RJ, Huang CC, Yen Y, Chen CY. Machine learning–based radiomics for molecular subtyping of gliomas. Clinical Cancer Research. 2018 Sep 15;24(18):4429-36.
4. Raduntz, T., et al. EEG artifact elimination by extraction of ICA-component features using image processing algorithms. J Neurosci Methods. 2015;243: 84-93.
5. Widmann, A. and E. Schroger. Filter effects and filter artifacts in the analysis of electrophysiological data. Front Psychol 2012;3: 233.
6. Chen, C. C., et al. Mutual-information-based approach for neural connectivity during self-paced finger lifting task. Hum Brain Mapp. 2008;29(3):265-280.
Figures