1838
CMRO2 and slow-wave activity are inversely related during sleep: findings from concurrent EEG and OxFlow MRI.
Alessandra Caporale1, Hyunyeol Lee1, Hui Lei2, Hengyi Rao3, Michael C Langham1, Alessandra A Caporale2, and Felix W Wehrli1
1Radiology, University of Pennsylvania Perelman School of Medicine, Philadelphia, PA, United States, 2Neurology, University of Pennsylvania Perelman School of Medicine, Philadelphia, PA, United States, 3Psychiatry, Division of Sleep and Chronobiology, University of Pennsylvania Perelman School of Medicine, Philadelphia, PA, United States
1Radiology, University of Pennsylvania Perelman School of Medicine, Philadelphia, PA, United States, 2Neurology, University of Pennsylvania Perelman School of Medicine, Philadelphia, PA, United States, 3Psychiatry, Division of Sleep and Chronobiology, University of Pennsylvania Perelman School of Medicine, Philadelphia, PA, United States
Synopsis
Radial OxFlow, a technique able of measuring cerebral metabolic rate of oxygen (CMRO2) dynamically, has been combined with simultaneous electroencephalography (EEG) recording, during the natural onset of sleep and maintenance during a 50-min period of scanning. During sleep, CMRO2 (measured continuously with an effective temporal resolution of 3.4 seconds) decreased up to 24% with respect to pre-sleep wakefulness. CMRO2 changes were positively correlated with heart rate (r2=0.25-0.48, P<0.0005), and negatively with changes in EEG slow-wave activity (r2=0.41-0.67, P<0.005), when sleep onset and maintenance occurred.
Introduction
Sleep is a physiological need, and it is required for memory consolidation, restoration of cellular function and synaptic downscaling [1,2]. Pathological or environmental conditions hindering sleep can result in impaired cognitive function and increased risk for hypertension and cardiovascular diseases [3]. In the sleeping brain, reduced synaptic transmission is accompanied by cerebral metabolic rate of oxygen (CMRO2) decrease in non-REM sleep with respect to pre-sleep wakefulness, as demonstrated by invasive measurements using catheterization [4]. Moreover, it was shown that electroencephalographic activity of non-REM slow-wave sleep (SWS), expressed by -activity, covariates regionally with cerebral blood flow [5]. However, to the best of our knowledge, the relation between CMRO2 and δ-activity has not yet been clarified. Recently, we showed that measuring CMRO2 with radial OxFlow MRI and concurrent electroencephalography (EEG) is feasible, and by following dynamically hemodynamic and metabolic changes during the early stages of sleep, we found a reduction of about 15% in CMRO2, relative to the awake state [6]. In this work we extend previous results and analyze more systematically the relationship between CMRO2 and δ-activity changes, during progression from relaxed wakefulness through spontaneous onset of SWS in a 50-min MRI-EEG protocol.Methods
Nine healthy subjects (2 females) with no overt sleep disorders were recruited (mean age ± SD = 35.6±16.8 years, range 22-77 years, body mass index, BMI = 23.4±2.6 kg/m2, range 18.6-26.8 kg/m2). Participants were examined in late evening, after a light dinner, to promote the onset of sleep. Sleep deprivation was not required, but abstinence from caffeine at the day of the examination was encouraged. One of the subjects intentionally refrained from sleeping the night prior to the examination. MRI was performed on a 3.0 T Siemens Prisma scanner with subjects positioned supine, head-first, using a 64-channel head-neck coil, which provided adequate space to connect cables of the EEG cap to the amplifier (BrainAmp MR Plus). Scalp electrodes were placed according to the international 10-20 system. EEG- and MRI-data were collected continuously for 50 minutes. During the first 5-7 minutes (W1) a standard visual stimulus (white cross on a black background) was provided. After W1, subjects were instructed to close their eyes, and left at liberty to sleep. All subjects were awakened by the operator via the scanner’s intercom after 30 minutes, asked to press the squeeze-ball, and prompted to stay awake with eyes open for the remaining 10-13 minutes of the protocol (W2). The acquisition protocol was described in detail in [6]. Briefly, an OxFlow sequence using golden angle radial k-space sampling was used [7]. From the phase contrast (PC)-MRI data, after phase-unwrapping, blood flow was quantified in the superior sagittal sinus (SSSBF), and upscaled to yield total cerebral blood flow (CBF); venous oxygen saturation (SvO2) was quantified in SSS via MRI susceptometry [6]. CMRO2 was then computed off-line via Fick’s Principle (Figure 1) with in-house MATLAB scripts (MATLAB R2016b MathWorks, Inc., Natick, MA). Spectral analysis of EEG recordings was performed off-line for computation of activity in specific frequency bands (δ:0.5-4 Hz). Pearson’s and Spearman’s correlation between CMRO2, δ and heart rate (HR) were evaluated (significance level P<0.05).Results and Discussion
EEG indicated that δ-activity increased at least by 25% with respect to pre-sleep state, with the increase sustained for at least 5 minutes in 3 subjects, who were able to fall asleep during the pre-determined period, while staying awake during W1 and W2 (S01, S08 and S09). Figure 2 shows the time-course of hemodynamic and metabolic parameters during the protocol for three subjects: in the first case (Figure 2A) CMRO2 fluctuates around an average value; in distinction, a progressive decrease in CMRO2 can be noticed, when sleep onset occurred in between W1 and W2 in Figure 2B,C. By isolating the flow and arterio-venous difference (AvDO2 = SaO2-SvO2) contributions to CMRO2, it can be noticed that CMRO2 decrease is driven either by decreased net AvDO2, as in S08 (due to both SaO2 decrease and SvO2 increase), or by reduced CBF, as in S09 (Figures 2D-F), while in S06 the two contributions balanced each other. As illustrated in Figure 3A, δ-activity normalized to the entire spectrum yielded δrel(O2), varying in the interval (0, 1). S09, who was sleep-deprived, was unable to stay awake during the initial nominal wakefulness period (Figure 3D). In S04 δrel(O2) fluctuated rapidly, and the subject fell asleep for a brief interval during W2. The fluctuations in CMRO2 were negatively associated with δrel(O2) changes, when the onset and maintenance of sleep occurred (Figure 4). In Figure 5 the correlation plots are shown for S01, S08 and S09. Interestingly, CMRO2 changes during progression from relaxed wakefulness through spontaneous onset of SWS in the 50-min protocol paralleled changes in heart rate (HR). Lastly, there was a negative covariation between HR and δrel(O2), reflecting variations in sleep depth.Conclusions
The use of concurrent EEG and OxFlow indicated that whole-brain CMRO2 changes measured during the spontaneous transition from wakefulness to sleep were commensurate to the increase in slow-wave or δ-activity. This technique could be useful to investigate sleep disorders and aging-related sleep deterioration, where the above relationship could be aberrant.Acknowledgements
This study was supported by the Institute for Translational Medicine and Therapeutics of the Perelman School of Medicine at the University of Pennsylvania and by the National institute of Health (R01 HL109545, R01 HL139358).References
[1]. Tononi G, Cirelli C. Sleep medicine reviews. 2006;10(1):49-62. [2]. De Vivo et al. Science. 2017;355:507-510. [3]. Mullington JM, et al. Progress in cardiovascular diseases. 2009;51(4):294-302. [4]. Madsen PL, et al. Journal of Applied Physiology. 1991;70(6):2597-2601. [5]. Hofle et al., Journ of Neuroscience. 1997;17(12):4800-4808. [6]. Caporale A, et al. Int. Soc. Magn. Res. Med., 27th Meeting, 2019. [7]. Cao W et al., Magnetic Resonance in Medicine. 2018;79(1):217-223.Figures
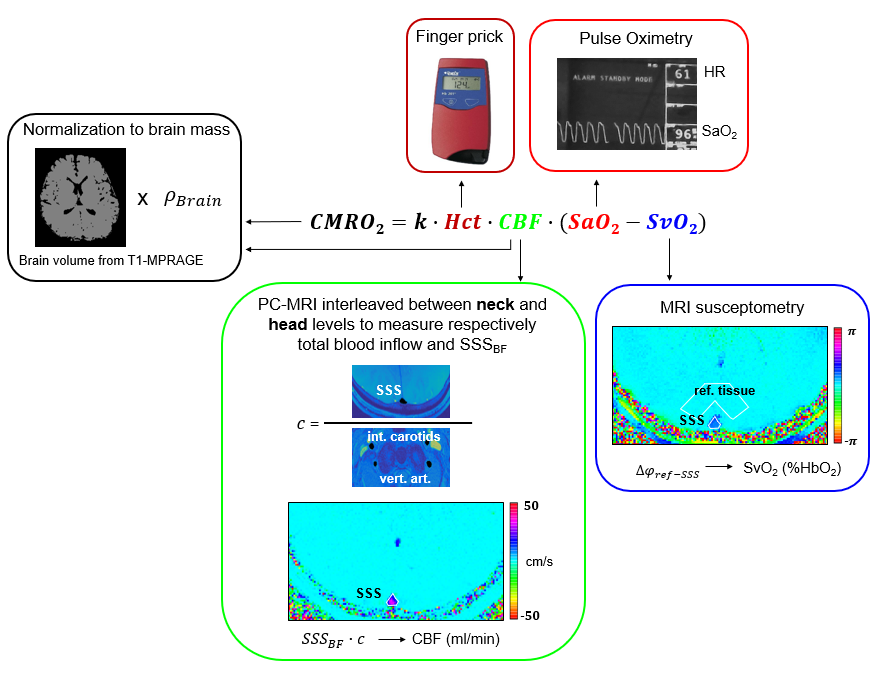
Figure 1. CMRO2
quantification from radial OxFlow data. CMRO2 is retrieved from the
Fick’s Principle. Total CBF is derived by upscaling SSSBF. The scaling
factor is estimated with dual-slice velocimetry and represents the ratio
between SSSBF and inflowing blood through the neck vessels. CBF and
CMRO2 are normalized to the brain mass. Venous oxygen saturation
(SvO2) is derived through MRI susceptometry; arterial saturation and
heart rate are measured via pulse oximetry. Hct = hematocrit; CBF = cerebral
blood flow; SSSBF = superior sagittal sinus blood flow.
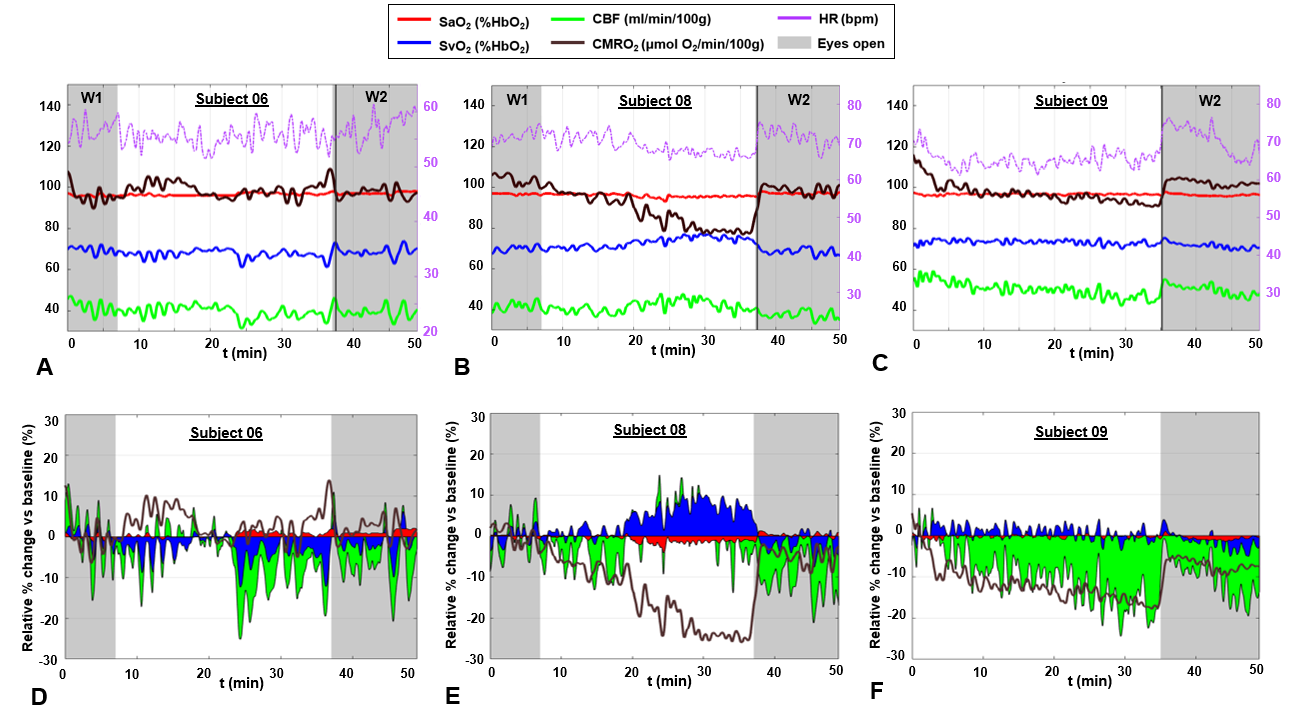
Figure 2. CMRO2 during wakefulness and
sleep. Metabolic parameters measured in three subjects (A. S06 M, 77
years; B. S08 M, 36 years; C. S09 F, 24 years). For initial
and final portions of the protocol (W1 and W2, respectively), subjects were
awake, with eyes open (S08 and S09 managed to sleep; S09 was sleep
deprived). D-F. Relative percent change of each parameter with
respect to the baseline value (first 5 minutes of W1).
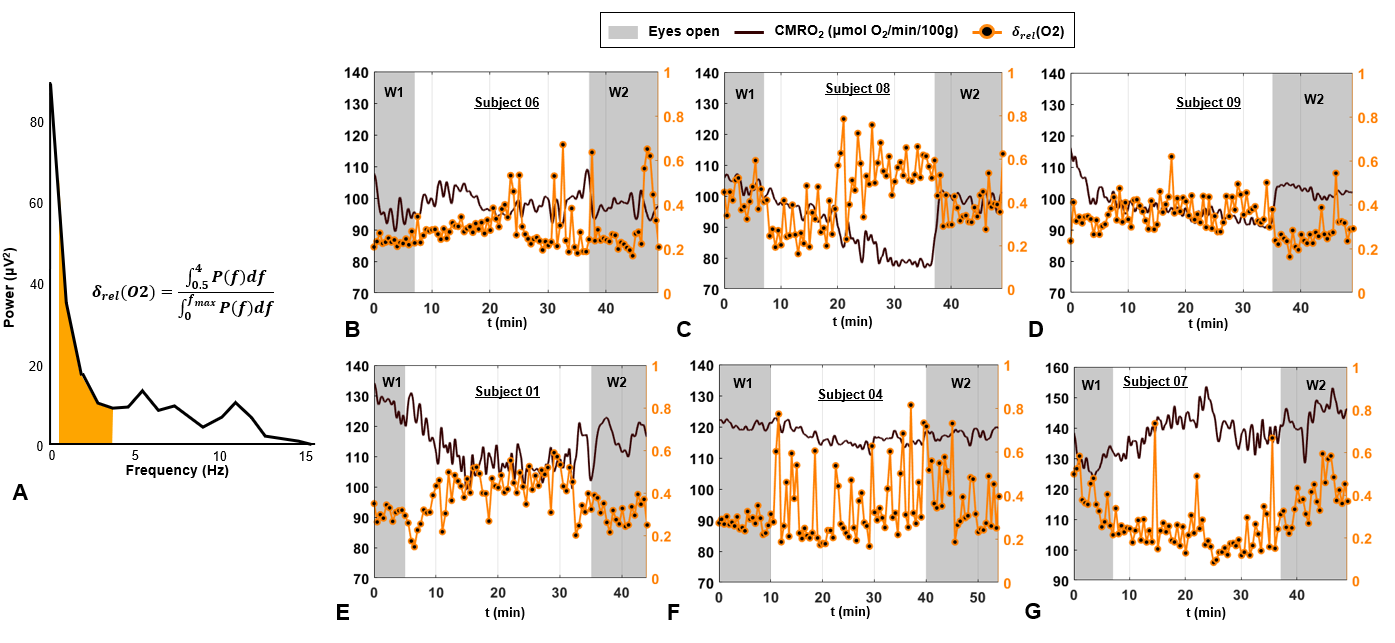
Figure 3. Concurrent EEG and rOxFlow during
wakefulness and sleep. A. Power
spectrum derived from EEG recordings of the channel O2 in a volunteer during
sleep (S01). The delta-band (0.5-4.0 Hz) is colored. Delta power ratio (δrel) was estimated as indicated (P, power; f,
frequency; fmax=30 Hz). B-G. δrel(O2), superimposed on CMRO2 time-course
for the three subjects of Figure 2,
and three additional subjects.
δrel(O2) is averaged every 30 seconds.

Table 1. Pearson’s (r) and
Spearman’s (ρ) correlation coefficients between CMRO2, δrel(O2), and heart
rate (HR), obtained by averaging signal over 2.5 min time-windows.

Figure 5. CMRO2 versus EEG delta power ratio. CMRO2 plotted as a function of δrel(O2)
for
three subjects for whom sleep duration greater than 5 minutes
was confirmed by EEG. A. S01, male, 40 years. B. S08, male, 36
years. C. S09, female, 24 years. Markers represent averages over 2.5-min time
windows, error bars represent standard deviations. Pearson’s correlation
coefficient r and the significance level P are indicated.