1836
Prediction-Identification Landscape for Brain Structure and Connectivity1Department of Biomedical Engineering, The University of Melbourne, Melbourne, Australia, 2Melbourne Neuropsychiatry Centre, Department of Psychiatry, The University of Melbourne, Melbourne, Australia
Synopsis
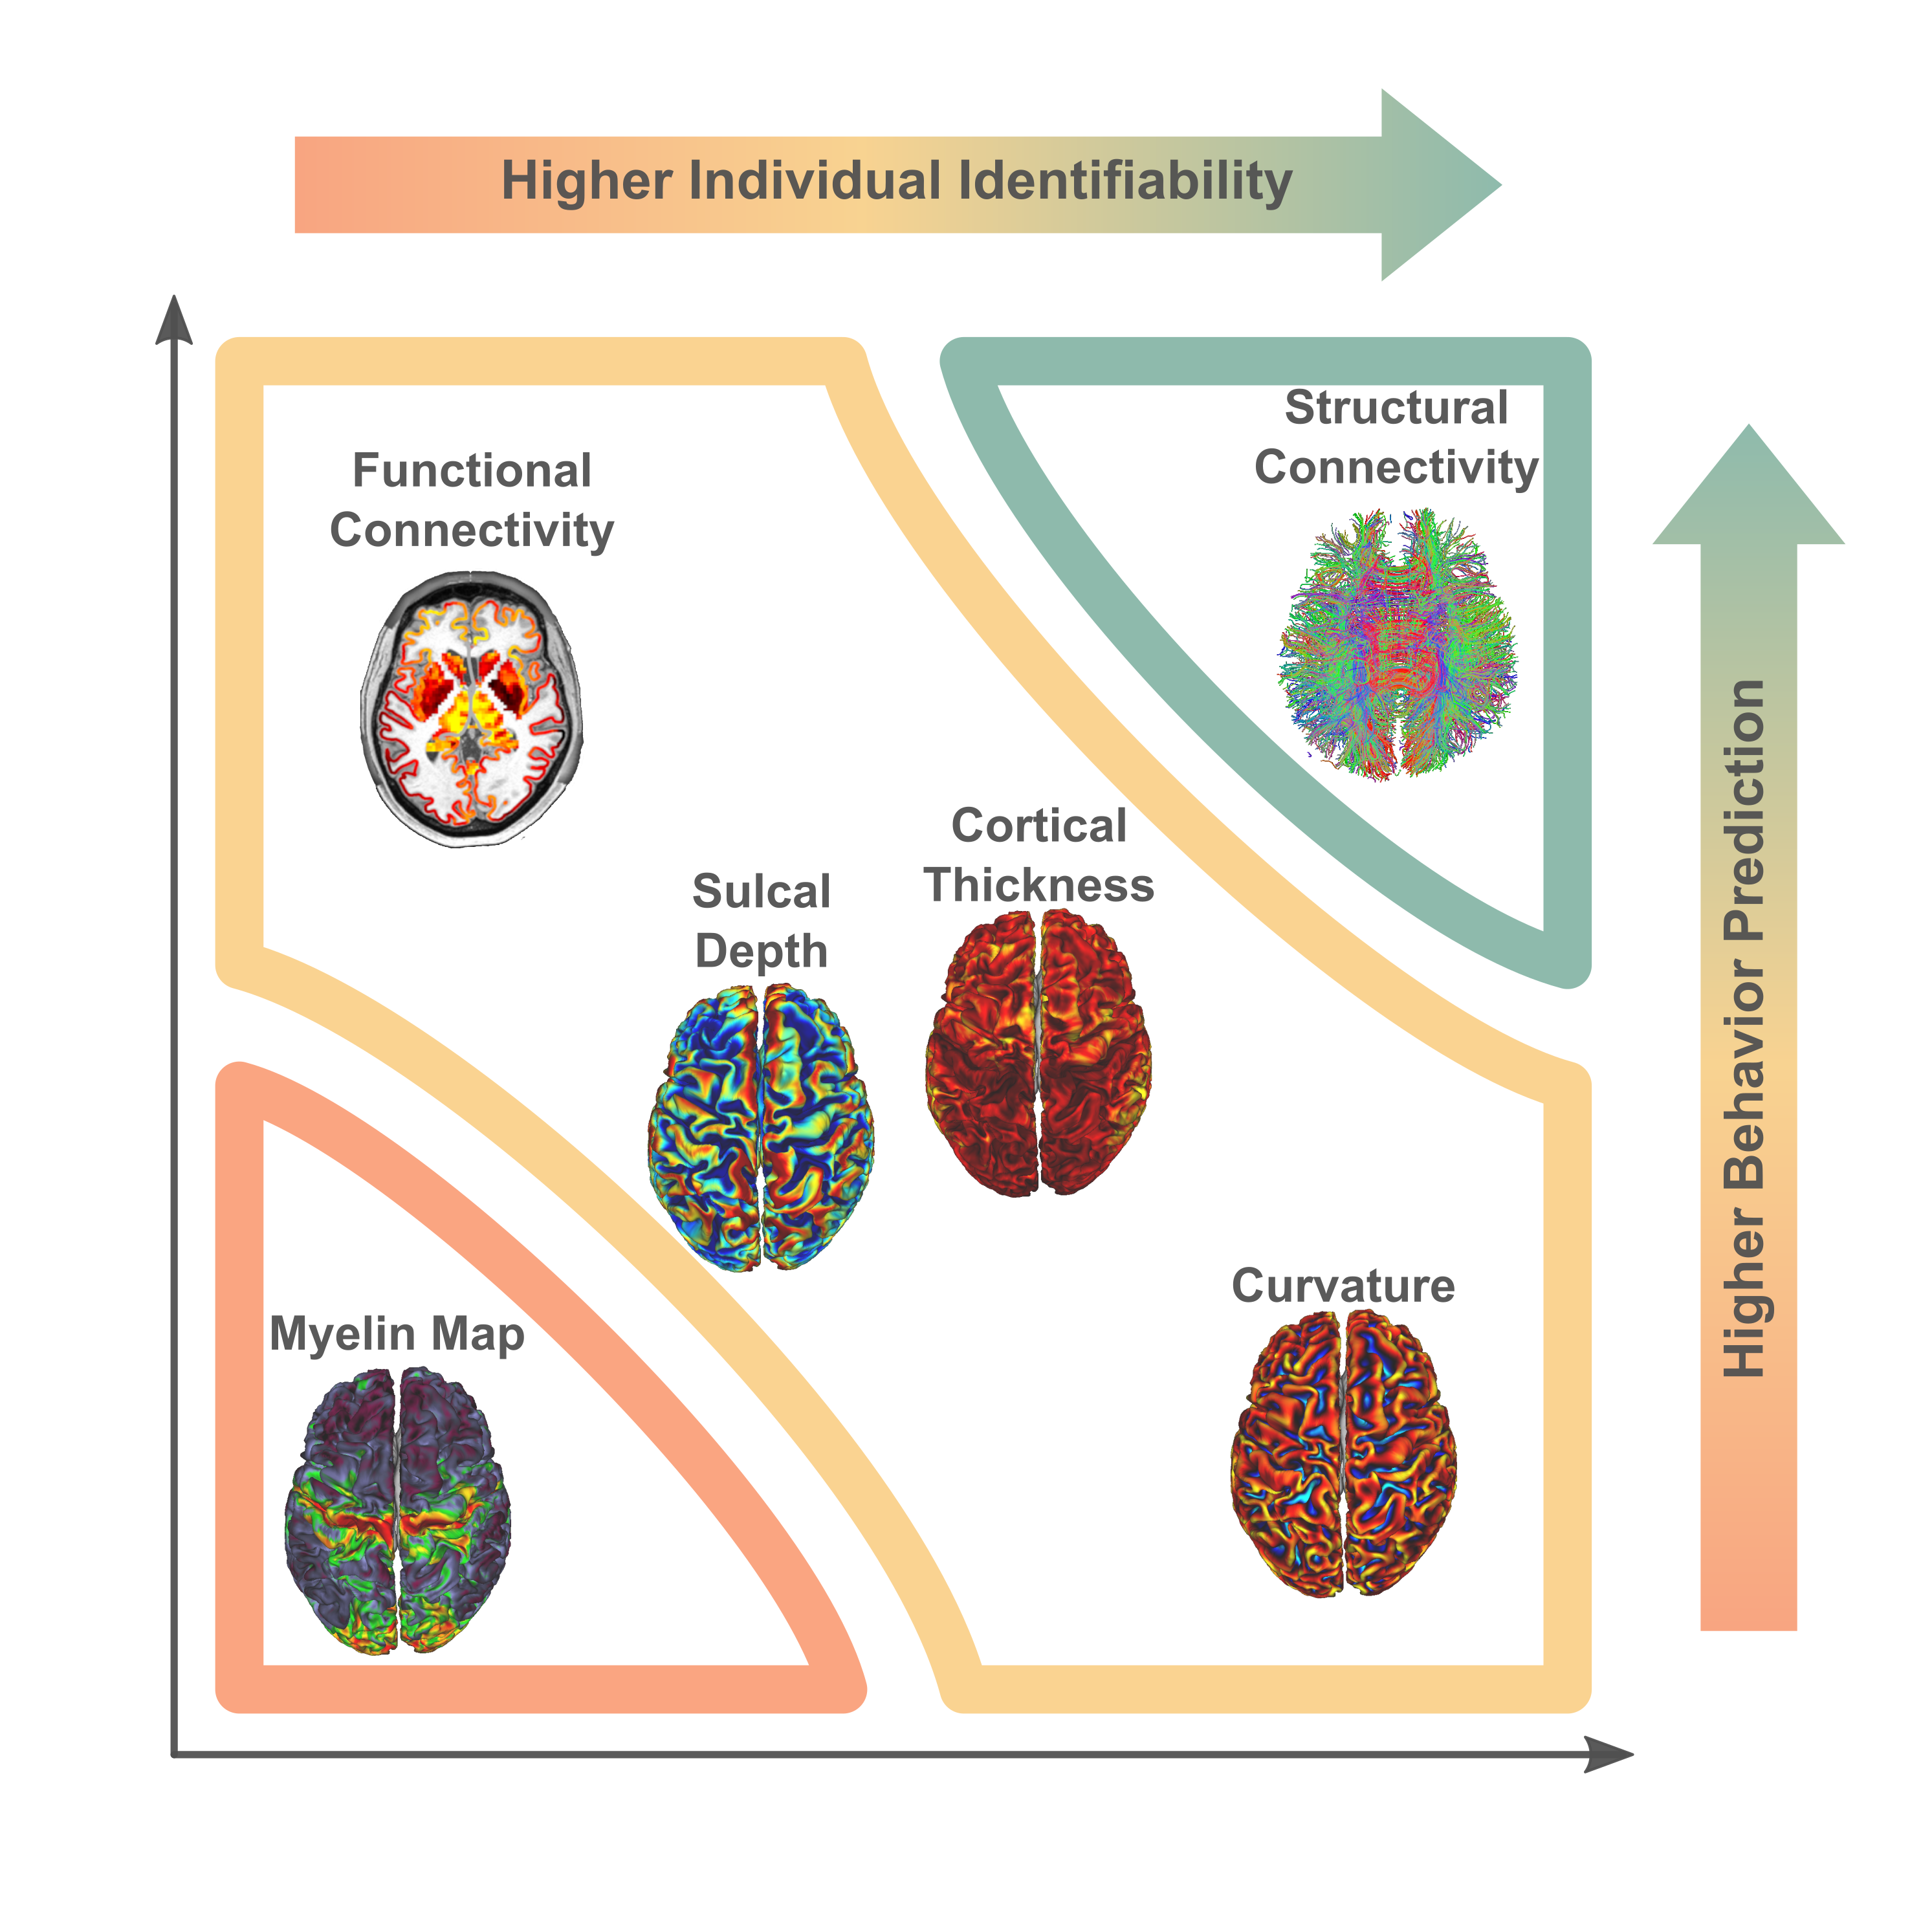
Neuroimaging-derived brain phenotypes can be used to identify individuals and predict behavior. We investigated the prediction and identification performance of brain structure and connectivity phenotypes derived from structural, functional and diffusion MRI. Five behavioral domains were predicted: cognition, illicit substance use, tobacco use, personality-emotion traits, and mental health. We arranged the phenotypes on a two-dimensional prediction-identification landscape. Functional connectivity performed better at prediction than identification, whereas the converse was found for curvature and other structural phenotypes. Structural connectivity performed well for both tasks. High-resolution measures outperformed atlas-based counterparts. Our work can aid brain phenotype selection in future neuroimaging studies.
Introduction
Multimodal neuroimaging provides the ability to noninvasively measure brain phenotypes such as cortical architecture, topography, function, and connectivity. A major goal in neuroscience is to establish whether these phenotypes predict individual variation in human behaviors and cognitive performance1,2,3. We refer to this as behavior prediction. Functional connectivity (FC) is known to predict individual variation in fluid intelligence4, sustained attention5, and a myriad of other behaviors6. In contrast, fewer studies have investigated behavior prediction with structural connectivity (SC) derived from diffusion MRI7.A complementary and more recently investigated goal involves determining whether neuroimaging-derived phenotypes can identify specific individuals from a group of others, which is referred to as individual identification, otherwise known as neural fingerprinting4. Individual variability in FC is sufficiently large3 to enable individual identification based on an individual’s unique FC fingerprint4,8,9,10. However, it is unclear whether SC fingerprints11 or alternative neuroimaging-derived measures are more unique to individuals than FC and thus would enable improved individual identification.
The aim of this study was to compare the identification and behavior prediction performance of neuroimaging-derived phenotypes, including FC, SC and various measures of cortical structure and architecture. We also investigate whether high-resolution connectomes and cortical structure measured at the resolution of vertices/voxels provide improved identification and prediction performance, compared to their atlas-based counterparts. Figure 1 shows an overview of the study design and summarizes the key neuroimaging phenotypes investigated.
Methods
We analyzed neuroimaging and behavioral data acquired from 1000 individuals participating in the Human Connectome Project (HCP)12. These individuals formed a test group. MRI scans were repeated in 42 of these individuals, providing a retest group. Diffusion MRI and probabilistic tractography was used to map structural connectomes. Functional connectomes were mapped using resting-state functional MRI. Connectomes were mapped at the resolution of cortical surface vertices (~32,000 nodes per hemisphere) and regions comprising an established atlas (180 nodes per hemisphere)13. Additionally, cortical surface maps of: i) cortical thickness, ii) cortical curvature, iii) sulcal depth, and iv) myelin were sourced from the HCP. These maps were also resampled to the atlas regions. Hence, each individual was associated with two connectomes and four surface maps, each of which was mapped at the resolution of vertices and regions, yielding 12 measures in total. For each measure, a similarity metric for all test-test ($$$1000\times1000$$$) and test-retest ($$$1000\times42$$$) pairs of scans was computed.Individual Identification: Each fingerprint in the retest group was matched to the fingerprint in the test group with which it was most similar. This is yielded a one-to-one mapping between individuals in the retest and test groups. The fingerprint-predicted matching was compared to the ground truth to determine the proportion of correctly matched individuals in the retest group, referred to as the identification accuracy. Given that multiple phenotypes yielded $$$100\%$$$ accuracy, identification performance was also measured using the effect size difference (Cohen’s d) between the distribution of i) true pair similarities ($$$42$$$ pairs), and ii) false pair similarities ($$$42\times999$$$ pairs). Hence, higher effect size differences translated to higher precision in identification.
Behavior Prediction: Independent component analysis (ICA) was used to decompose 109 behavioral measures14 to five core continuous dimensions, characterizing cognitive performance, illicit substance use, tobacco use, personality-emotion traits, and mental health. Fluid intelligence was also considered to facilitate comparison with existing studies. The variance component model (VCM)15 was used to evaluate the extent to which each neuroimaging measure could explain individual variation in each behavioral dimension. Measures that explained greater individual variance were deemed to perform better. The similarity matrix for the VCM was computed by correlating each measure between pairs of individuals.
Results
Individual Identification: We found that measures of cortical structure and architecture, such as curvature, are more accurate in fingerprinting individuals than functional connectivity (Figure 2:A). Crucially, fingerprints derived from structural connectivity enabled the most accurate identification of individuals. Additionally, the vertex-based variants that were computed in higher resolution generally improved identification performance to a great extent.Behavior Prediction: For behavior prediction, Figure 2:B shows the variance explained in VCM averaged across the independent components of cognition and behavior sampled with a jackknife resampling method16. This can be interpreted as an overall rating of the applicability of neural phenotypes to a wide range of cognitive and behavioral characteristics. We found that connectomic measures in general, especially at the higher resolution, better explained individual variation in behavior. (See Figure 3 for a detailed breakdown of behavior interpretation components.) A measure of individual uniqueness was also computed by regressing out the false pair similarities from the true pair similarities (Figure 4).
Discussion and Conclusion
Arranging neuroimaging-derived phenotypes on a two-dimensional prediction-identification landscape revealed a dichotomy between phenotypes suited to identifying individuals and phenotypes that could explain individual variation in behavior (Figure 5). High-resolution structural connectomes performed well at both tasks. When comparing different resolutions, we found that vertex-based phenotypes, in general, improve identification and prediction performance over their atlas-based counterparts for nearly all behavioral domains and phenotypes (refer to Figure 3). This suggests that a higher resolution captures additional detail to enable greater task accuracy (Figure 4).Acknowledgements
Data were provided by the Human Connectome Project, WU-Minn Consortium (Principal Investigators: David Van Essen and Kamil Ugurbil; 1U54MH091657) funded by the 16 NIH Institutes and Centers that support the NIH Blueprint for Neuroscience Research; and by the McDonnell Center for Systems Neuroscience at Washington University.
This research was supported by the Spartan High-Performance Computing System at the University of Melbourne17.
References
1. Deco G, Kringelbach ML. Great expectations: using whole-brain computational connectomics for understanding neuropsychiatric disorders. Neuron. 2014 Dec 3;84(5):892-905.
2. Fornito A, Bullmore ET, Zalesky A. Opportunities and challenges for psychiatry in the connectomic era. Biological Psychiatry: Cognitive Neuroscience and Neuroimaging. 2017 Jan 1;2(1):9-19.
3. Mueller S, Wang D, Fox MD, Yeo BT, Sepulcre J, Sabuncu MR, Shafee R, Lu J, Liu H. Individual variability in functional connectivity architecture of the human brain. Neuron. 2013 Feb 6;77(3):586-95.
4. Finn ES, Shen X, Scheinost D, Rosenberg MD, Huang J, Chun MM, Papademetris X, Constable RT. Functional connectome fingerprinting: identifying individuals using patterns of brain connectivity. Nature neuroscience. 2015 Nov;18(11):1664.
5. Rosenberg MD, Finn ES, Scheinost D, Papademetris X, Shen X, Constable RT, Chun MM. A neuromarker of sustained attention from whole-brain functional connectivity. Nature neuroscience. 2016 Jan;19(1):165.
6. Smith SM, Nichols TE, Vidaurre D, Winkler AM, Behrens TE, Glasser MF, Ugurbil K, Barch DM, Van Essen DC, Miller KL. A positive-negative mode of population covariation links brain connectivity, demographics and behavior. Nature neuroscience. 2015 Nov;18(11):1565.
7. Powell MA, Garcia JO, Yeh FC, Vettel JM, Verstynen T. Local connectome phenotypes predict social, health, and cognitive factors. Network neuroscience. 2018 Mar;2(1):86-105.
8. Horien C, Shen X, Scheinost D, Constable RT. The individual functional connectome is unique and stable over months to years. NeuroImage. 2019 Apr 1;189:676-87.
9. Byrge L, Kennedy DP. High-accuracy individual identification using a “thin slice” of the functional connectome. Network Neuroscience. 2019 Feb;3(2):363-83.
10. Amico E, Goñi J. The quest for identifiability in human functional connectomes. Scientific reports. 2018 May 29;8(1):8254.
11. Yeh FC, Vettel JM, Singh A, Poczos B, Grafton ST, Erickson KI, Tseng WY, Verstynen TD. Quantifying differences and similarities in whole-brain white matter architecture using local connectome fingerprints. PLoS computational biology. 2016 Nov 15;12(11):e1005203.
12. Van Essen DC, Smith SM, Barch DM, Behrens TE, Yacoub E, Ugurbil K, Wu-Minn HCP Consortium. The WU-Minn human connectome project: an overview. Neuroimage. 2013 Oct 15;80:62-79.
13. Glasser MF, Coalson TS, Robinson EC, Hacker CD, Harwell J, Yacoub E, Ugurbil K, Andersson J, Beckmann CF, Jenkinson M, Smith SM. A multi-modal parcellation of human cerebral cortex. Nature. 2016 Aug;536(7615):171.
14. Barch DM, Burgess GC, Harms MP, Petersen SE, Schlaggar BL, Corbetta M, Glasser MF, Curtiss S, Dixit S, Feldt C, Nolan D. Function in the human connectome: task-fMRI and individual differences in behavior. Neuroimage. 2013 Oct 15;80:169-89.
15. Sabuncu MR, Ge T, Holmes AJ, Smoller JW, Buckner RL, Fischl B, Alzheimer's Disease Neuroimaging Initiative. Morphometricity as a measure of the neuroanatomical signature of a trait. Proceedings of the National Academy of Sciences. 2016 Sep 27;113(39):E5749-56.
16. Efron B. Bootstrap methods: another look at the jackknife annals of statistics 7: 1–26. View Article PubMed/NCBI Google Scholar. 1979.
17. Lafayette L, Sauter G, Vu L, Meade B. Spartan Performance and Flexibility: an HPC‐Cloud Chimera. OpenStack Summit. 2016 Oct 27; Barcelona. doi: 10.4225/49/58ead90dceaaa.
Figures