1835
Identifying RSN-like spatially covarying sources in synaptic density PET (11C-UCB-J) with independent component analysis1Radiology and Biomedical Imaging, Yale University, New Haven, CT, United States, 2Psychiatry, Yale School of Medicine, New Haven, CT, United States
Synopsis
Resting-state networks, functionally connected brain regions, are canonically investigated with resting-state functional-MRI. 11C-UCB-J is a recently developed PET tracer that binds and visualizes synaptic vesicle protein 2A. The aim is to identify networks of coherent 11C-UCB-J covariation patterns using independent component analysis. We find modest similarity between five 11C-UCB-J PET-based synaptic density sources and rs-fMRI template RSNs. In several sources, there are varying rates of age-related change in subject loading weight, consistent with functional changes in RSNs and age-related gray matter decline. Our findings support the independency of such networks and potential physiological links between synaptic density and brain function.
Introduction
Resting-state networks (RSN) are systems of brain regions that are functionally connected during rest and during task performance1. First identified in resting-state functional-MRI (rs-fMRI) studies based on blood-oxygen-level-dependent (BOLD) signal, RSNs have also been found in 18F-FDG PET, a tracer for glucose metabolism2,3.11C-UCB-J is a recently developed PET tracer that binds to synaptic vesicle protein 2A (SV2A)4,5. SV2A is the most monodispersed synaptic vesicle protein and is thus a useful measure of synaptic density. It holds promise for investigating network-based brain organization through examination of regional covariance in synaptic density that may arise from patterns of coherent neural activity.
Independent component analysis (ICA) is a data‐driven approach that identifies signal covariation patterns, extracting maximally independent components associated with underlying signal sources, avoiding bias from a priori ROI selection.
The aim is to identify and validate networks of coherent 11C-UCB-J covariation patterns. We hypothesize that sources of synaptic density covariation are spatially similar to RSNs, based on biological commonality with neural activity as measured by BOLD-signal (rs-fMRI) and/or glucose metabolism (18F-FDG PET).
Methods
Eighty healthy subjects (47 men/33 women, 45±17 y, range: 21-82 y) were administered an i.v. injection of 11C-UCB-J (551.00±173.32 MBq; injected mass: 1.57±1.04 µg). PET scans (207 slices, 1.2 mm slice separation, reconstructed image resolution ~3 mm) were acquired in list mode. Parametric volume of distribution (VT) images of 0-60 min data were generated with a compartment model using the metabolite-corrected arterial plasma curve5 and transformed into MNI152 template space. Subjects also underwent a MPRAGE T1-weighted MR sequence.ICA was performed using the source-based morphometry (SBM) module of the Group ICA Toolbox (http://trendscenter.org/software/gift/). VT images were concatenated to form a subject series for extraction of independent components of 11C-UCB-J covariation across the sample. In line with previous FDG ICA, 18 components were extracted by ICA and iterated 20 times using ICASSO to assess stability of identified components6.
Subject loadings for each component were assessed with a one-sample t-test to assess whether they contributed significantly to the VT mixture. Out of the 18 sources, 17 were found to be significantly non-zero and thus were included in subsequent analysis. Spatial source maps were thresholded (z-score=2.0). Overlap between binarized maps and rs-fMRI-based RSN template7 was quantified with Dice similarity coefficient. Correlational analyses were performed to examine relationships between source intensities and subject age. Changes in loading weight relative to age are reported as percent reduction-per-decade (RPD, %). Statistical analyses performed were Bonferroni corrected for multiple comparisons.
Results
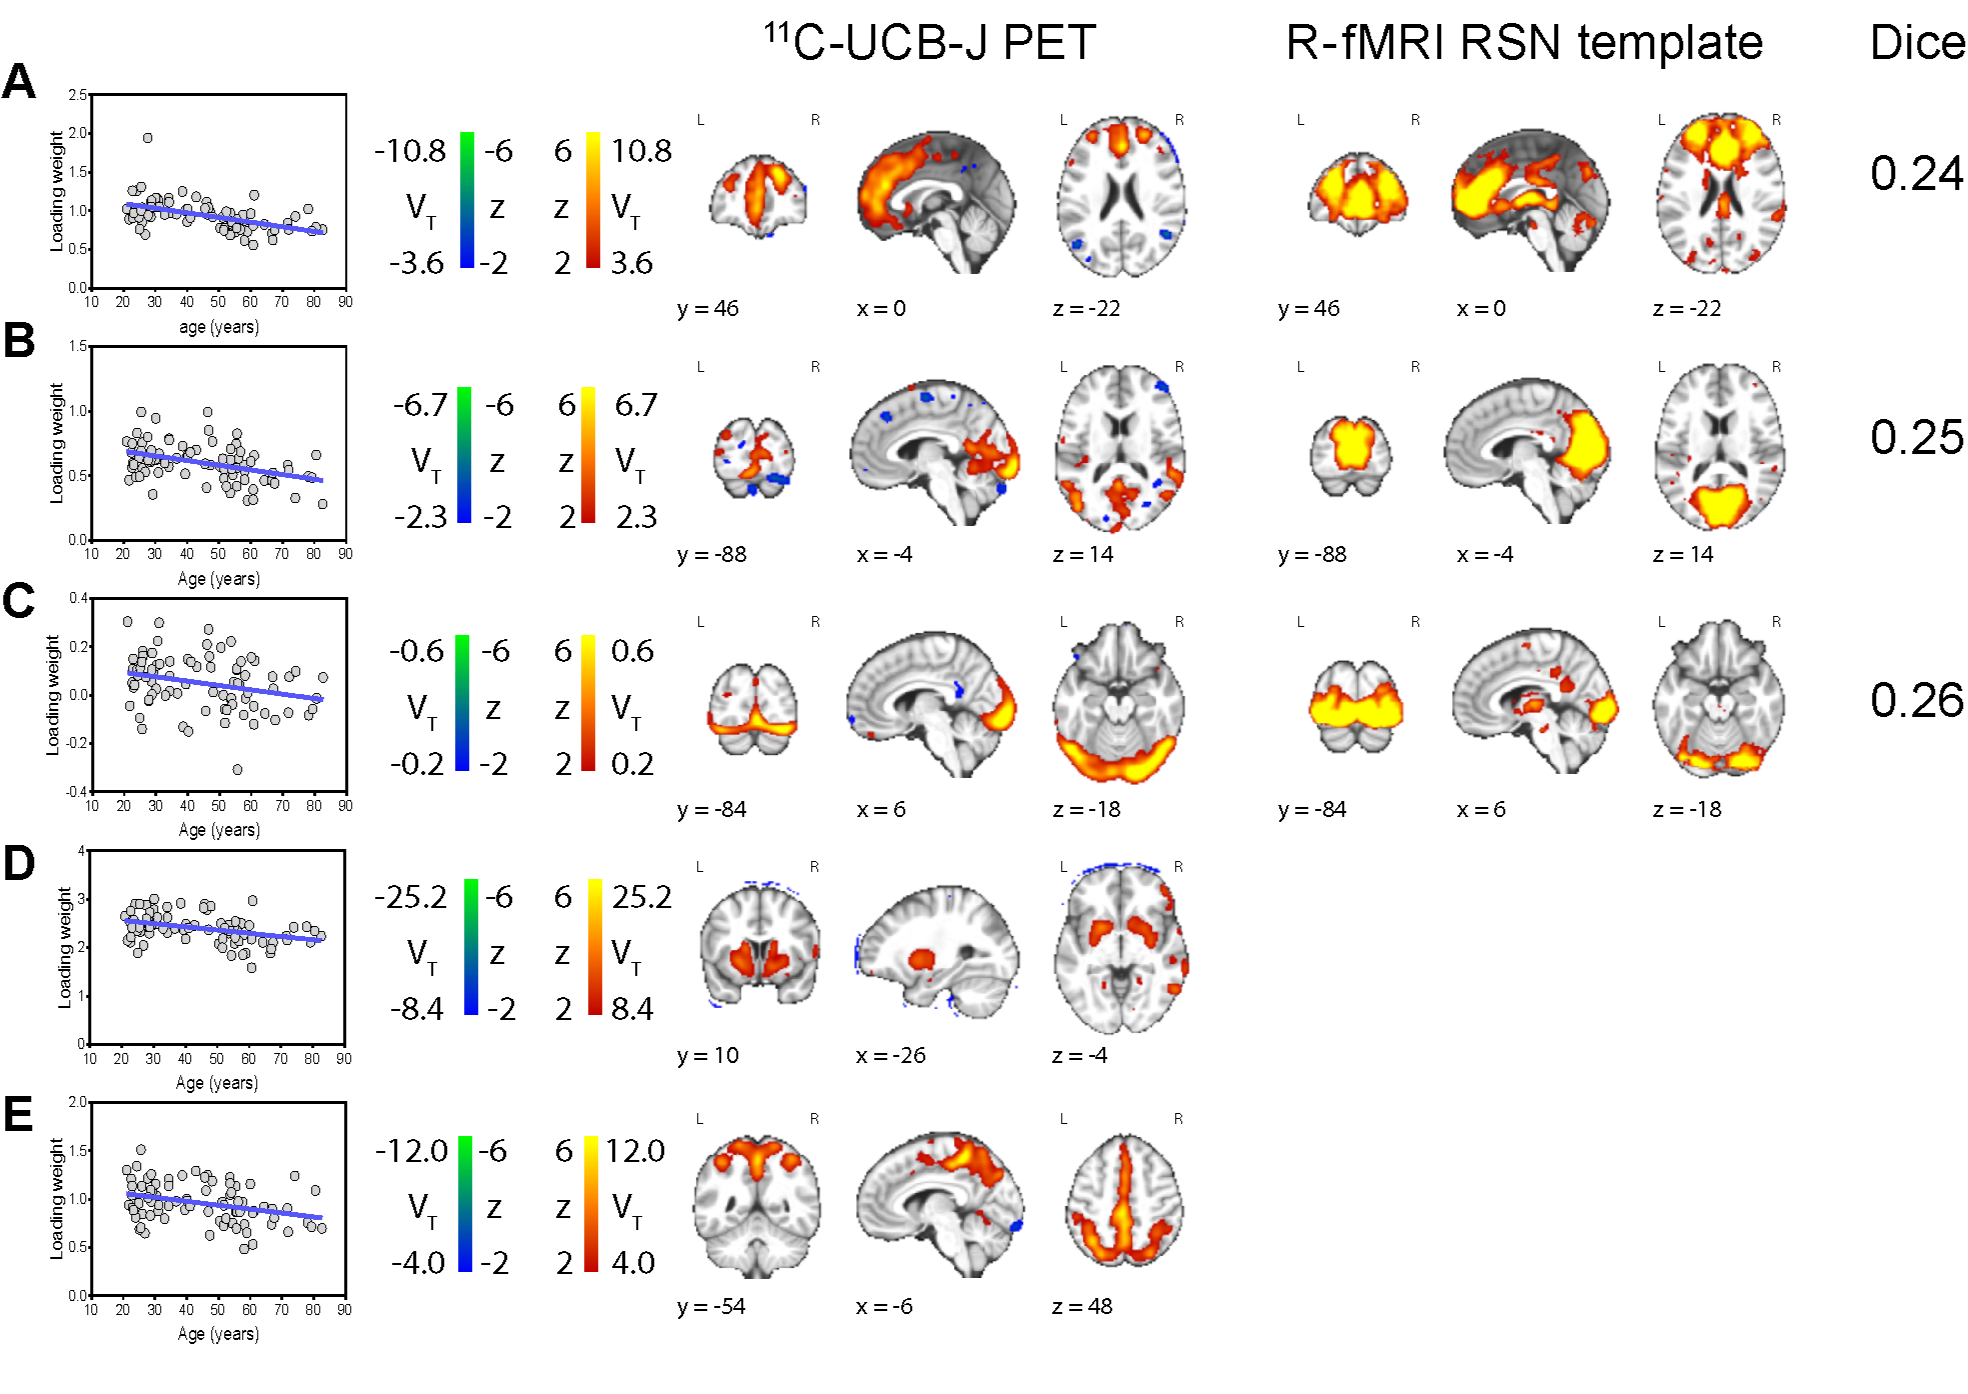
Of the 17 components of 11C-UCB-J covariance that significantly contributed to the overall mixture, five had spatial sources that were regionally similar to RSNs (Fig. 1). Three visually matched RSNs from the template. Identified networks of 11C-UCB-J covariation matching the RSN template were identified followed: executive control (A), medial occipital (B), and the occipital network (C). Spatial overlap was moderate: (A, Dice = 0.24), medial occipital (B, Dice = 0.25), and occipital (C, Dice = 0.26). Low Dice coefficients are expected due to the larger extent of source maps of the RSN template8.The remaining two 11C-UCB-J components (D, E) were visually identified as similar to a striatal/limbic network (J)9, and a mesial/parietal network found previously only in FDG ICA (K)2,3. Remaining components represented various networks of regions consistent with coherent grey matter covariance and other subregions of the cerebellum and frontal and temporal cortices that warrant additional investigation.
Four out of five spatial sources identified as visually resembling RSNs were significantly related to age (Fig 1., left): executive control (A, R2 = 0.26, p < 0.0001, RPD = 6.01%), medial occipital (B, R2 = 0.17, p = 0.0001, RPD = 3.62%), striatal (D, R2 = 0.14, p = 0.0006, RPD = 6.67%), and the mesial/parietal network (E, R2 = 0.11, p = 0.0024, RPD = 4.05%).
Discussion
We present a data-driven analysis identifying networks synaptic density from 11C-UCB-J PET in healthy individuals. Modest similarity exists between 11C-UCB-J networks and rs-fMRI template RSNs. In seven spatial sources of synaptic density, there are varying rates of age-related change in subject loading weight. Age-related changes are consistent with functional changes in RSNs10 and with age-related grey matter decline11. Our findings support the independency of such networks and provide evidence of potential physiological links between synaptic density and brain function in some, but not all, established RSN networks. Analysis is ongoing of paired rs-fMRI acquired within a subset of the population. In addition to the neurobiological significance of this study, the age-related findings in loading weights demonstrate the potential for clinical applications, for example, in differential diagnosis of neurodegenerative disorders.Acknowledgements
No acknowledgement found.References
1 Raichle ME, MacLeod AM, Snyder AZ, Powers WJ, Gusnard DA, Shulman GL. A default mode of brain function. Proc Natl Acad Sci U S A 2001; 98: 676–82.
2 Di X, Biswal, and Alzheimer’s Disease Neu BB, Biswal BB, Neuroimaging Initiative D. Metabolic Brain Covariant Networks as Revealed by FDG-PET with Reference to Resting-State fMRI Networks. Brain Connect 2012; 2: 275–283.
3 Savio A, Fünger S, Tahmasian M, Rachakonda S, Manoliu A, Sorg C et al. Resting-State Networks as Simultaneously Measured with Functional MRI and PET. J Nucl Med 2017; 58: 1314–1317.
4 Finnema SJ, Nabulsi NB, Eid T, Detyniecki K, Lin SF, Chen MK et al. Imaging synaptic density in the living human brain. Sci Transl Med 2016; 8: 348ra96.
5 Finnema SJ, Nabulsi NB, Mercier J, Lin SF, Chen MK, Matuskey D et al. Kinetic evaluation and test–retest reproducibility of [11C]UCB-J, a novel radioligand for positron emission tomography imaging of synaptic vesicle glycoprotein 2A in humans. J Cereb Blood Flow Metab 2018; 38: 2041–2052.
6 Himberg J, Hyvärinen A, Esposito F. Validating the independent components of neuroimaging time series via clustering and visualization. Neuroimage 2004; 22: 1214–1222.
7 Smith SM, Fox PT, Miller KL, Glahn DC, Fox PM, Mackay CE et al. Correspondence of the brain’s functional architecture during activation and rest. Proc Natl Acad Sci 2009; 106: 13040–13045.
8 Jamadar SD, Ward PG, Li S, Sforazzini F, Baran J, Chen Z et al. Simultaneous task-based BOLD-fMRI and [18-F] FDG functional PET for measurement of neuronal metabolism in the human visual cortex. Neuroimage 2019; 189: 258–266.
9 Allen EA, Erhardt EB, Damaraju E, Gruner W, Segall JM, Silva RF et al. A Baseline for the Multivariate Comparison of Resting-State Networks. Front Syst Neurosci 2011; 5: 1–23.
10 Betzel RF, Byrge L, He Y, Goñi J, Zuo XN, Sporns O. Changes in structural and functional connectivity among resting-state networks across the human lifespan. Neuroimage 2014; 102: 345–357.
11 Ziegler G, Dahnke R, Jäncke L, Yotter RA, May A, Gaser C. Brain structural trajectories over the adult lifespan. Hum Brain Mapp 2012; 33: 2377–2389.
Figures