1832
In-vivo imaging of current induced magnetic fields during High Definition transcranial direct current stimulation (HD-tDCS)1University of Southern California, Los Angeles, CA, United States
Synopsis
High-definition transcranial direct current stimulation (HD-tDCS) is an emerging neuromodulation technique that uses a multi-electrode montage to focally modulate regional brain activities. However, the effects of stimulation have been shown to be variable across subjects, and efforts to investigate this have been hampered by an inability to visualize the electric current distribution in-vivo. To address this, we developed a MR technique that maps the tDCS current induced magnetic fields in-vivo. The measured fields were robust (avg. ICC = 0.69) and show different hotspot-locations between subjects, potentially demonstrating the sensitivity of this technique to track individual differences in responses to HD-tDCS.
Introduction
Transcranial direct current stimulation (tDCS) is a neuromodulation technique that has been shown to improve symptoms in range of neurologic and psychiatric disorders (1). Typical tDCS montages utilize a pair of relatively large electrodes (~35 cm2) to deliver diffuse electric currents to the brain. In contrast, high-definition transcranial direct current stimulation (HD-tDCS) (2) uses a multi-electrode montage to deliver comparatively focal electric currents. Although HD-tDCS has been shown to induce changes in cortical excitability (as measured by changes in motor-evoked potentials) (3); the effects of stimulation have been shown to be variable across subjects (4). Efforts to investigate this variability have been hampered by an inability to visualize the electric current distribution in-vivo. To address this, we developed a MR technique that maps the HD-tDCS current induced magnetic fields (a direct marker of the applied current) in-vivo, in individual subjects.Methods
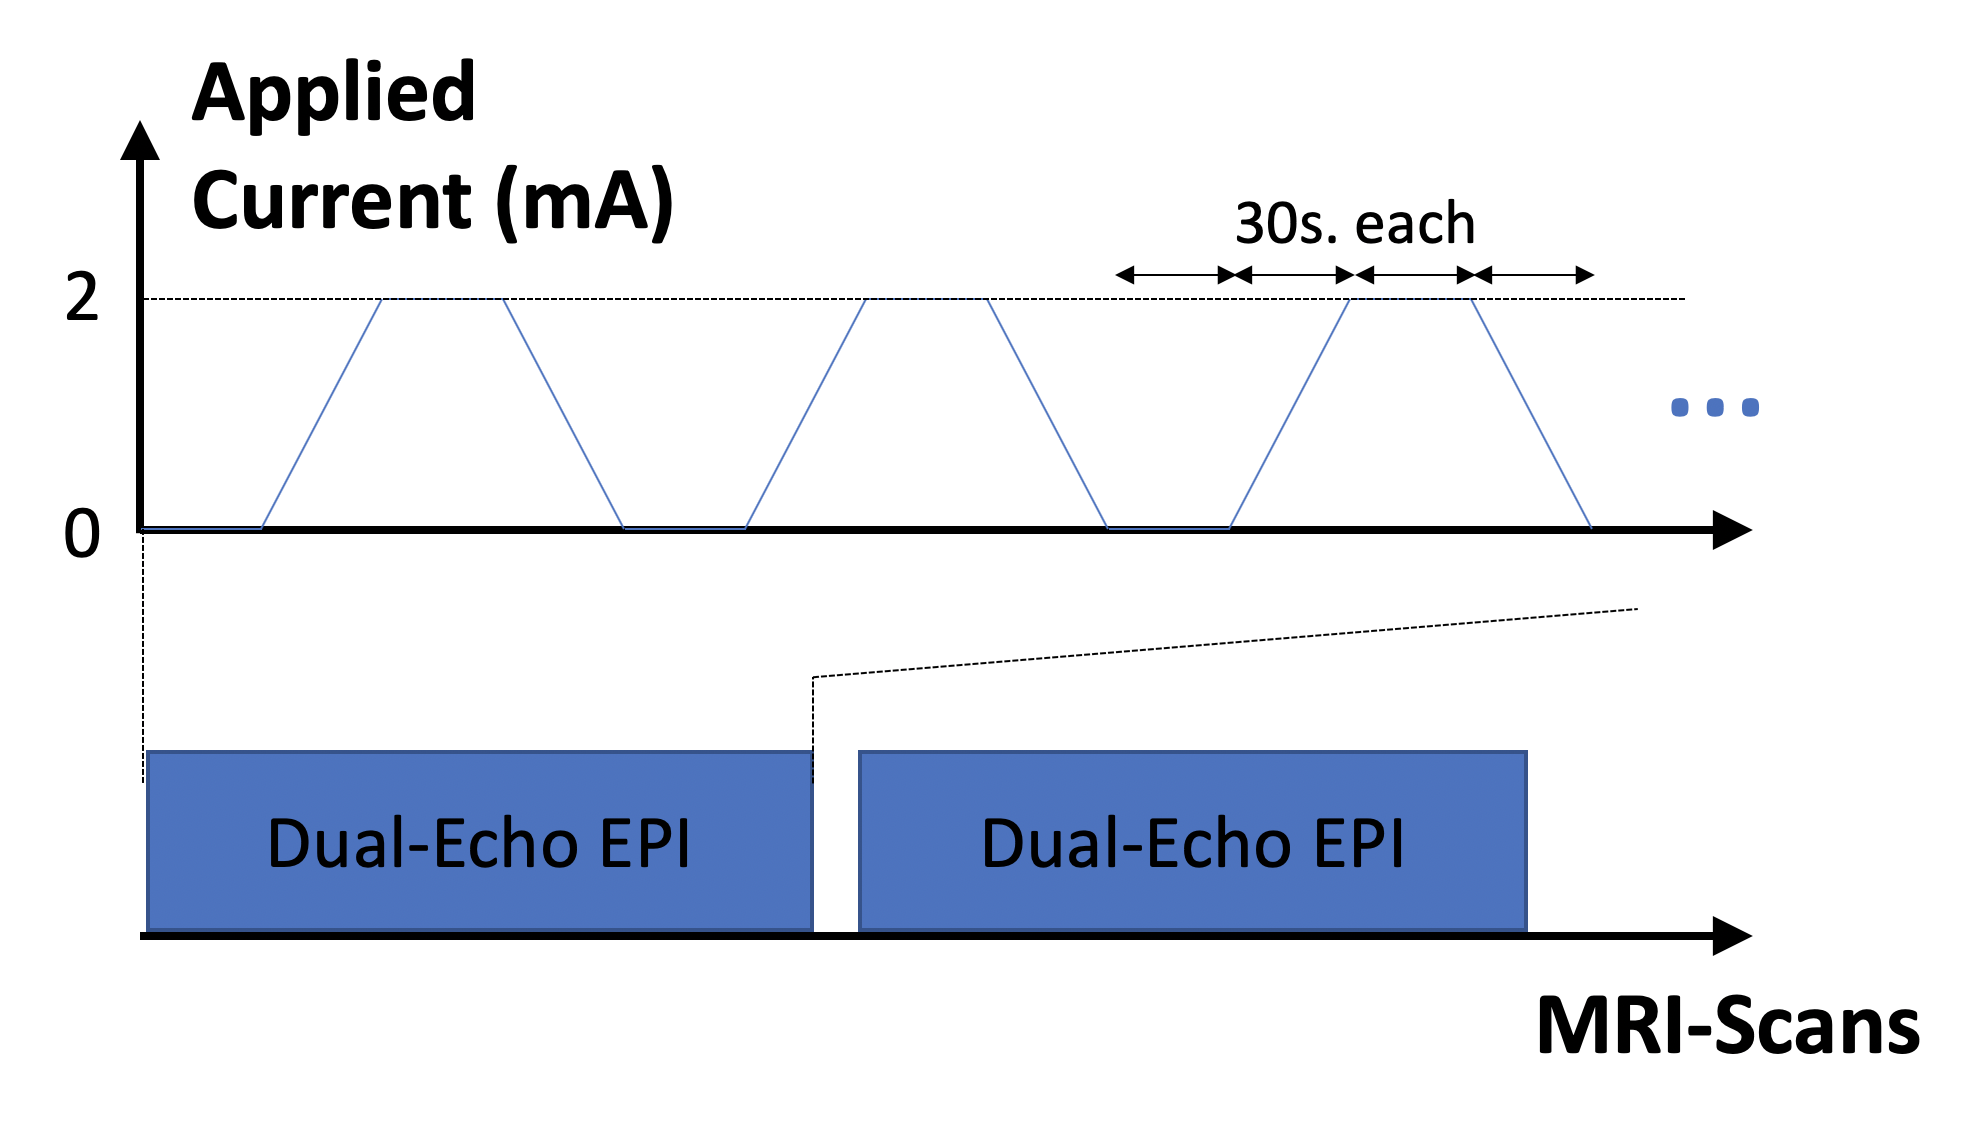
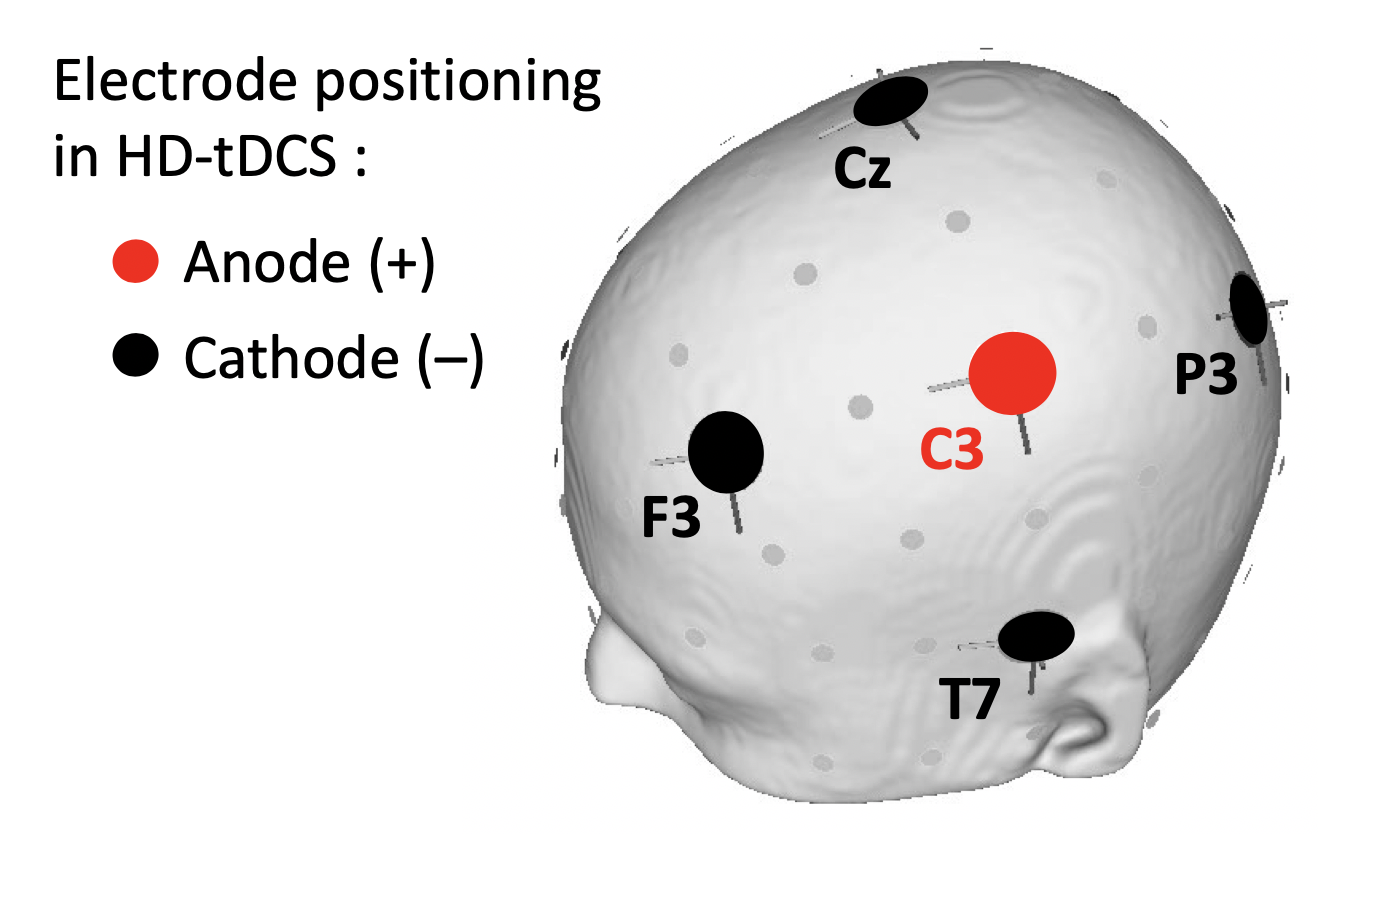
Figure 1 shows the experimental design. MRI data was acquired from two back-to-back identical test-retest sessions on a 3T Siemens PRISMA MRI scanner. Each session consisted of two dual-echo EPI scans (Scan parameters: TE1/TE2 = 11/26 ms, TR = 2s, 900 FA, 3.4x3.4x4 mm3 voxel, 35 slices (ascending), 2365 Hz/Px bandwidth, 7/8 partial Fourier, GRAPPA acceleration R=2, TA = 12.5 min, 20 channel coil). The accuracy and reliability of current induced magnetic fields measured using these scan parameters has previously been demonstrated in a phantom (5). For the HD-tDCS stimulation, a 4x1 electrode montage was employed, with the central anode electrode placed on C3 (10-20 EEG coordinates), and each of the peripheral cathodes carrying one-fourth of the applied current placed on T7, F3, Cz and P3 respectively (shown in Figure 2). During each scan, electric currents were applied in blocks of 30 seconds with a ramp time of 30 seconds. Data was acquired from 5 subjects (3M).Acquired phase data at the 2nd echo accumulates excessive wraps. Consequently, phase data was unwrapped using a region growth algorithm that utilized information from both the spatial as well as the temporal dimension (i.e. the first echo, where phase wraps are not as severe). The unwrapped data was realigned to the first volume to correct for motion using SPM12. Finally, the phase time-series at each voxel was modeled using a general linear model (GLM) with the applied current as predictor, and nuisance regressors including the 6 motion parameters, global signal fluctuations and regressors accounting for level shifts. The slope of this model fit can be interpreted as the measured current induced magnetic field per mA applied current. These measured fields were compared between test and retest sessions using the intra class correlation coefficient (ICC).
Results
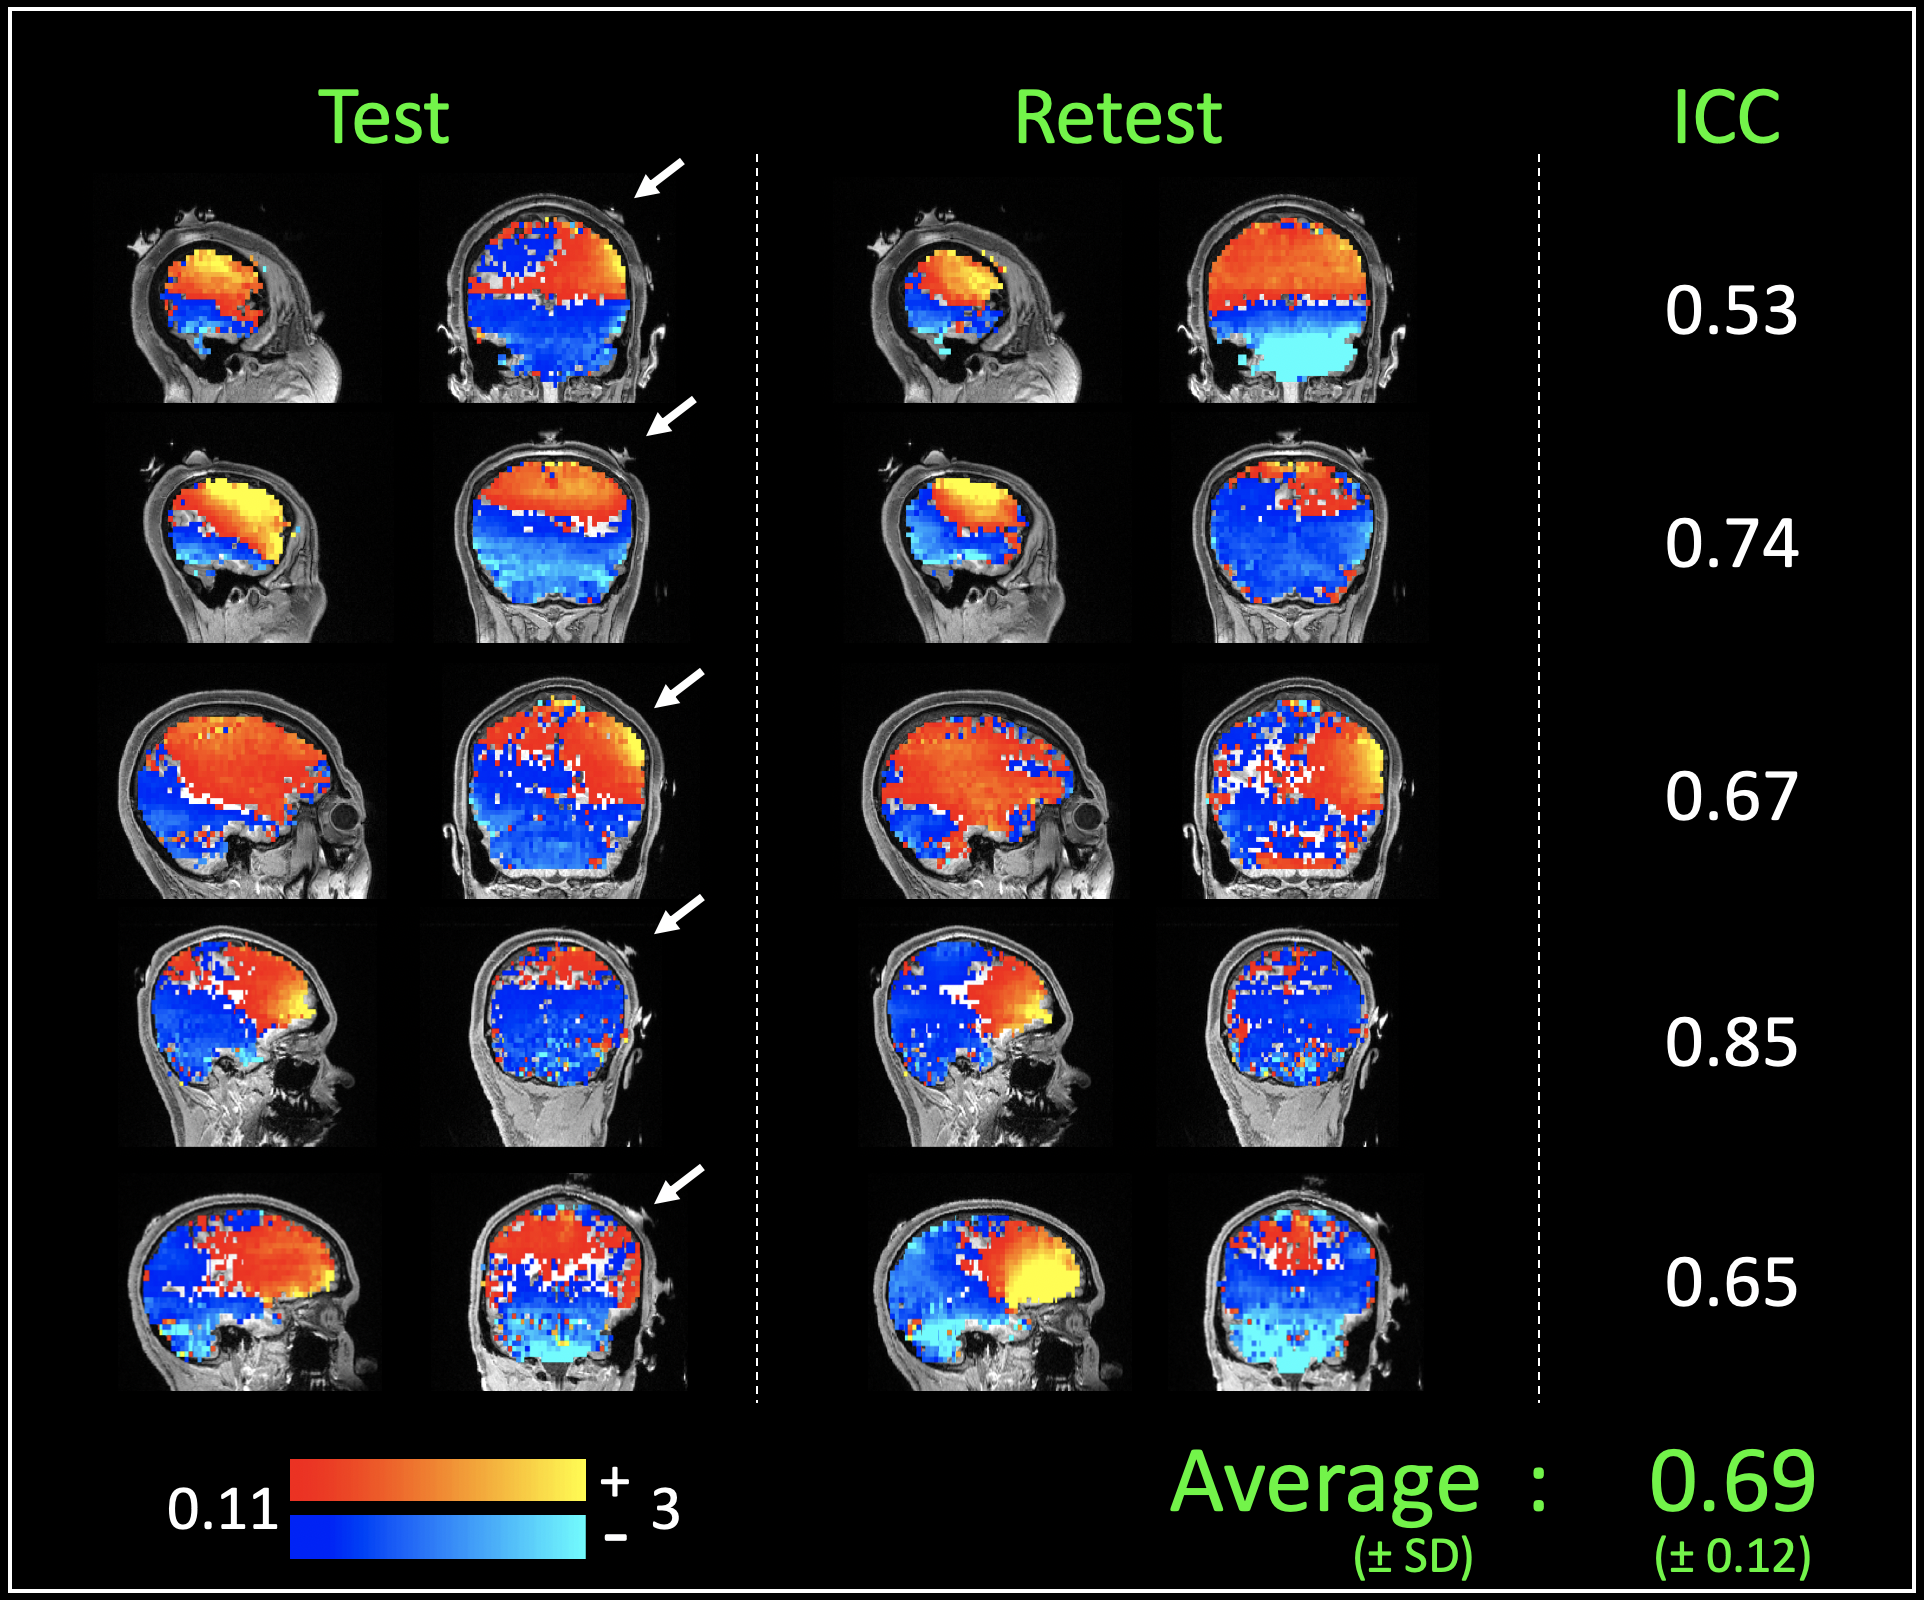
Figure 3 shows the current induced magnetic fields measured in each subject (test, retest in columns 1 and 2 respectively, and the intra class correlation coefficient in column 3). The measured fields were observed to be fairly reliable within-subjects, with an average intraclass correlation of 0.69 (± 0.12). Additionally, discrepancies in the distribution of the current-induced magnetic fields were observed between subjects. As shown in figure 3, the first three subjects showed current-induced magnetic field hotspots near the stimulating electrode, while the last two showed hotspots in the inferior frontal brain region.Discussion and Conclusion
In this work, we demonstrate in-vivo measurements of the HD-tDCS current induced magnetic fields in individual subjects. The measured fields were observed to be robust, with an average ICC of 0.69. Because (i) the induced fields are directly proportional to the applied current (Ampere’s Law), and (ii) the constant of proportionality is stable on the order of ppm between tissues (6), the measured fields could potentially serve as direct markers of the applied current. Indeed, current induced magnetic field hotspots were observed near the central stimulating electrode in three of the five subjects.Interestingly, induced field hotspots in the remaining subjects were observed to be located in the inferior frontal region of the brain. Future research will investigate the spatial overlap of hotspots with predictions from state-of-the-art simulations that have been individualized to each subject. While the reasons for the variability in hotspot-location are still unclear, these findings are perhaps not unsurprising, considering the inter-subject variability reported in participants’ responses to tDCS (4).
Acknowledgements
No acknowledgement found.References
1. Kuo MF, Chen PS, Nitsche MA. The application of tDCS for the treatment of psychiatric diseases. International review of psychiatry. 2017;29(2):146-67.
2. Edwards D, Cortes M, Datta A, Minhas P, Wassermann EM, Bikson M. Physiological and modeling evidence for focal transcranial electrical brain stimulation in humans: a basis for high-definition tDCS. NeuroImage. 2013;74:266-75.
3. Kuo HI, Bikson M, Datta A, Minhas P, Paulus W, Kuo MF, et al. Comparing cortical plasticity induced by conventional and high-definition 4 x 1 ring tDCS: a neurophysiological study. Brain stimulation. 2013;6(4):644-8.
4. Li LM, Uehara K, Hanakawa T. The contribution of interindividual factors to variability of response in transcranial direct current stimulation studies. Frontiers in cellular neuroscience. 2015;9:181.
5. Jog MA. Visualizing Transcranial Direct Current Stimulation (tDCS) in vivo using Magnetic ResonanceImaging. (Doctoral Dissertation) University of California Los Angeles, Permalink: https://escholarshiporg/uc/item/2kz1h3qb 2017.
6. Schenck JF. The role of magnetic susceptibility in magnetic resonance imaging: MRI magnetic compatibility of the first and second kinds. Medical physics. 1996;23(6):815-50.
Figures