1831
Quantitative measurement of cerebral blood flow in healthy volunteers and hypertension patients by multi-TI arterial spin labeling at 3 T MRI1Affiliated Hospital of Shaanxi University of Chinese Medicine, Shaanxi, China, 2MR senior scientific marketing specialist, Shaanxi, China, 3Shaanxi University of Chinese Medicine, Shaanxi, China
Synopsis
This study aimed to quantitative measurement of cerebral blood flow in different brain regions of different levels of blood pressure by mTI ASL. In the first part of this study, we evaluated the reproducibility of mTI-ASL in healthy subjects, and then mTI-ASL was used to evaluate 55 primary hypertension patients. There was no major variation between two consecutive mTI-ASL measurements in healthy volunteers. Furthermore, the rCBF and ATT values provided valuable information for the classification of hypertension, which can be used as a non-invasive quantitative monitoring MRI tool for hypertension progression.
Introduction
Hypertension influence brain by microvascular brain injury and induces cerebrovascular remodeling, but its direct influence on the cerebral circulation is not fully clear. The aim of this study was to quantitative measurement of cerebral blood flow in different brain regions of different levels of blood pressure by multi-TI arterial spin labeling (mTI-ASL) at 3 T MRI.Methods
Twenty healthy volunteers (10 male; mean age, 45 years; test-time blood pressure (BP) =110±11/73±8mmHg) and fifty-five patients with hypertension (30 male; mean age, 46 years; test-time BP=162±21 /99±10mmHg) were consecutively recruited in this study. All the MRI examination were performed on a 3T MR scanner (MAGNETOM Skyra, Siemens Healthcare, Erlangen, Germany) with a 32-channel head coil. The patients were divided into three groups according to the systolic blood pressure (SBP): grade 1 (n=20, SBP=149±10mmHg), grade 2 (n=20, SBP=171±9mmHg), grade 3 (n=15, SBP=187±8mmHg). The mTI-ASL images were acquired with the following parameters: TR/TE =3200/26 ms, FOV = 220×220 mm2, slice thickness = 4 mm, slices = 30, 4 TIs from 1000 to 2500 ms, and total acquisition time was 5 min. The relative cerebral blood flow (rCBF) and arterial transit time (ATT) values in various regions of interest (ROIs) were extracted from gray matter (frontal lobe, temporal lobe and occipital lobe), white matter(bilateral centrum semiovale, anterior and posterior horns of paraventricular white matter, genu and spleniu of corpus callosum), basal ganglia and thalamus. Independent-sample t test were performed to evaluate the significance of the inter-group difference in rCBF and ATT.Results
The rCBF was negatively correlated to BP,and ATT values, but positively correlated to BP. Except for the gray matter (frontal lobe, temporal lobe and occipital lobe), grade 1 hypertension patient showed significantly lower rCBF and ATT than the control group in each brain region (P<0.05). Compared with grade 1 hypertension, no significant differences of rCBF in bilateral centrum semiovale and corpus callosum, and the ATT in the bilateral centrum semiovale were found between patients with grade 1 and 2 hypertension(P > 0.05). Compared with grade 2, in addition to the anterior and posterior horns of paraventricular white matter, there were statistical differences in rCBF and ATT values of the other brain regions in grade 3 [YX1] (P < 0.05). [YX1]Look strangeDiscussion
Assessment of cerebral blood flow is of particular interest in hypertension due to the risk of microvascular brain injury and induces cerebrovascular remodeling. The traditional ASL has only one inversion time (TI). If the TI is not properly set, the marked arterial blood has not fully reached or has passed the imaging plane, resulting in decrease of CBF value. Our results suggested that the rCBF and ATT values obtained by mTI-ASL could quantitative reflect of the cerebral hemodynamics change in patients with hypertension.Conclusion
mTI-ASL has the ability to detect subtle hemodynamic abnormalities in hypertension at different stage. Quantitative rCBF and ATT values usage as a biomarker for disease progression in hypertension is potentially a powerful tool for longitudinal patient monitoring.Acknowledgements
NoneReferences
NoneFigures
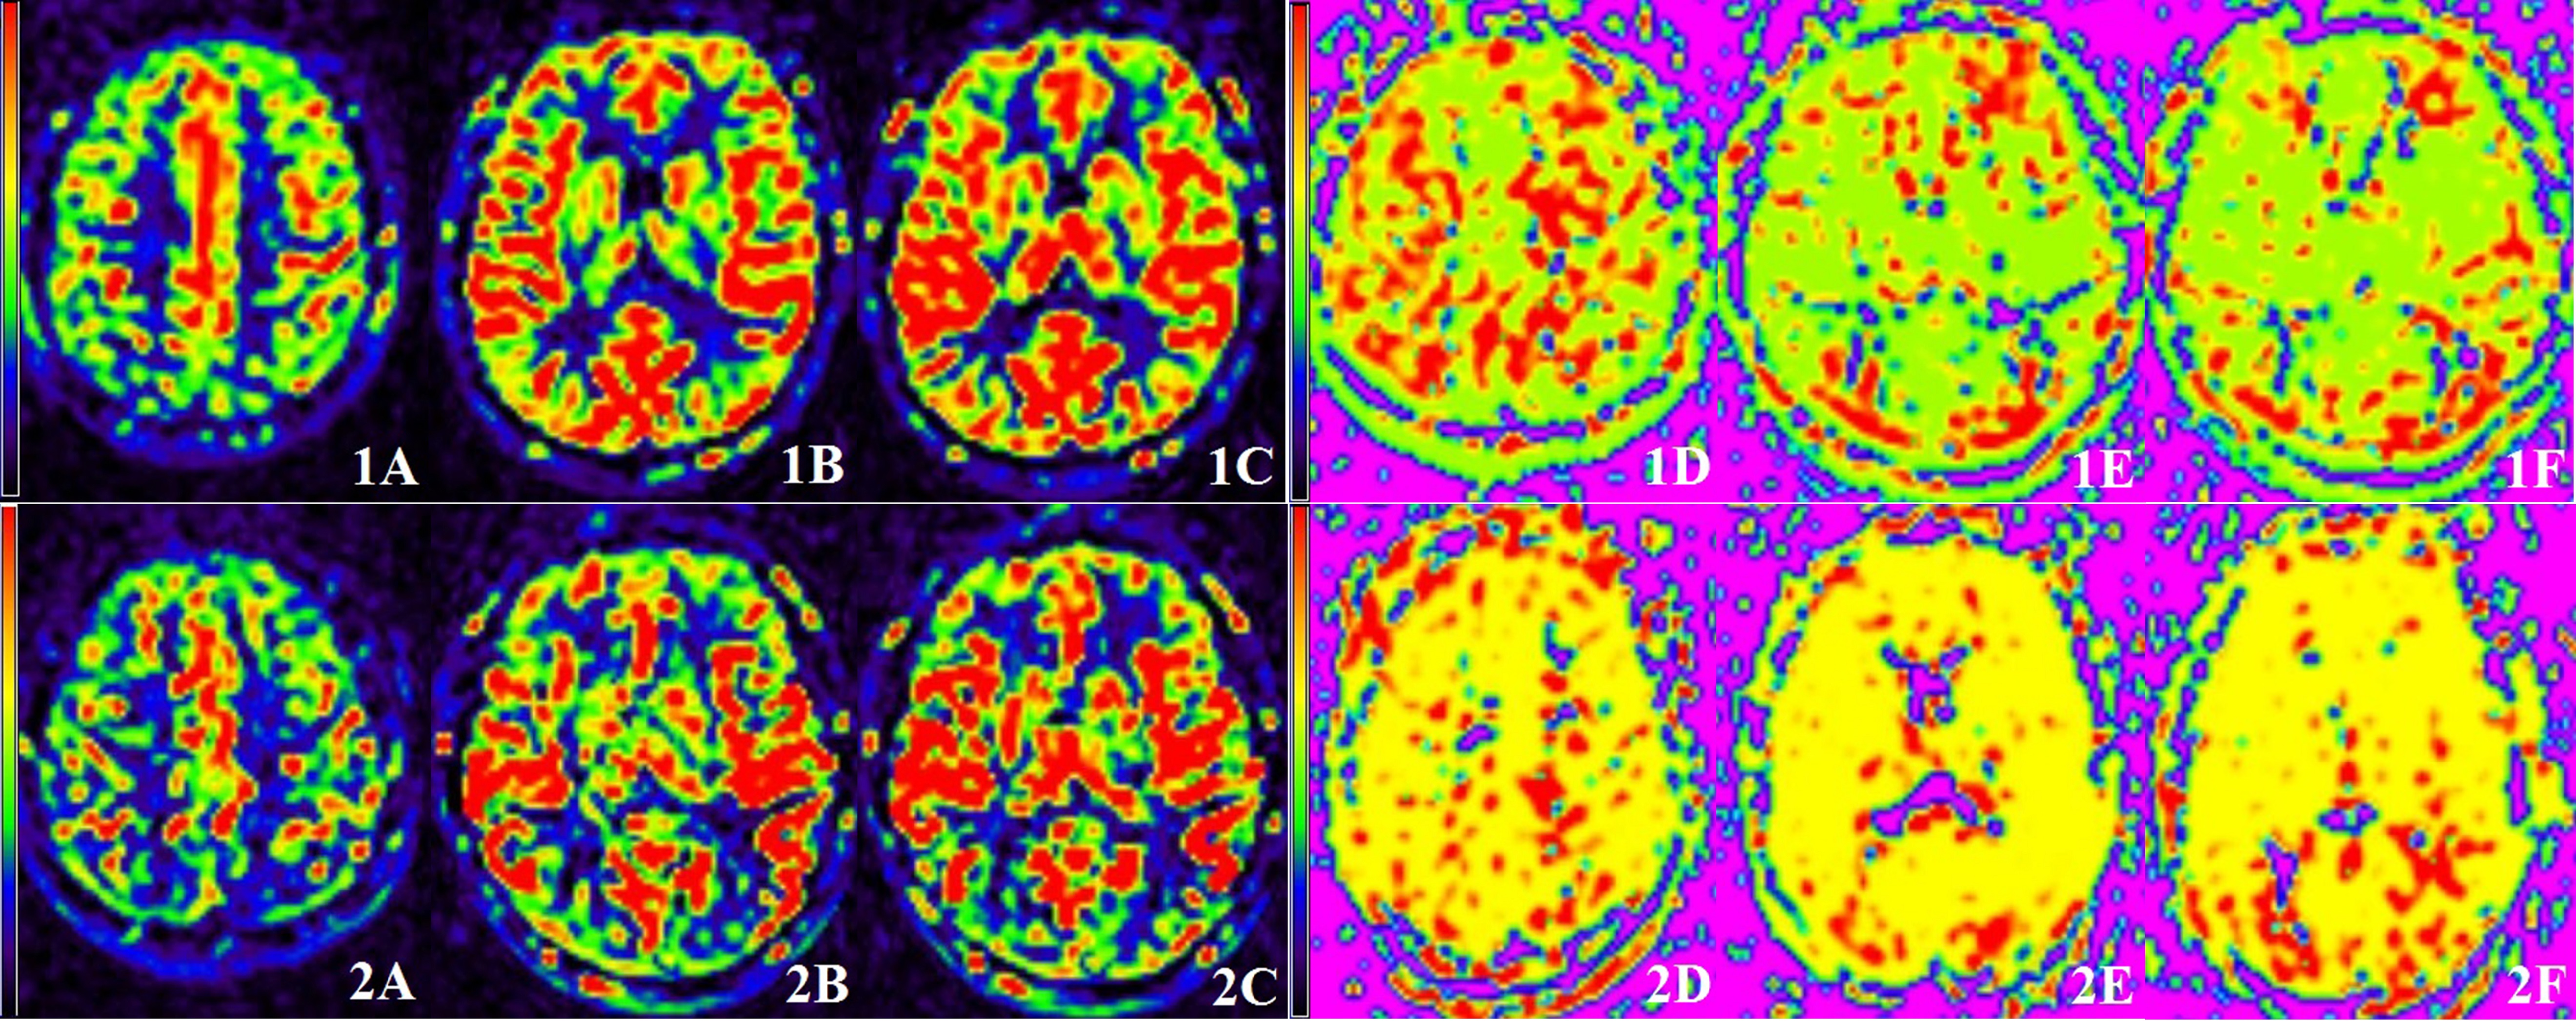
Figure 1. A 62-year-old healthy female, BP=110/75 mmHg, mTI-ASL reconstructed rCBF pseudo color map (1A-1C) and ATT pseudo color map (1D-1F). ROIs were placed in different brain regions.
Figure 2. A 60-year-old female hypertension patient with BP of 160/80 mmHg, rCBF pseudo color map (2A-2C) and ATT pseudo color map (2D-2F) obtained by mTI-ASL. Compared with the healthy, the rCBF decreased with the increase of BP,and the ATT values increased with the increase of BP.