1829
Quantitative Evaluate the Differential Between Cerebral Microbleeds and Calcification in Susceptibility Weight Imaging Mapping1Department of Radiology, Shanghai Fourth People's Hospital Affiliated to Tongji University School of Medicine, Shanghai, China
Synopsis
To quantitative assess the differential between cerebral microbleeds and calcification in susceptibility weight imaging mapping. We quantified the magnetic susceptibility value of calcifications and cerebral microbleeds(CMBs) in susceptibility weight imaging mapping. Significant difference of magnetic susceptibility value was found between them. The 95% confidence interval for the magnetic susceptibility value of the calcification and CMBs was different. The optimal threshold to detecting CMBs was selected by receiver operating characteristic. The conclusion was that magnetic susceptibility value can used to differential diagnose cerebral microbleeds and calcification in the susceptibility weighted imaging mapping.
INTRODUCTION
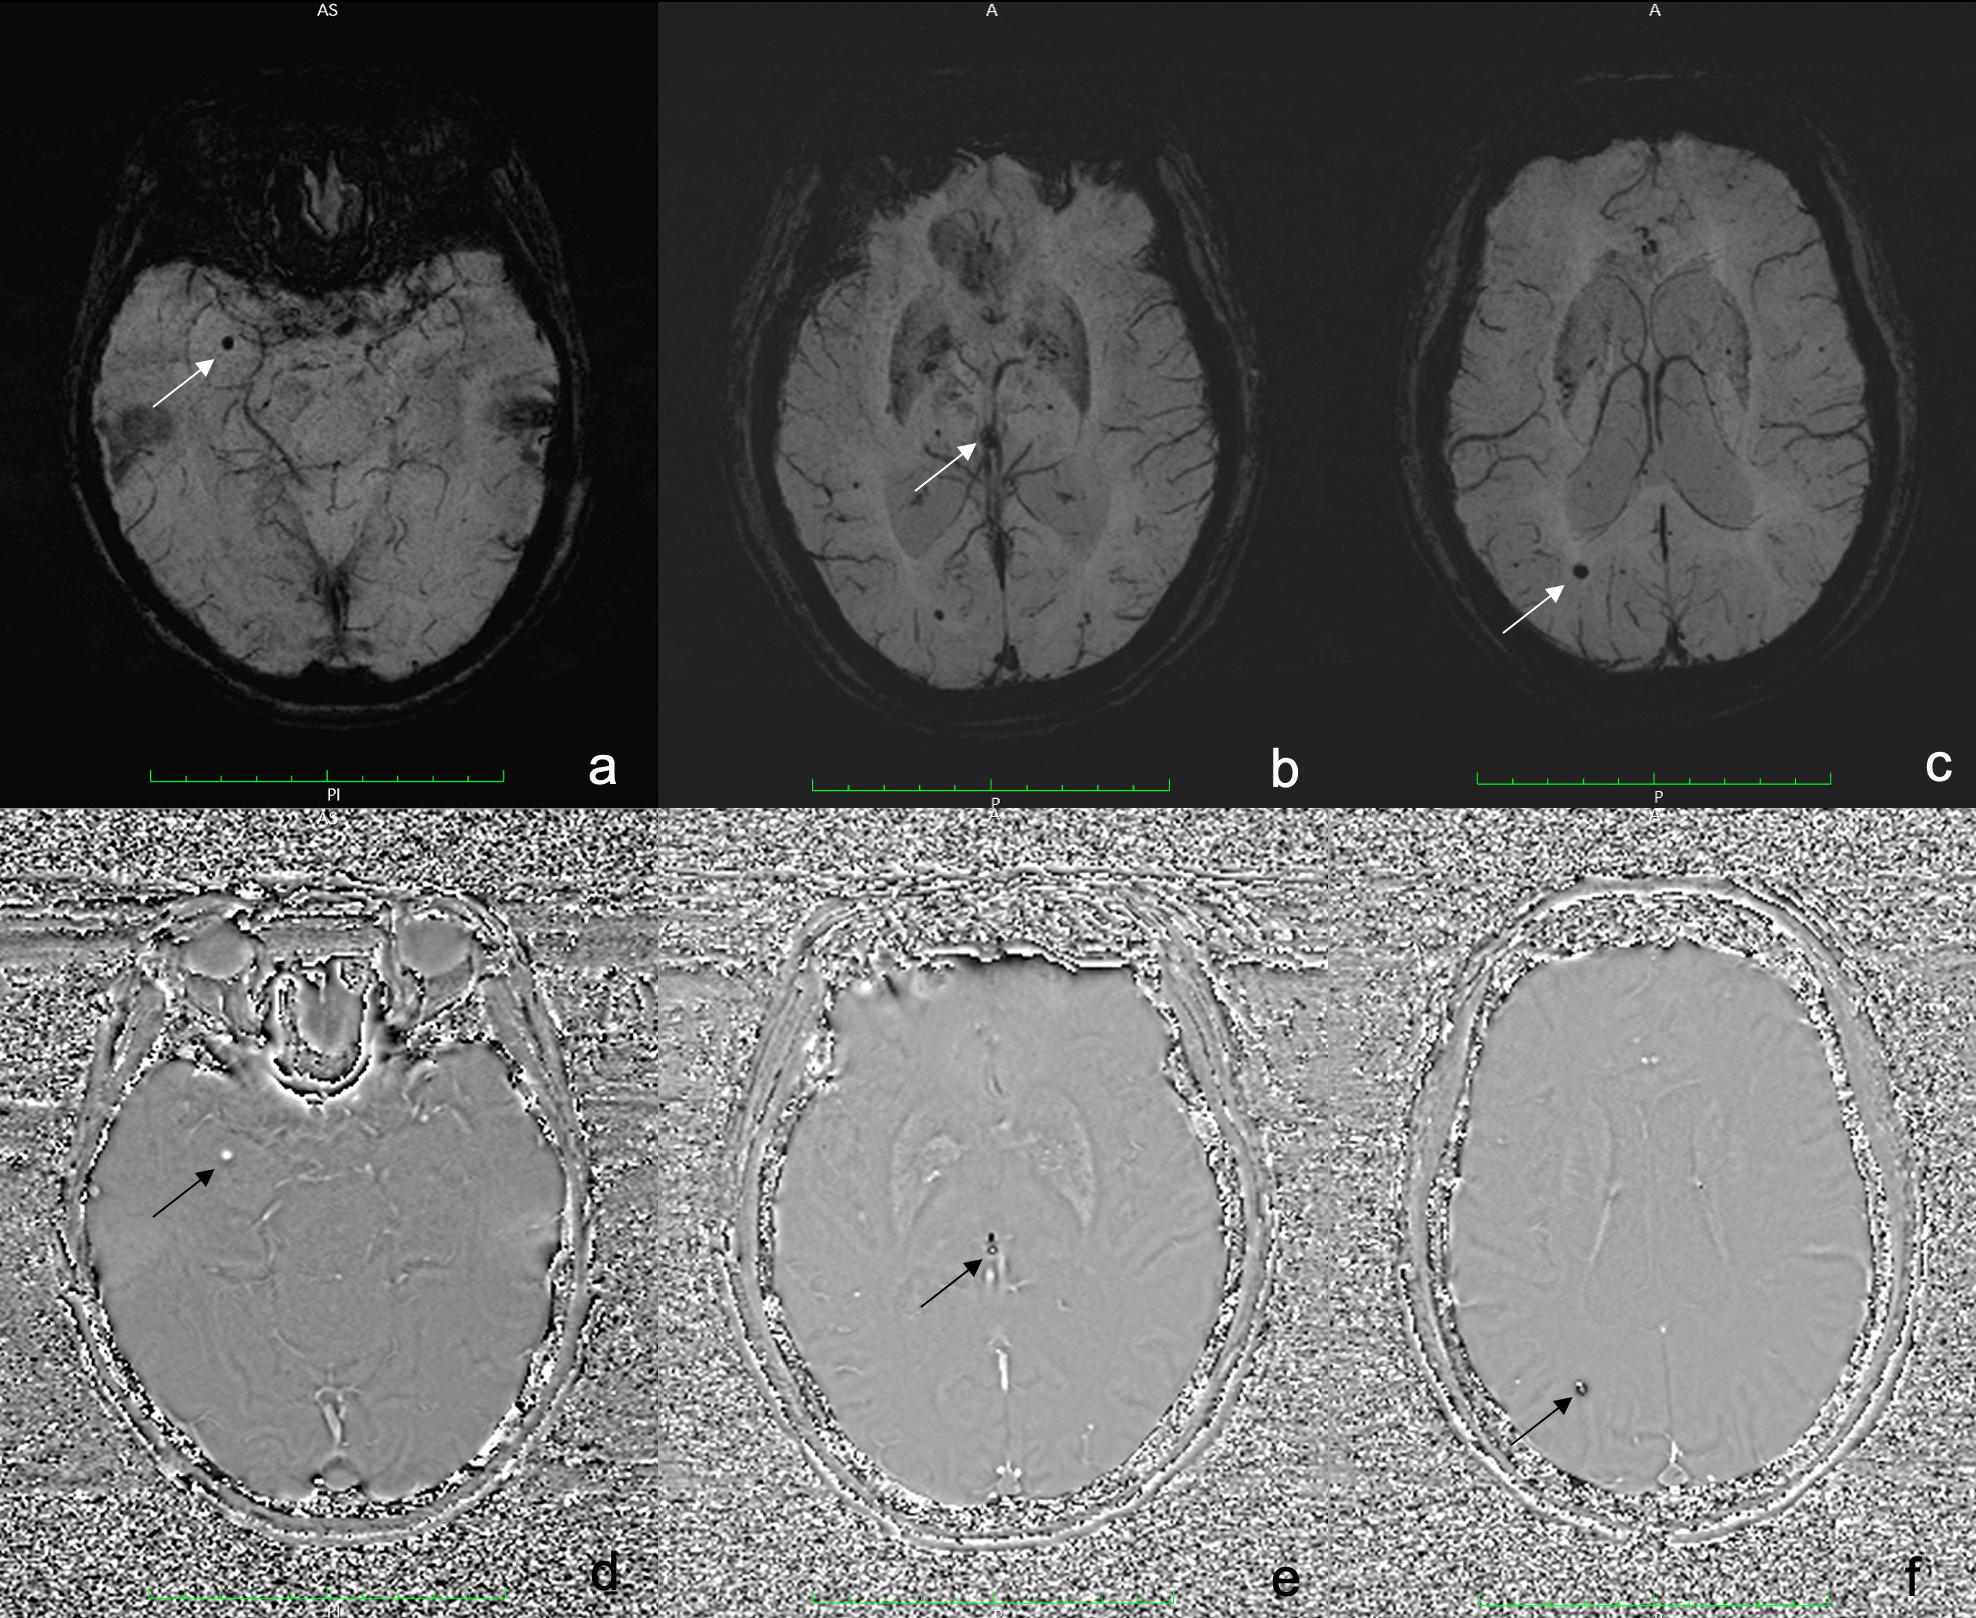
CMBs are small foci of chronic blood products in brain issue. The CMBs lesion were hemosiderin deposits around microvascular1. Although CMBs had no symptoms generally, it was associated with various diseases such as Alzheimer dementia2. How to detect CMBs accurately and reliably? There was not gold standard.The SWI was widely used for detecting CMBs thanks to its exquisite sensitivity to the susceptibility effects induced by blood products3. CMBs appear with small spherical hypointense regions in susceptibility images, as the same performance with calcifications. It has been noted that phase images are helpful in distinguishing between calcium and iron because calcifications tend to be diamagnetic and iron paramagnetic4,5. Nevertheless, due to different phase images of different manufacturers, the signal of CMBs and calcium in SWI phase images is variety. Furthermore, the differential between calcification and CMBs is not obviously sometimes in phase images especially if the shape of the lesion is not very regular. (Fig 1). This probably make radiologists confused and get wrong results.
Susceptibility weight imaging mapping (SWIM) was a new technique for quantifying magnetic susceptibility. It had already found various applications in quantifying in vivo iron content6. There is no published report to quantitatively evaluate the value of calcium and CMBs in SWIM. In this study, we quantified magnetic susceptibility value of calcifications and CMBs by SWIM. To assess the for differential of CMBs and calcification by comparing their magnetic sensitivity values.
METHODS
We consecutively enrolled patients from January 2015 to December 2018. All the patients underwent CT and MRI including DWI and SWI. CMBs were defined as small, rounded, well-defined hypointense lesions within the white matter of brain lobar with clear margins, ranging from 2 to 10 mm in size in SWI and DWI(b=0)images7. Calcification of pineal and choroid plexus were founded by using CT.We identified the calcification of pineal and choroid plexus in SWI images if these well-defined hypointense lesions were hyperdense on CT. All the calcifications and CMBs were quantified by their magnetic susceptibility value by SWIM. The SWIM was reconstructed with SWI magnitude-image and SWI phase-image. The CMBs should be hyperintense lesions associated with paramagnetic dipole effect, which was surrounded by normal parenchyma. The calcification should be hypointense lesions. Then we measured all the lesions including CMBs and calcifications by their magnetic susceptibility value in SWIM.
The independent-samples t test and Mann Whitney U test were used to statistically analyze the mean and median of magnetic susceptibility value between CMBs and calcifications, respectively. The one-sample t test was used to statistically analyze the 95% confidence interval for the magnetic susceptibility value of the calcification and CMBs, respectively. The receiver operating characteristic and area under curve were used to select the optimal threshold based on both the sensitivity and the specificity. All statistical analyses were two-tailed, p value < 0.05 was considered to indicate a significant difference.
RESULTS
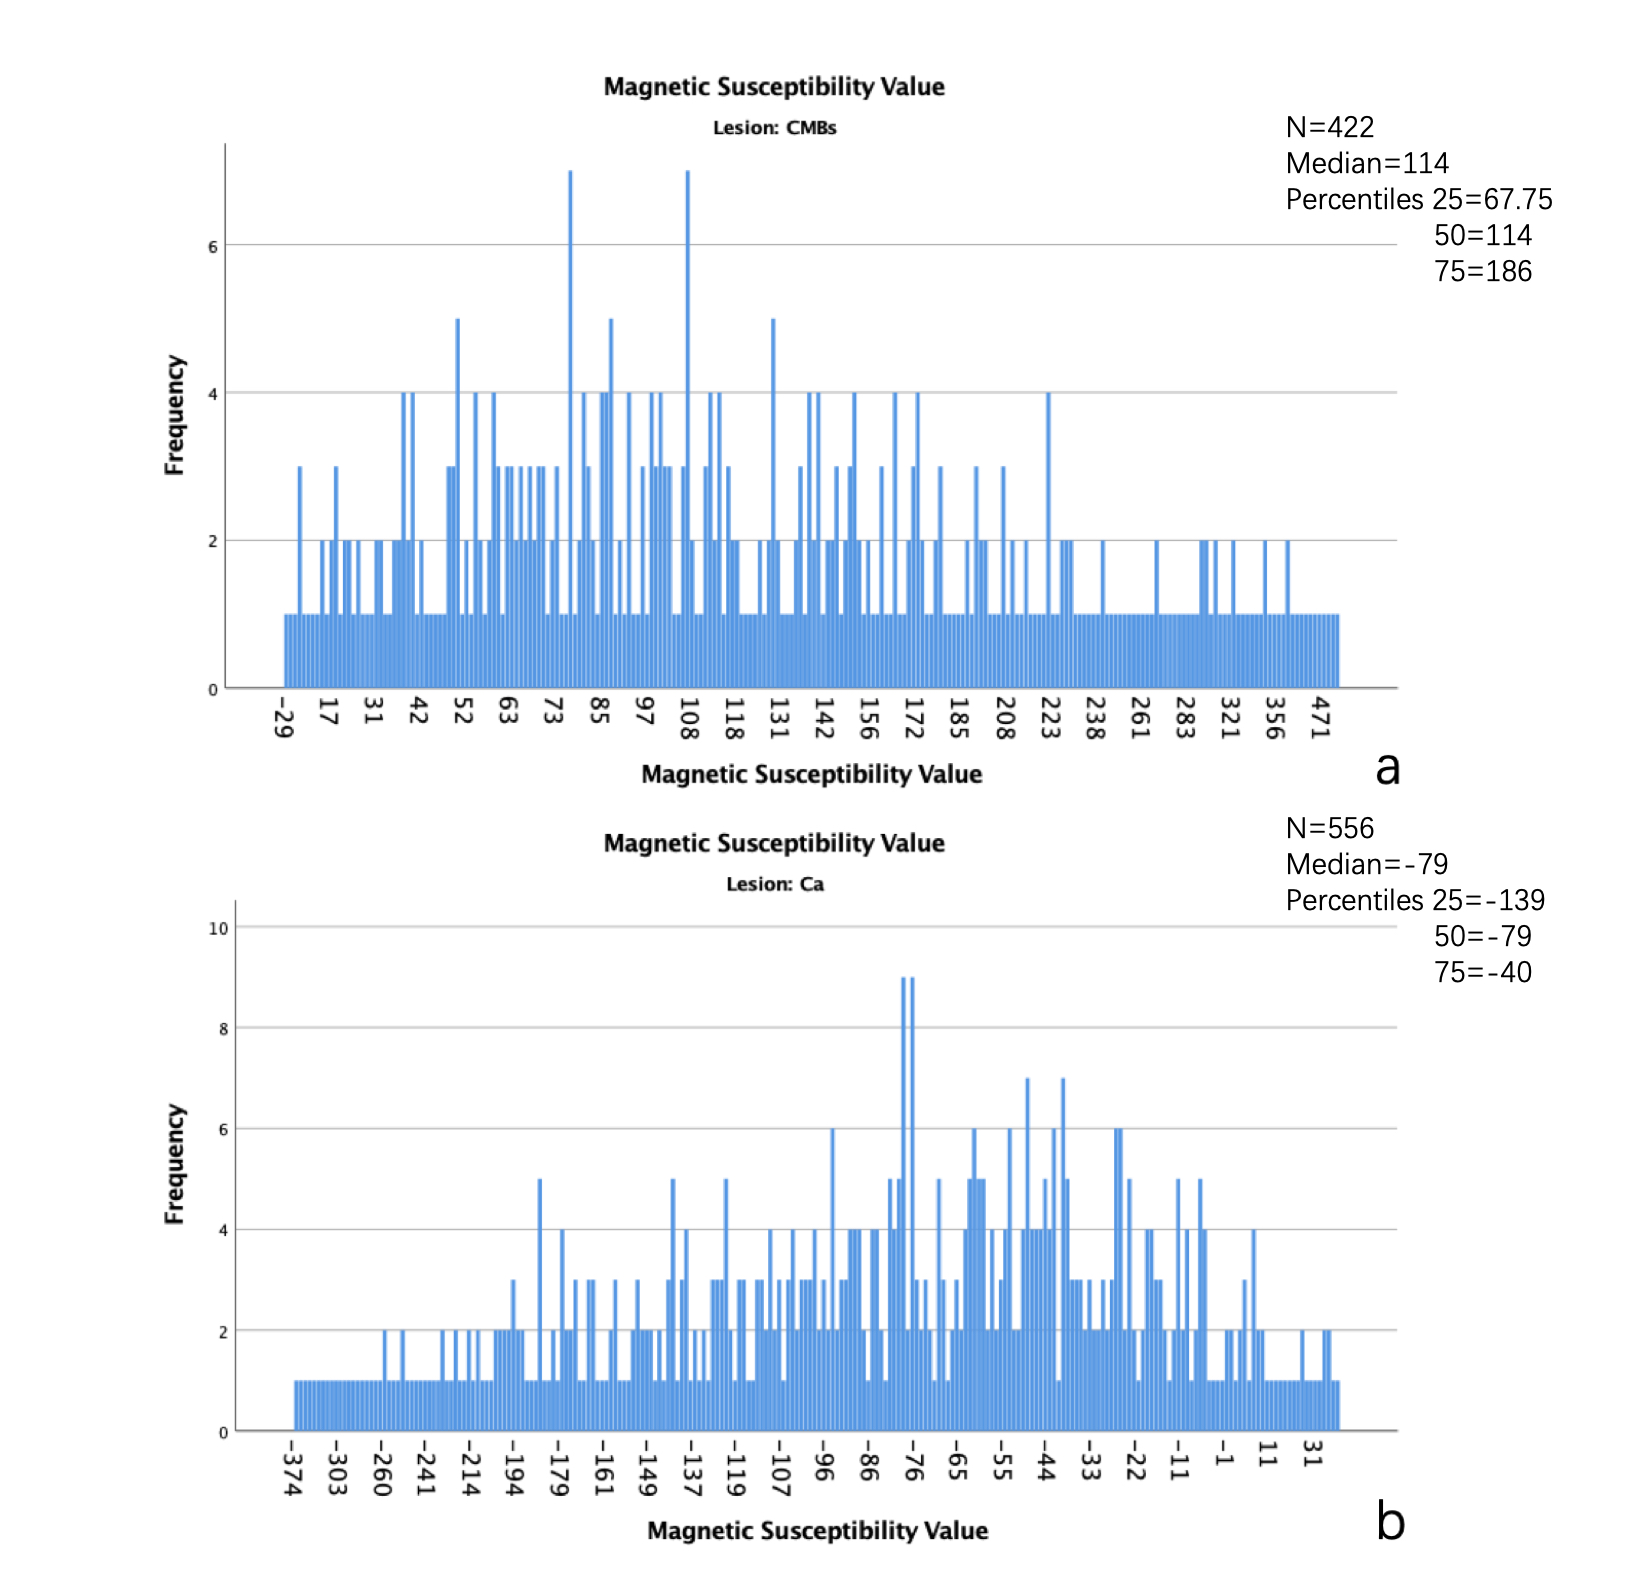
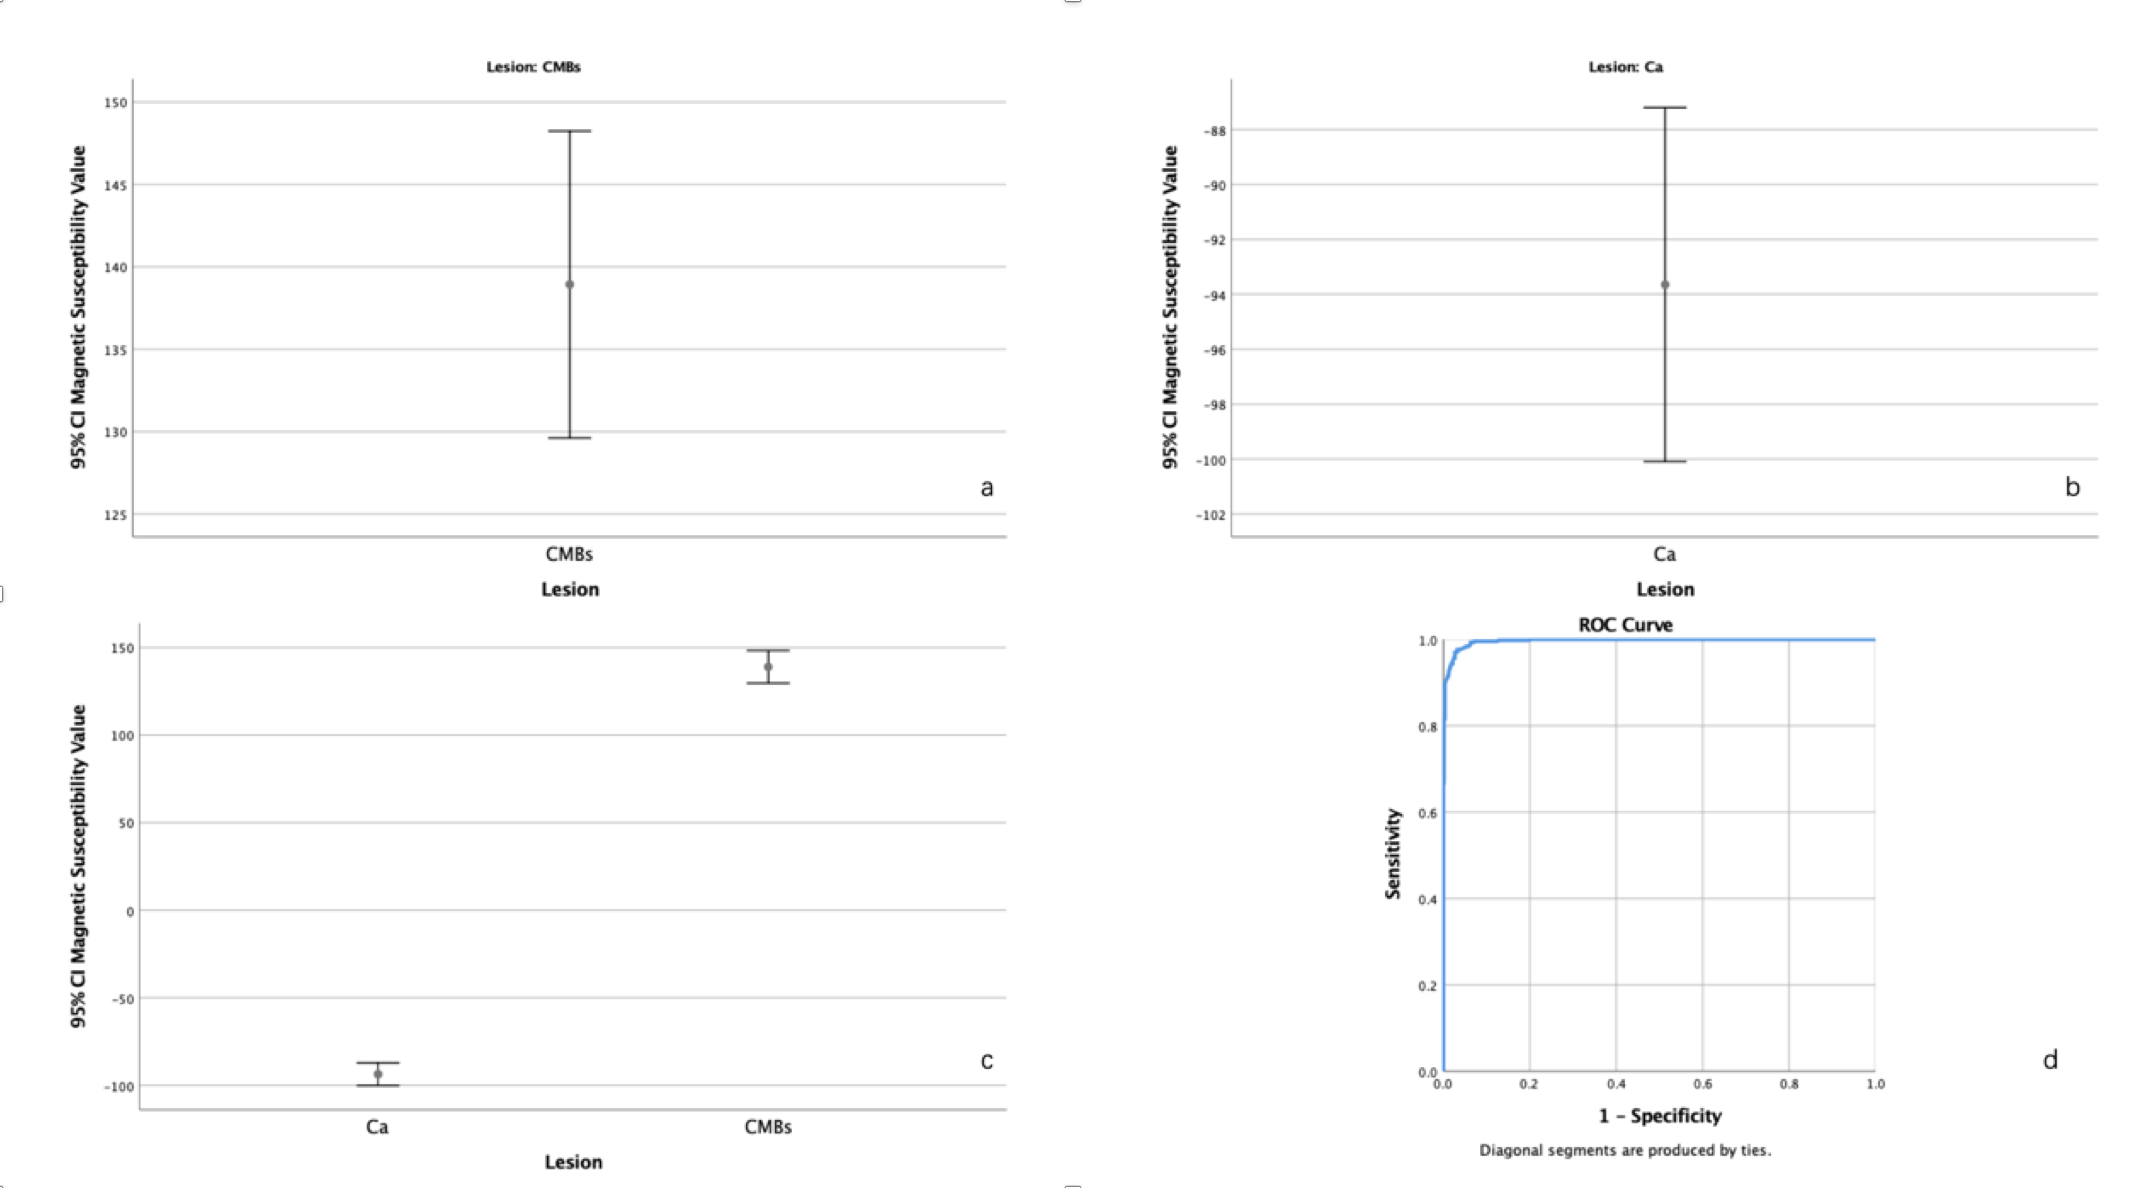
A total of 978 lesions were founded in all patients. The 422 lesions were CMBs, the others were calcifications. The mean of magnetic susceptibility value of CMBs was 138.93±97.36 (Figure 2a), the calcifications was -93.65±77.39 (Figure 2b). Significant difference was found between them (P<0.001) (Figure 2c). The median of magnetic susceptibility value of CMBs was 114(118.25) (Figure 3a), the calcifications was -79(99) (Figure 3b). There was Significant difference between them, too(P<0.001).The 95% confidence interval for the magnetic susceptibility value of the CMBs was 129.61 to 148.24 (Figure 4a), the calcification was -100.09 to -87.2 (Figure 4b). The area under the curve of magnetic susceptibility value detecting cerebral microbleeds was 0.996. The optimal threshold was selected as 11.5, Youden’s index was 0.944, based on both the sensitivity and the specificity. With this threshold, the sensitivity was 97.6%, and specificity was 96.8% (Figure 4d).
DISCUSSION
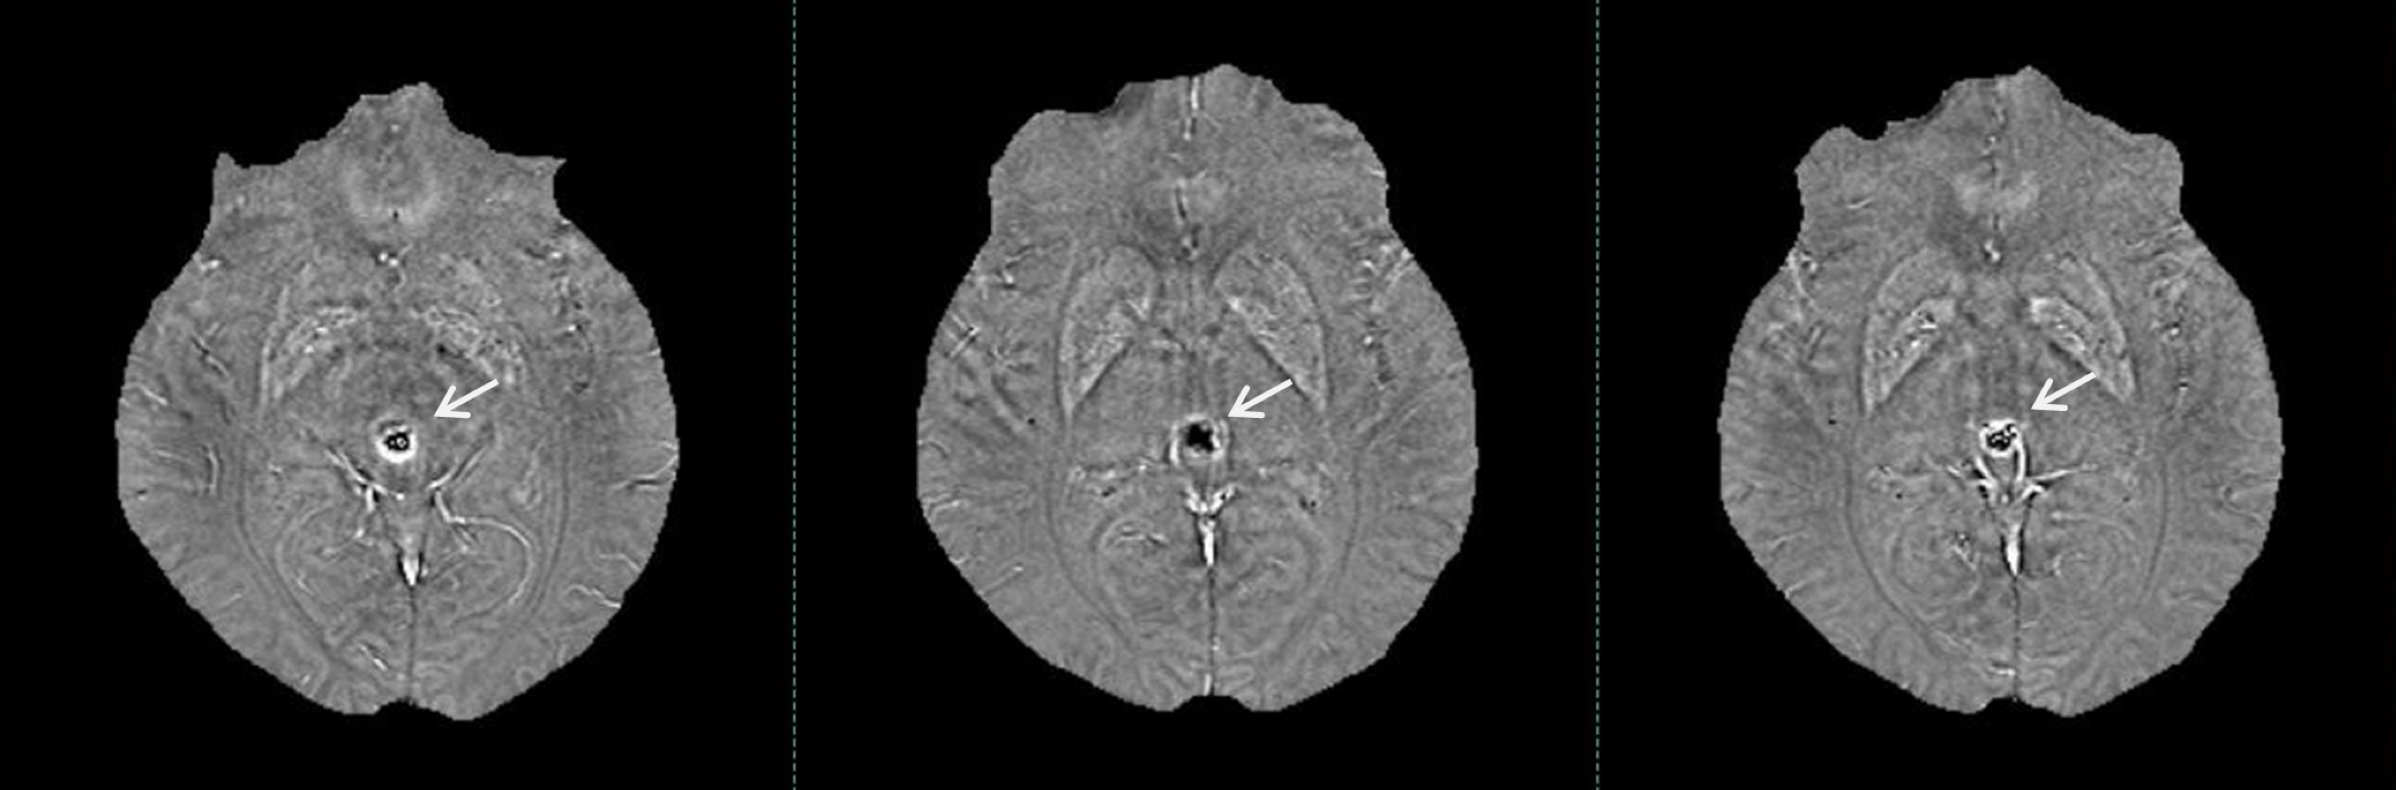
One early study suggested that histopathologic examination showed hemosiderin deposition without corresponding MRI signal changes8. A more recent investigation founded that almost every second patient had additional CMBs at histopathologic analysis compared with premortem clinical MR imaging, resulting in a false-negative rate of premortem MR imaging of 48%9. Because the non-local effects of the phase information can make it difficult to quantify susceptibility changes. The QSM can avoid geometry dependence, it is an image that does not depend on object orientation or imaging parameters and it is a source image6.In this study, significant difference was found between the magnetic susceptibility value of CMBs and calcification on SWIM. These findings may be somewhat limited by the manual measurement and magnetic field strength. The lesion is stereoscopic, but the MRI image is planar. So, the signal was different at different planes (Figure 5). We drew the region of interest on three different planes. The magnetic susceptibility value of lesion was mean of three planes. The correspondence between MR imaging and histopathologic analysis in CMBs is much better at 7.0 T MR10. All lesions were detected on 1.5 T MR in our study. There was no evidence to prove that whether the magnetic sensitivity values will be same in different field strengths.
CONCLUSION
The magnetic susceptibility value quantified in SWIM can be used to differential diagnose CMBs form calcification and improve the detection rate of CMBs.Acknowledgements
No acknowledgement found.References
1. Haller S, Vernooij MW, Kuijer JPA, Larsson E-M, Jäger HR, Barkhof F. Cerebral Microbleeds: Imaging and Clinical Significance. Radiology. 2018;287(1):11-28. doi:10.1148/radiol.2018170803
2. Werring DJ. Cerebral Microbleeds: Clinical and Pathophysiological Significance. Journal of Neuroimaging. 2007;17(3):193-203. doi:10.1111/j.1552-6569.2006.00070.x
3. Haacke EM, Mittal S, Wu Z, Neelavalli J, Cheng Y-C. Susceptibility-weighted imaging: technical aspects and clinical applications, part 1. American Journal of Neuroradiology. 2009;30(1):19–30
4. Wu Z, Mittal S, Kish K, Yu Y, Hu J, Haacke EM. Identification of calcification with MRI using susceptibility-weighted imaging: a case study. Journal of Magnetic Resonance Imaging: An Official Journal of the International Society for Magnetic Resonance in Medicine. 2009;29(1):177–182.
5. Wu J, Tarabishy B, Hu J, et al. Cortical calcification in sturge–weber syndrome on MRI-SWI: Relation to brain perfusion status and seizure severity. Journal of Magnetic Resonance Imaging. 2011;34(4):791–798
6. Haacke EM, Liu S, Buch S, Zheng W, Wu D, Ye Y. Quantitative susceptibility mapping: current status and future directions. Magnetic Resonance Imaging. 2015;33(1):1-25. doi:10.1016/j.mri.2014.09.004
7. Greenberg SM, Vernooij MW, Cordonnier C, et al. Cerebral microbleeds: a guide to detection and interpretation. The Lancet Neurology. 2009;8(2):165-174. doi:10.1016/S1474-4422(09)70013-4
8. Fazekas F, Kleinert R, Roob G, et al. Histopathologic analysis of foci of signal loss on gradient-echo T2*-weighted MR images in patients with spontaneous intracerebral hemorrhage: evidence of microangiopathy-related microbleeds. American Journal of Neuroradiology. 1999;20(4):637–642.
9. Haller S, Montandon M-L, Lazeyras F, et al. Radiologic-histopathologic correlation of cerebral microbleeds using pre-mortem and post-mortem MRI. PloS one. 2016;11(12):e0167743.
10. De Reuck J, Deramecourt V, Auger F, et al. Post-mortem 7.0-tesla magnetic resonance study of cortical microinfarcts in neurodegenerative diseases and vascular dementia with neuropathological correlates. Journal of the neurological sciences. 2014;346(1-2):85–89
Figures