1827
MR Multitasking-based Dynamic Imaging for Cerebrovascular Evaluation (MT-DICE): Development and Feasibility Study1Biomedical Imaging Research Institute, Cedars-Sinai Medical Center, Los Angeles, CA, United States, 2Bioengineering Department, University of California, Los Angeles, Los Angeles, CA, United States, 3Department of Radiology, Fujian Medical University Union Hospital, Fuzhou, China, 4Siemens Healthineers, Los Angeles, CA, United States, 5Department of Neurology, Cedars-Sinai Medical Center, Los Angeles, CA, United States, 6Department of Imaging, Cedars-Sinai Medical Center, Los Angeles, CA, United States, 7Department of Medicine, University of California, Los Angeles, Los Angeles, CA, United States
Synopsis
Perfusion MR imaging (i.e. DCE, DSC) has evolved as an increasingly common modality for evaluating a variety of cerebrovascular diseases, such as stroke and brain tumors, and susceptibility weighted imaging (SWI) is suitable for detection of intracranial hemorrhage. In this work, we developed an MR MultiTasking based Dynamic Imaging for Cerebrovascular Evaluation (MT-DICE) technique that can provide DCE, DSC and SWI information simultaneously with one 8-minute scan and a single contrast agent injection. Feasibility of MT-DICE was demonstrated in healthy volunteers and patients with hemorrhagic stroke or brain cancer.
Introduction
Cerebrovascular abnormalities are commonly associated with a variety of neurological disorders, stroke and brain cancers. As a versatile imaging technique, MR has evolved as an increasingly general modality for cerebrovascular evaluation. Several methods have established their role in clinical practice, such as dynamic contrast enhanced (DCE) imaging for quantifying disruption of blood-brain barrier, dynamic susceptibility contrast (DSC) imaging for assessing perfusion defects and susceptibility weighted imaging (SWI) for detecting intracerebral hemorrhage or micro-bleeding1-3. Inclusion of multiple sequences in one exam is often desired to provide complementary information for better risk stratification or prognosis, which is however unpractical because of a lengthy protocol and overdose of contrast injection4. To address this clinical need, we propose an MR MultiTasking based Dynamic Imaging for Cerebrovascular Evaluation (MT-DICE) technique that can provide DCE, DSC, and SWI information simultaneously with one 8-minute scan and a single contrast agent injection.Methods
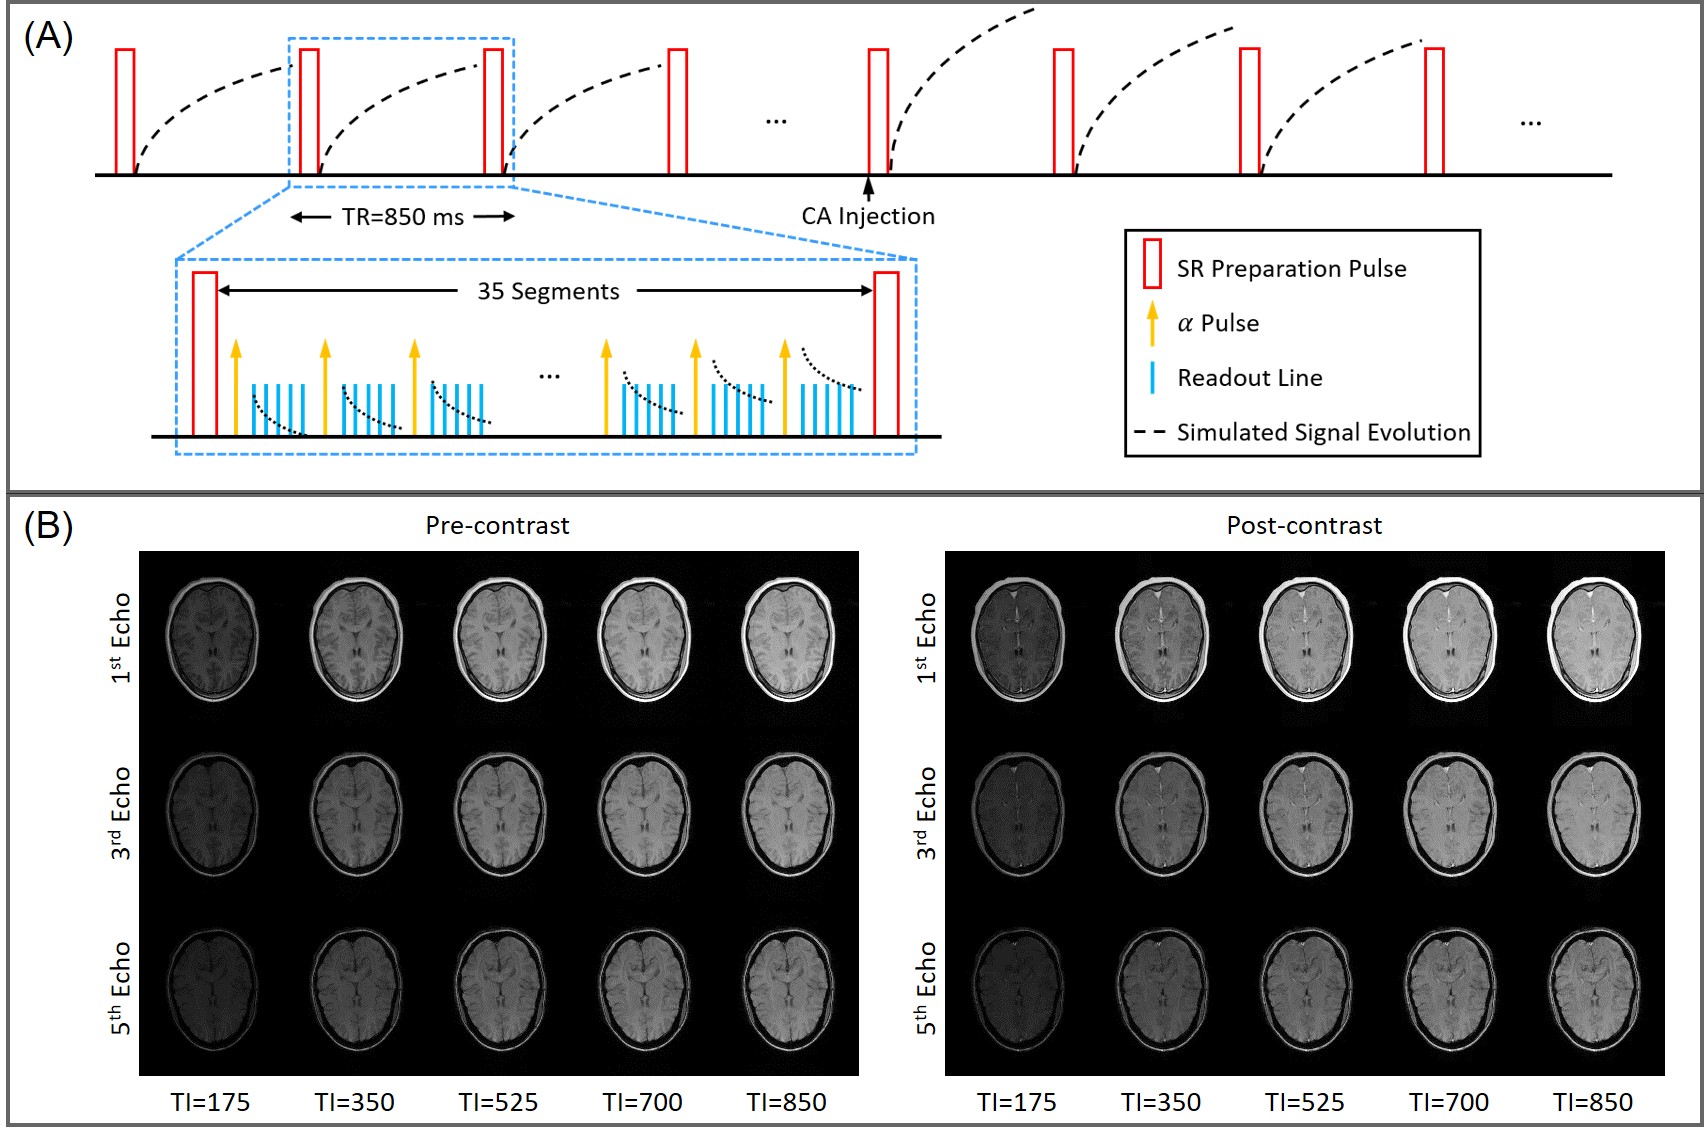
Sequence DesignMT-DICE employed a 3D Cartesian acquisition with non-selective saturation recovery (SR) preparation followed by multi-echo FLASH readouts (Figure 1A). Phase- and partition-encoding for the imaging data were randomized with a variable-density Gaussian sampling pattern with the highest sampling density in the center of k-space.
Imaging Framework
Dynamic T1 and T2* maps were acquired based on the MR multitasking framework5, which exploits the correlation between brain images along different time dimensions, including the SR (T1 recovery) dimension $$$t_{T1}$$$, multi-echo (T2* decay) dimension $$$t_{T2^*}$$$ and contrast enhancement time course $$$t_{CE}$$$, to allow accelerated imaging. Specifically, MT-DICE models the multidimensional images $$$I(r,t_{T1},t_{T2^*},t_{CE})$$$ as a low-rank tensor $$$\mathcal{I}$$$, which can be factorized and expressed in matrix form as $$$\mathbf{I}_{(1)}=\mathbf{U_r}\mathbf{\Phi}$$$. The factor $$$\mathbf{\Phi}$$$ is first determined from high-temporal-resolution auxiliary data and the spatial coefficients $$$\mathbf{U_r}$$$ are reconstructed by fitting $$$\mathbf{\Phi}$$$ to the acquired imaging data $$$\textbf{d}$$$: $$\mathbf{\hat{U}_r}=\mathop{\arg\min}_{\mathbf{U_r}}{\left\|{\textbf{d}-\Omega[\textbf{E}\mathbf{U_r}\mathbf{\Phi}]}\right\|}^2_2+\lambda{TV(\mathbf{U_r})}$$with undersampling pattern $$${\Omega}$$$, signal model $$$\textbf{E}$$$ and regularization parameter $$${\lambda}$$$.
Multiparametric Analysis
Permeability (DCE) and perfusion (DSC) metrics are then derived from the dynamic T1 and T2* maps based on tracer kinetic analysis6,7. For DCE-MRI, MT-DICE adopted the Patlak model: $$C^{R1}_t(t)={v_p}{C^{R1}_p(t)}+{K^{trans}}{\int_{0}^{t}{C^{R1}_p(\tau)}d\tau}$$where $$$C^{R1}_p(t)$$$ and $$$C^{R1}_t(t)$$$ denotes T1-based contrast concentration in plasma and tissue, vp the fractional plasma volume and Ktrans the transfer constant. For DSC-MRI, perfusion parameters were computed using the following expressions: $$CBV=100\ {\cdot}\ k\ {\cdot}\ {\frac{\int{C^{R2^*(t)}_t(t)dt}}{\int{C^{R2^*(t)}_a(t)dt}}}$$$$CBF=100\ {\cdot}\ 60\ {\cdot}\ k\ {\cdot}\ [max({C^{R2^*}_t(t)}{\otimes^{-1}}{C^{R2^*}_a(t)})]$$where $$${C^{R2^*}_a(t)}$$$ and $$${C^{R2^*}_t(t)}$$$ represent T2*-based concentration in the feeding artery and corresponding tissue, and $$${\otimes^{-1}}$$$ denotes deconvolution. Contrast concentration curves were directly transformed from the dynamic T1 or T2* values, based on the linear relationship between contrast concentration and change in R1 and R2* relaxation rates. SWI images were generated by multiplying the magnitude of the last echo images by the corresponding phase mask8.
In vivo Study
5 healthy subjects and 3 patients with stroke or brain cancer were scanned on a 3T system (MAGNETOM Vida; Siemens Healthineers) with a 20-channel head-neck coil. Major imaging parameters included: FOV=265×220 mm2, in-plane spatial resolution=1.5×1.5 mm2, 30 slices with 4-mm thickness, TR=850 ms, TEs=2.46/7.38/12.30/17.22/22.14 ms, FA=10°, total time=8 min. Gadavist (0.1 mmol/kg) was administered 3 minutes into the scan at the rate of 3.0 ml/s, followed by 20 mL saline flush.
Results
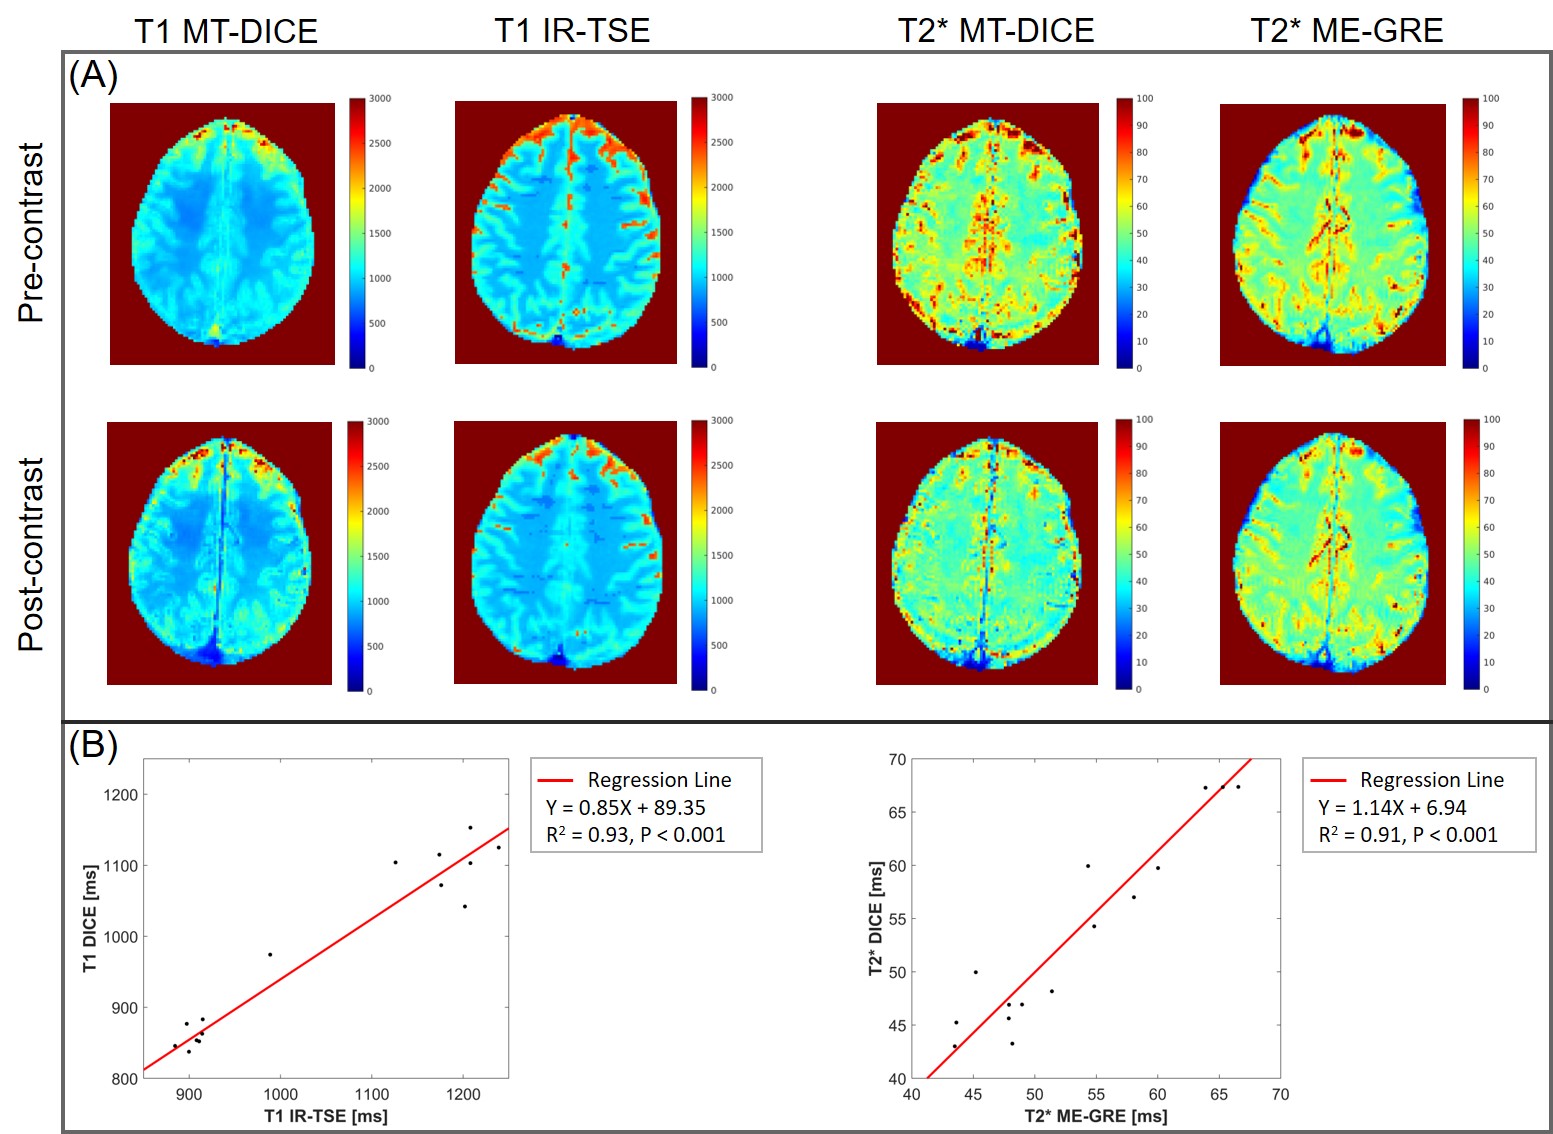
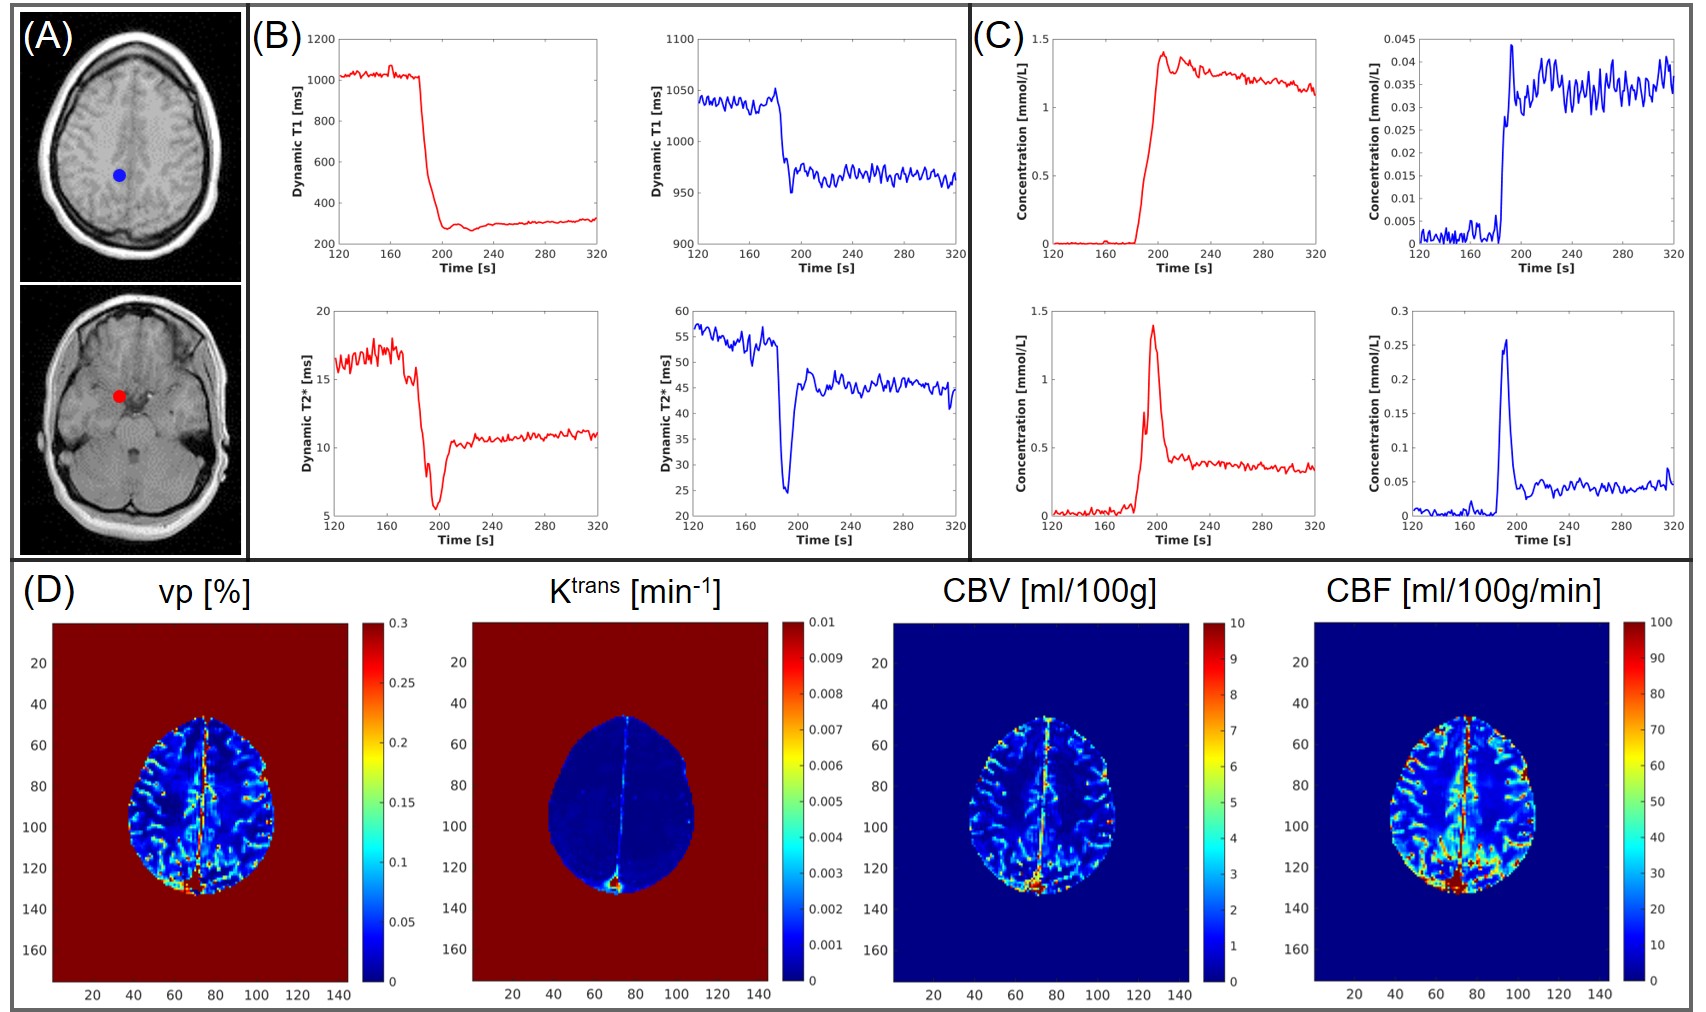
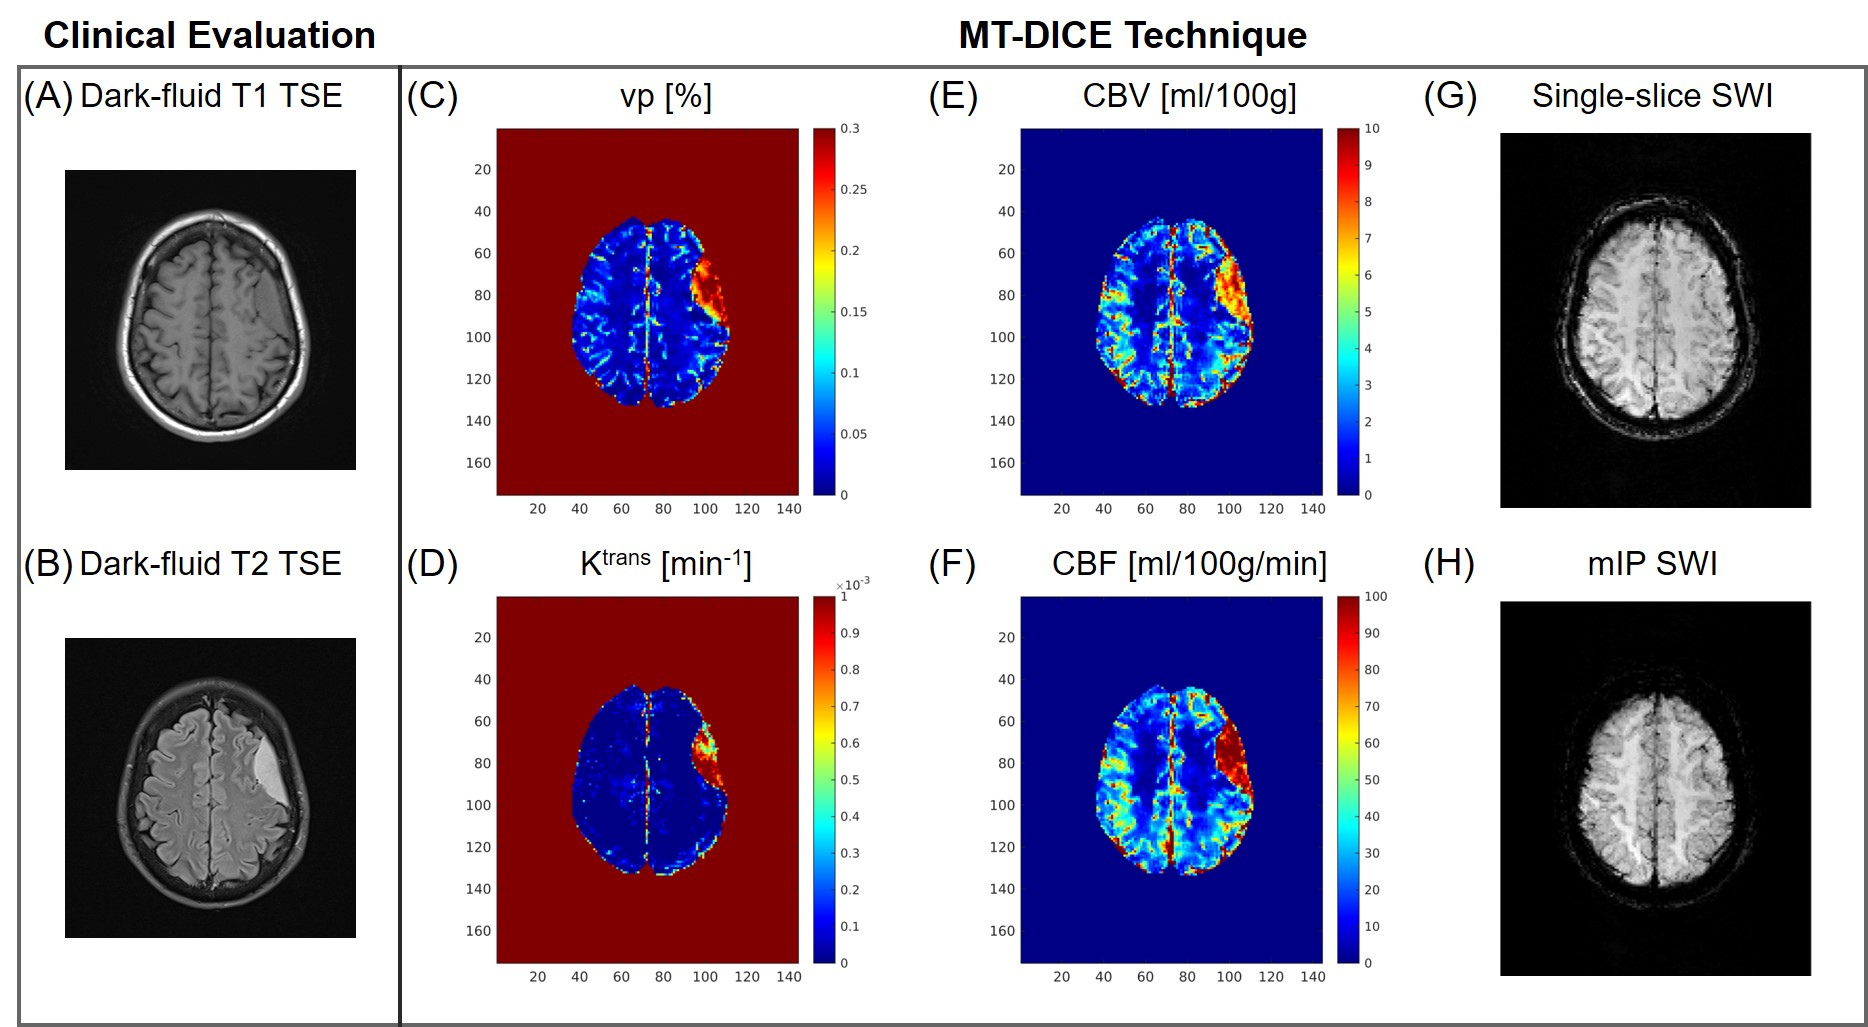
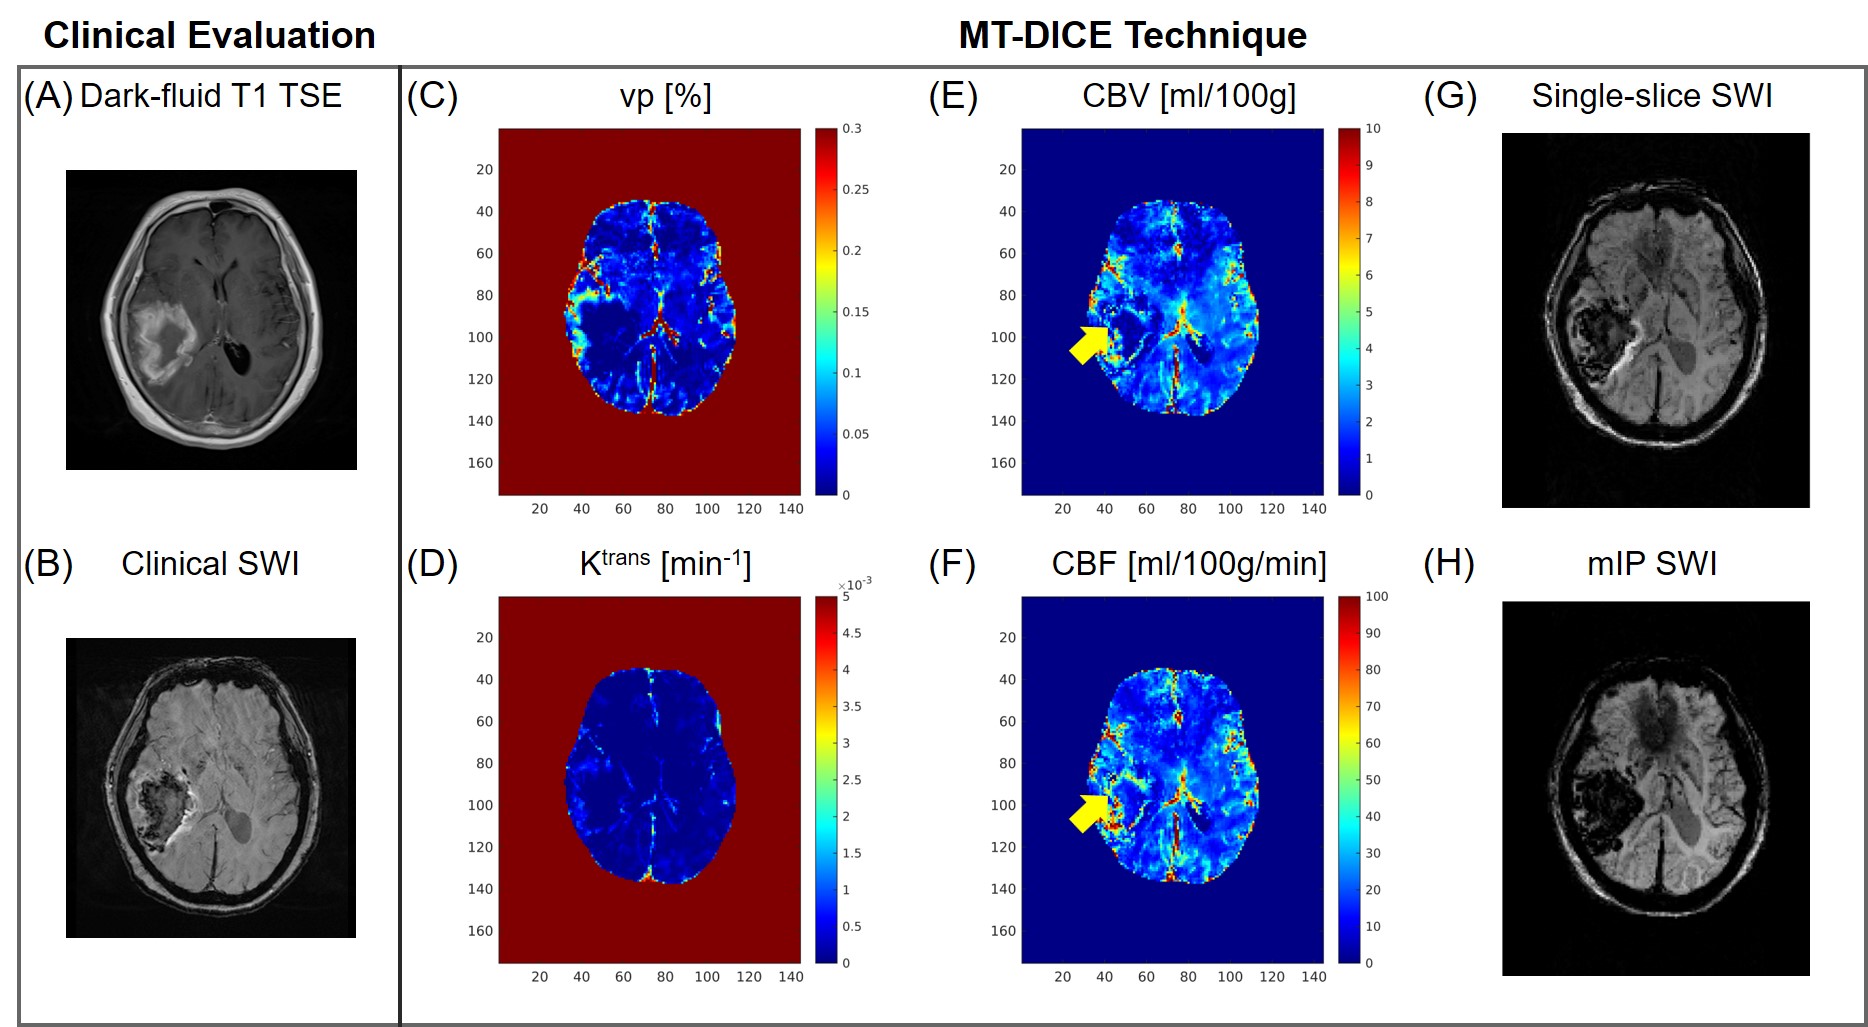
Example images along the T1 recovery time dimension, the T2* decay time dimension, and contrast enhancement time dimension, respectively, are shown in Figure 1B. Figure 2A shows example pre- and post-contrast T1 and T2* maps acquired by MT-DICE and reference mapping sequences (IR-TSE and Multi-echo GRE) with matched protocols. Good agreement in T1 and T2* values was demonstrated in 5 healthy subjects between MT-DICE and corresponding references (Figure 2B). Figure 3 shows the post-contrast T1-weighted images (Figure 3A), dynamic T1 and T2* curves (Figure 3B) and corresponding T1- and T2*-based concentration curves (Figure 3C) of normal brain tissue (blue) and blood (red), respectively, in a healthy subject. DCE and DSC maps obtained on the same subject are shown in Figure 3D, with the values comparable to literature1,9. In the patient with meningioma (Figure 4), both DCE and DSC parameters of the tumor are higher than those of surrounding healthy tissue. In the patient with intracerebral hemorrhage, severe hemorrhage was better depicted on MT-DICE SWI images (Figure 5G and 5H) compared to the routine SWI sequence (Figure 5B). Permeability and perfusion indices of the hematoma area are slightly lower compared to adjacent normal tissue.Discussion
DCE- and DSC-MRI offer complementary information while SWI has unique advantages in identifying hemorrhage. The simultaneous combination of these imaging techniques is promising and is of great clinical value in cerebrovascular evaluation. The presented pilot study demonstrates the in vivo feasibility of MT-DICE for comprehensive diagnosis of cerebrovascular complications with a single dose of contrast injection. Moreover, MT-DICE quantifies the contrast concentration based on dynamic T1 and T2* mapping, as opposed to linearly approximating concentration from signal intensity, which is expected to improve the accuracy in the quantification of permeability and perfusion.Conclusion
We present an MT-DICE technique and demonstrate its feasibility for simultaneous DCE, DSC, and SWI in healthy subjects and patients. Further clinical validation in a larger patient cohort is underway.Acknowledgements
No acknowledgement found.References
1. Chikui T, Obara M, Simonetti AW, Ohga M, Koga S, Kawano S, Matsuo Y, Kamintani T, Shiraishi T, Kitamoto E. The principal of dynamic contrast enhanced MRI, the method of pharmacokinetic analysis, and its application in the head and neck region. International journal of dentistry 2012;2012.
2. Denk C, Rauscher A. Susceptibility weighted imaging with multiple echoes. Journal of Magnetic Resonance Imaging 2010;31(1):185-191.
3. Shiroishi MS, Castellazzi G, Boxerman JL, D'Amore F, Essig M, Nguyen TB, Provenzale JM, Enterline DS, Anzalone N, Dörfler A. Principles of T2*‐weighted dynamic susceptibility contrast MRI technique in brain tumor imaging. Journal of Magnetic Resonance Imaging 2015;41(2):296-313.
4. Seeger A, Braun C, Skardelly M, Paulsen F, Schittenhelm J, Ernemann U, Bisdas S. Comparison of three different MR perfusion techniques and MR spectroscopy for multiparametric assessment in distinguishing recurrent high-grade gliomas from stable disease. Academic radiology 2013;20(12):1557-1565.
5. Christodoulou AG, Shaw JL, Nguyen C, Yang Q, Xie Y, Wang N, Li D. Magnetic resonance multitasking for motion-resolved quantitative cardiovascular imaging. Nature biomedical engineering 2018;2(4):215.
6. Patlak CS, Blasberg RG, Fenstermacher JD. Graphical evaluation of blood-to-brain transfer constants from multiple-time uptake data. Journal of Cerebral Blood Flow & Metabolism 1983;3(1):1-7.
7. Østergaard L. Principles of cerebral perfusion imaging by bolus tracking. Journal of Magnetic Resonance Imaging: An Official Journal of the International Society for Magnetic Resonance in Medicine 2005;22(6):710-717.
8. Wang Y, Yu Y, Li D, Bae K, Brown J, Lin W, Haacke E. Artery and vein separation using susceptibility‐dependent phase in contrast‐enhanced MRA. Journal of Magnetic Resonance Imaging 2000;12(5):661-670.
9. Carroll TJ, Horowitz S, Shin W, Mouannes J, Sawlani R, Ali S, Raizer J, Futterer S. Quantification of cerebral perfusion using the “bookend technique”: an evaluation in CNS tumors. Magnetic resonance imaging 2008;26(10):1352-1359.
Figures