1826
Measurement of cardiac pulsatile map in the brain without monitoring an external cardiac signal.1University of Pittsburgh, Pittsburgh, PA, United States
Synopsis
In order to obtain cardiac waveforms in the brain for studies with incomplete measurement by pulse-oximeter, we developed a technique to map cardiac pulsation directly from fMRI data itself. We compared the cardiac-phase from our method with that from pulse-oximeter and found they are highly correlated (r > 0.8).
INTRODUCTION
The cardiac pulsation signal can be estimated and removed from the BOLD signal 1. This artifact of cardiac pulsatile map has been also obtained to measure cardiac-induced vessel and cerebrospinal fluid pulsations 2-5. Although various approaches have been introduced, one prerequisite is the external measurement of the cardiac cycle, generally by the scanner’s built-in pulse oximeter. The optical plethysmogram signal can be easily distorted and/or the device can fail for other reasons; 33% (n=254/770) of our studies failed to measure the complete cardiac pulses. In this project, we developed a technique to map cardiac pulsation directly from rs-fMRI data itself.METHODS
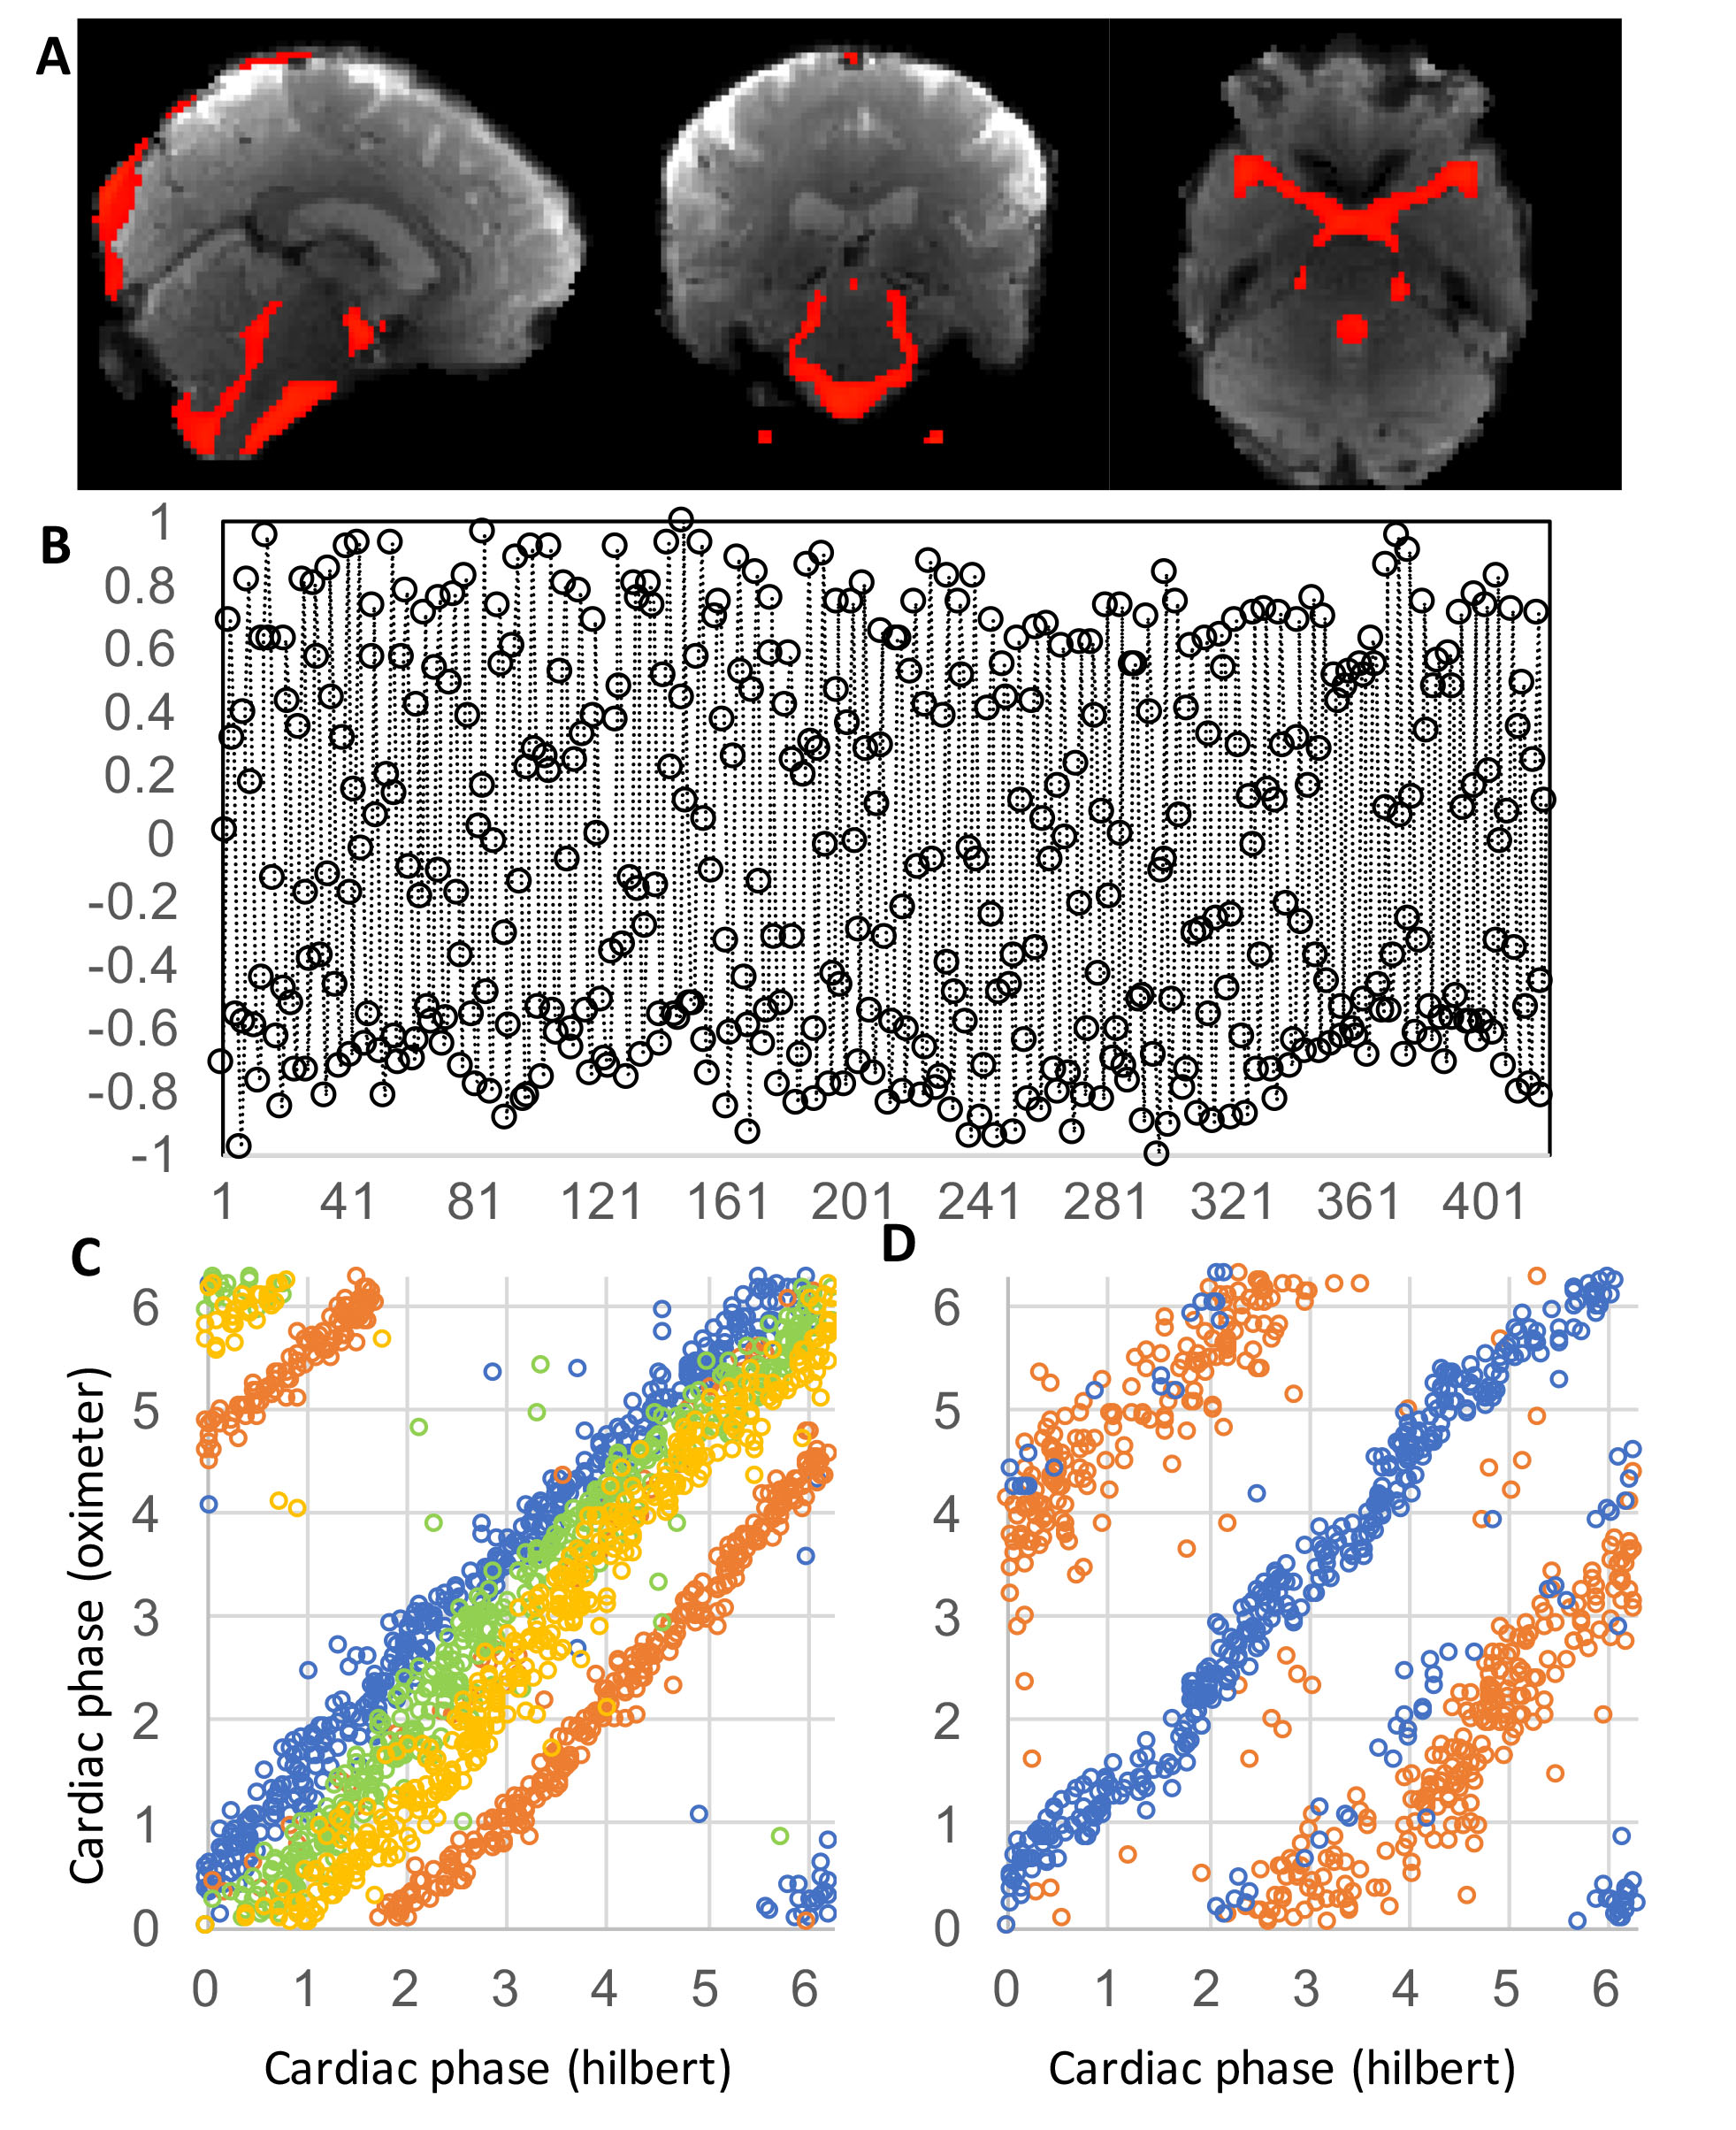
Total of 108 participants from Connectomics in Brain Aging and Dementia were studied at 3T (Siemens, Prisma) using a 64-channel head coil. 3D T1-weighted (TR/TE = 2400/2.22 msec, TI = 1000 msec, FA = 8, voxel size = 0.8 mm isotropic) images were acquired. The rs-fMRI data were obtained with a 2D GE-EPI with TR/TE = 800/37ms, voxel size = 2 mm isotropic, FA = 52°, MB-acceleration-factor =8, and 72 slices with 420 volumes. The scanner provided a TTL pulse output for each slice to synchronize the cardiac cycle and MRI data. The sequence ran twice with opposite phase-encoding polarities to allow for EPI geometric distortion correction. 8 separate sessions of rs-fMRI were acquired. We also tested a method with TR = 1.5s, which is longer than one cardiac cycle, with a separate data set (n=10). Imaging parameters was TR/TE=1500/14ms, 3 mm isotropic, 42 slices with MB-acceleration-factor = 3. The anatomical images and rs-fMRI data were aligned and transformed to the MNI template by non-linear registration. Motion correction was performed for rs-fMRI. For each subject’s pulsatile map, the cardiac pulsatile template map in MNI space was inverse-transformed into each subject's original scan space. To derive the main cardiac-induced sinusoidal signal, voxels with a threshold > 3.3σ of template (>99.9%) were selected and generated a binary mask for each individual’s high cardiac pulsatile regions (mainly large vessels, Fig. 1A). The signal intensity changes in the main arteries followed the cardiac cycle. Thus, a principal component analysis was used to derive the main component. The amplitude of sinusoidal time-series was normalized. The Hilbert transformation, which generates signal S(t) constructed from a real-valued cardiac-induced sinusoidal input signal, was applied to find the phase time-series from the rs-fMRI data. The phase of the cardiac cycle was calculated (angle of the complex data) at each volume of time-series. For each voxel, the acquired phases were then applied to the Fourier series (Σi ai·sin(i·θ)+bi·cos(i·θ), i=1,2) to generate each individual’s cardiac pulsatile map calculated by sqrt(Σi (ai/SEi)2+ (bi/SEi)2), where SE is standard error of the coefficients. To determine a meaningful cardiac pulsatile map, a null statistic distribution was created by a Monte Carlo technique of regressing random phase data for an arbitrary noise model. The null statistic distribution was used to find the threshold for 3σ significance, where the meaningful cardiac pulsatile signal is larger than 99.73% of the null couplings distribution. A total of 516 runs (from 864 runs, 88 severe motion, 6 drop, and 254 incomplete pulse oximeter measurement were excluded) of cardiac pulsatile maps obtained from pulse oximeter and our method were compared.RESULTS
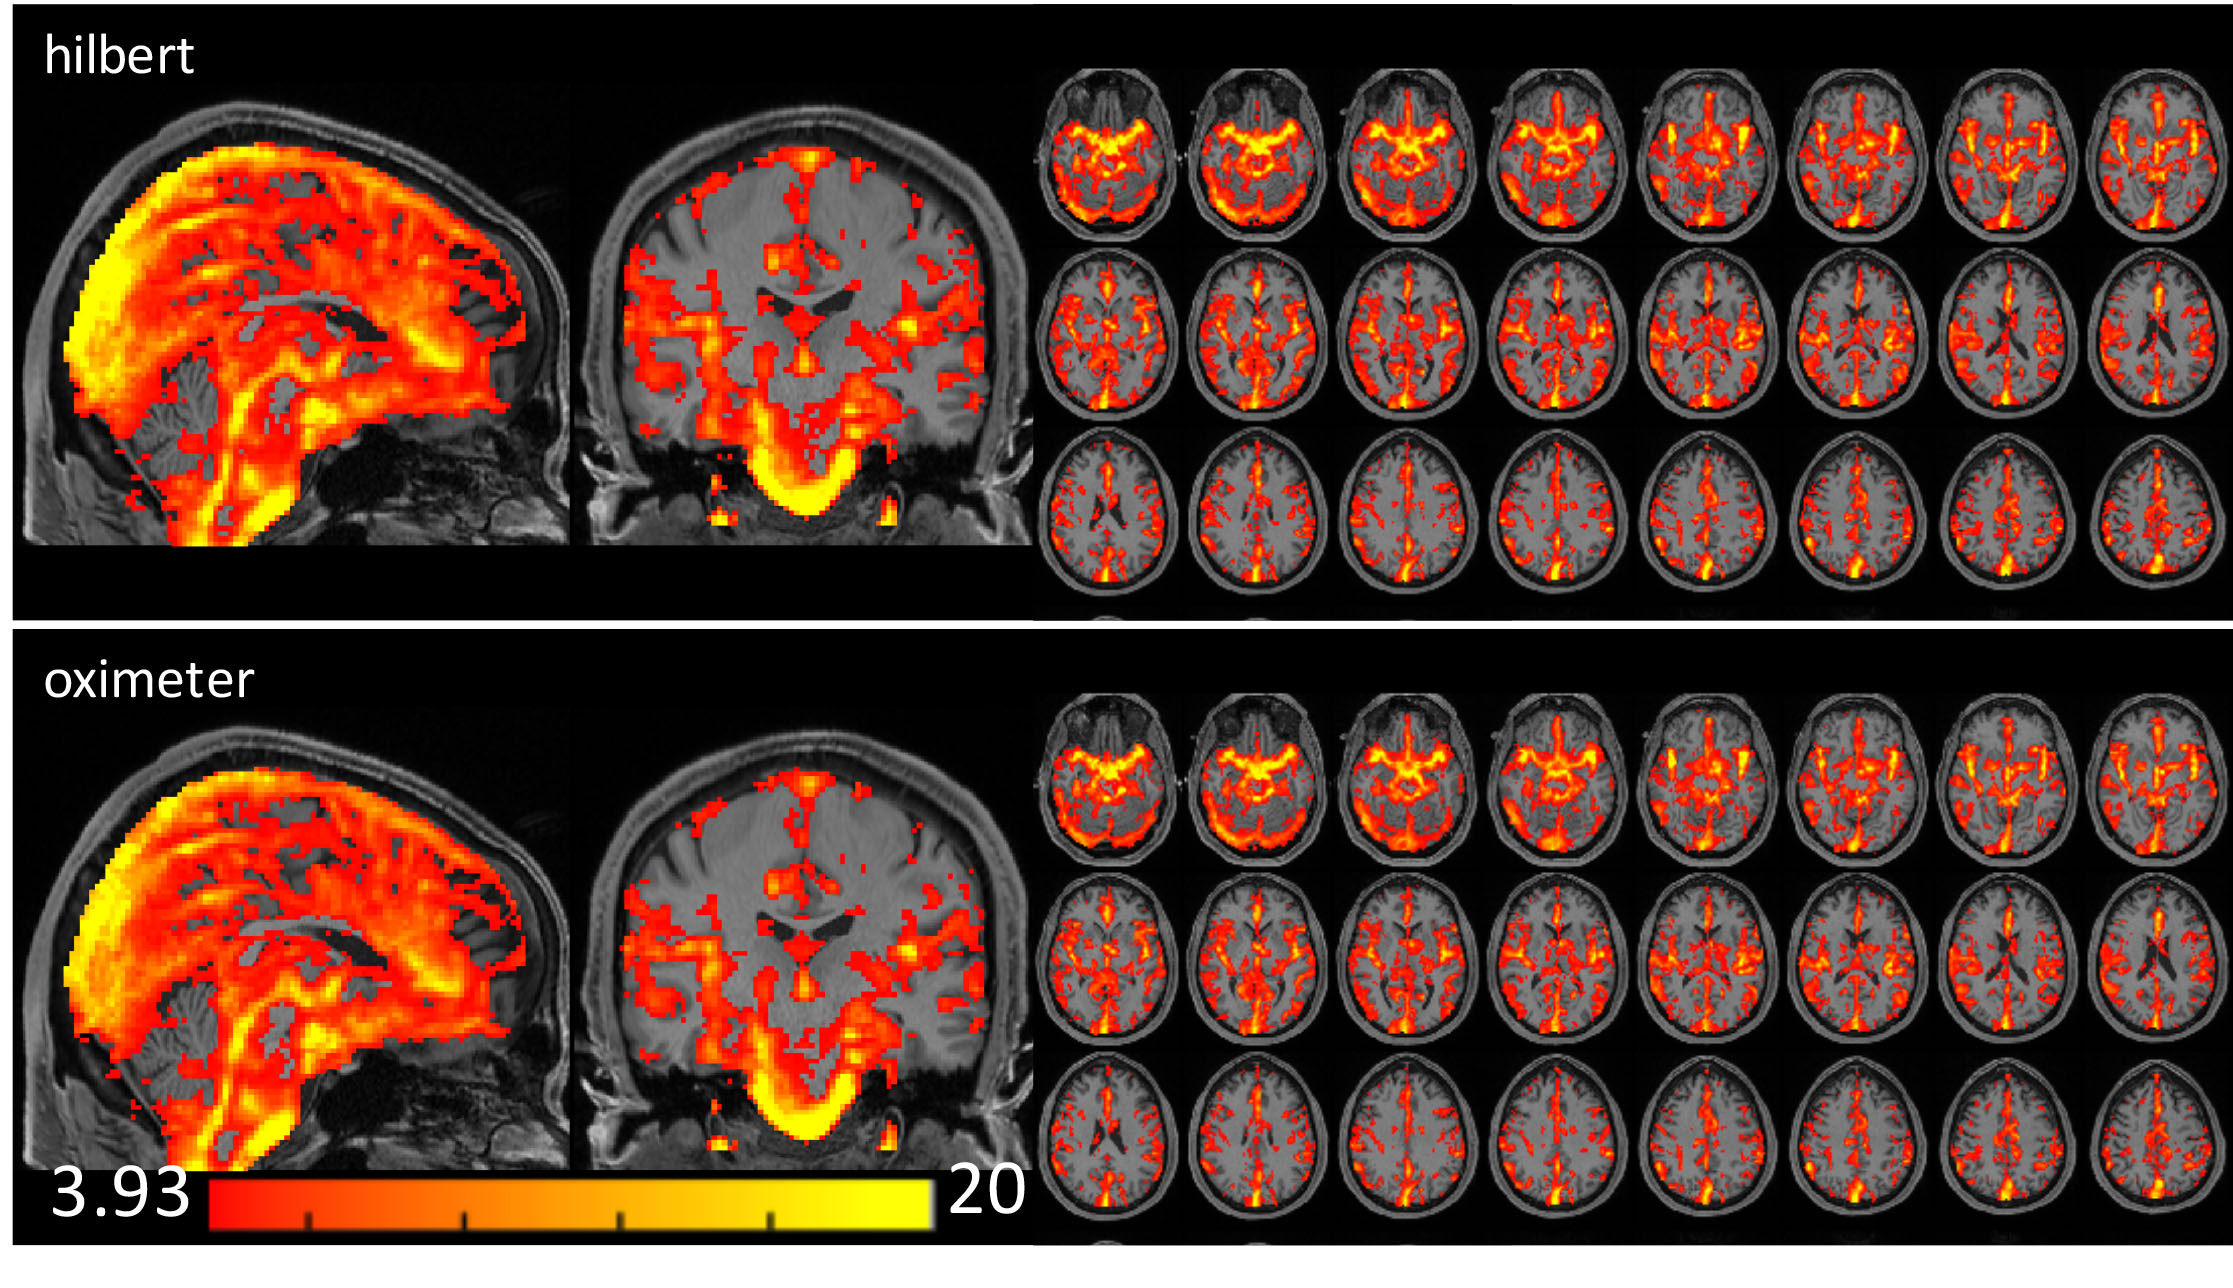
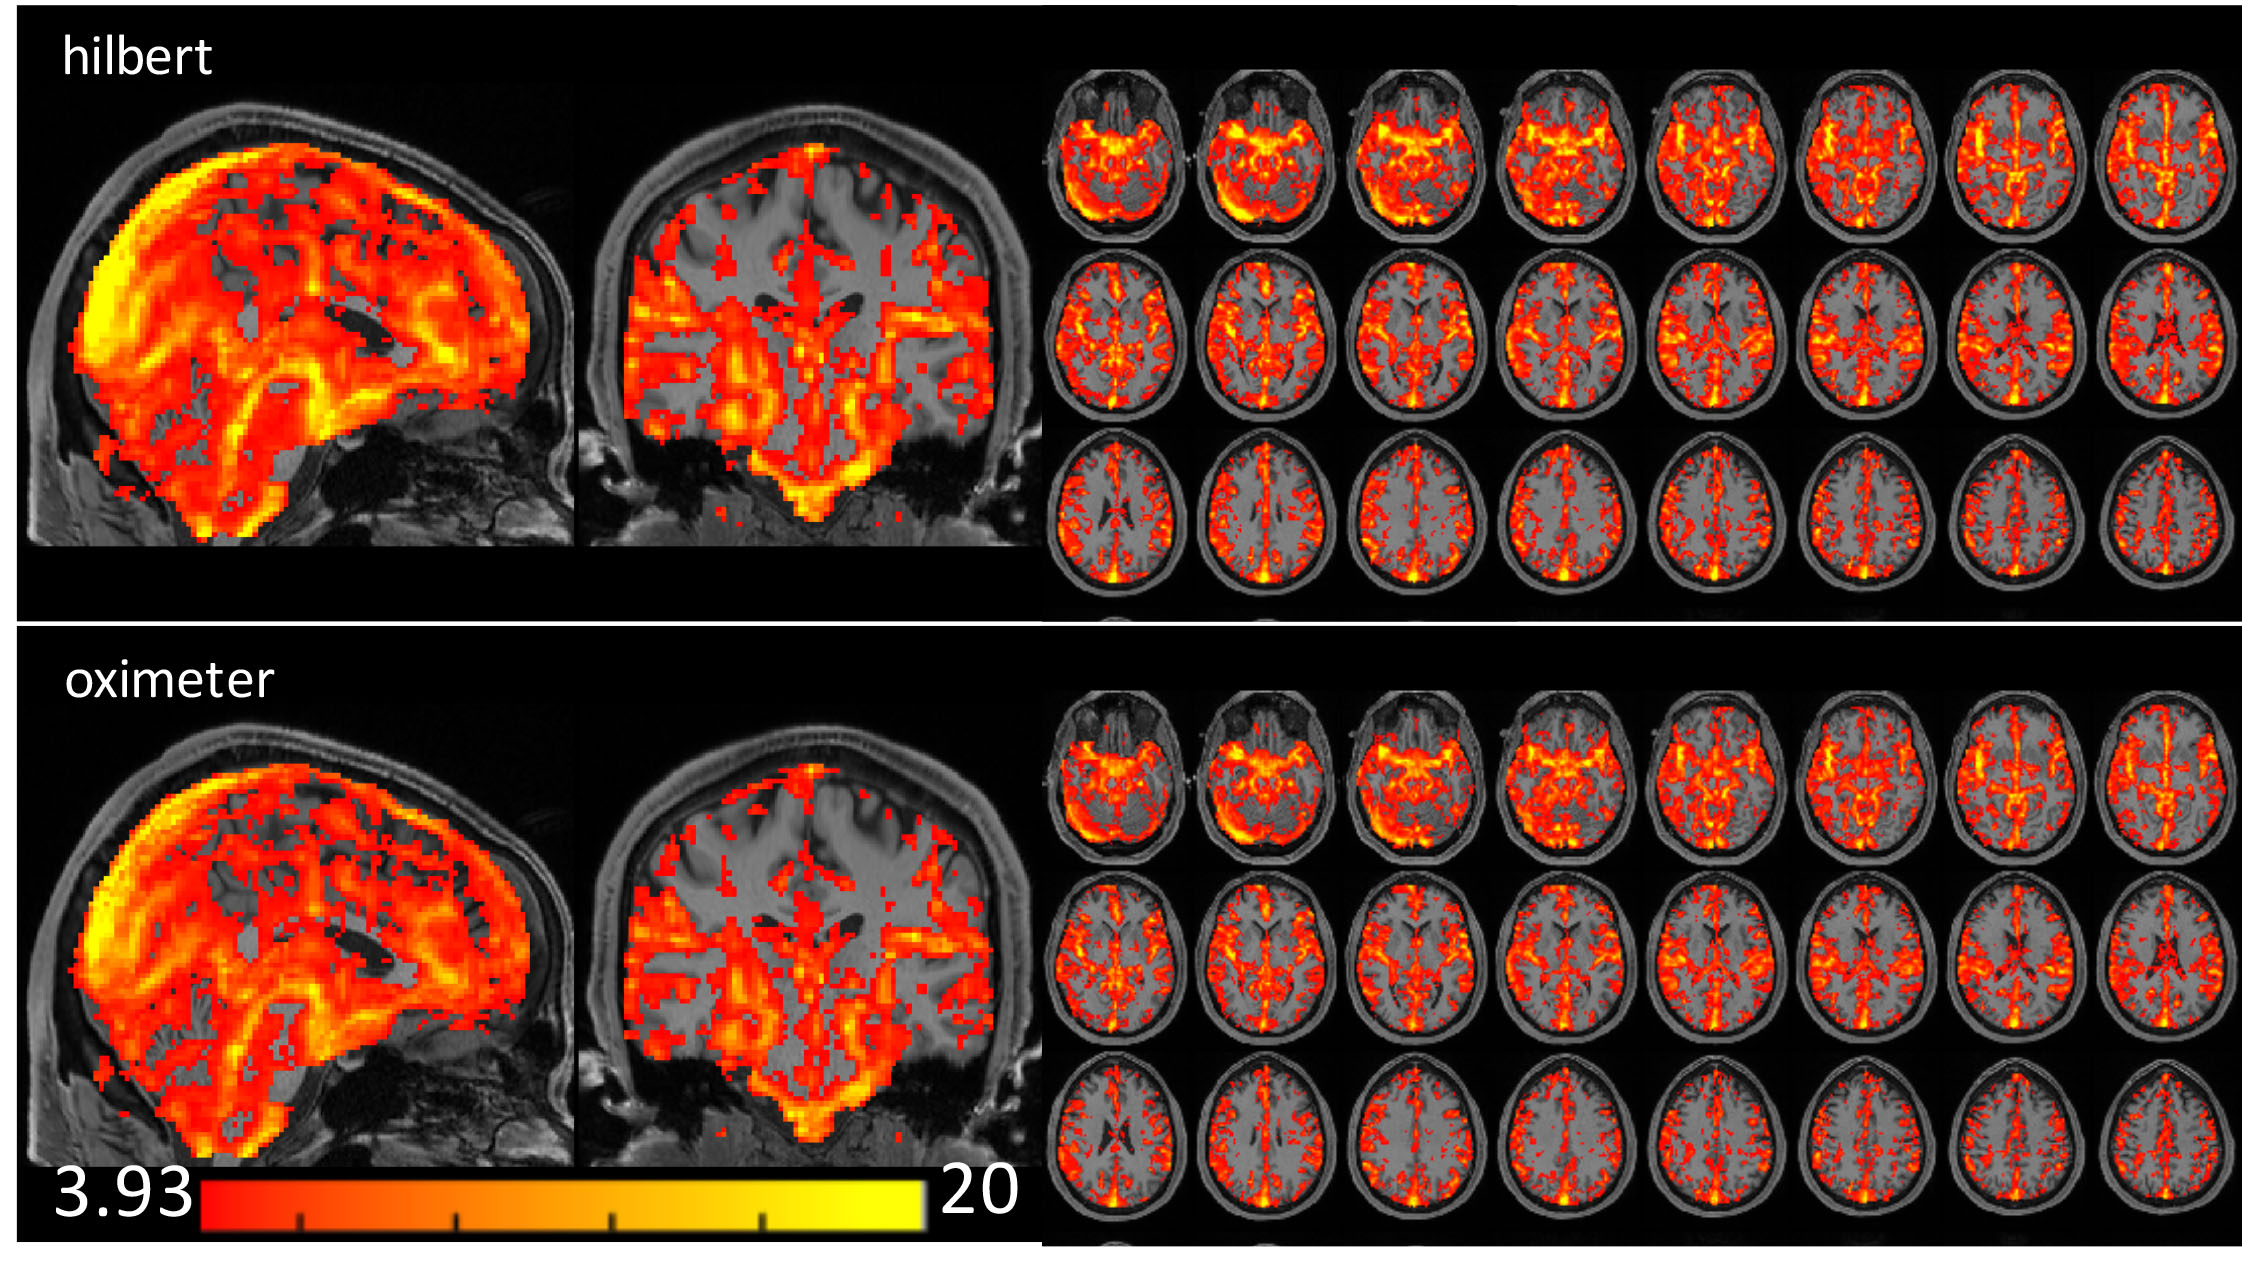
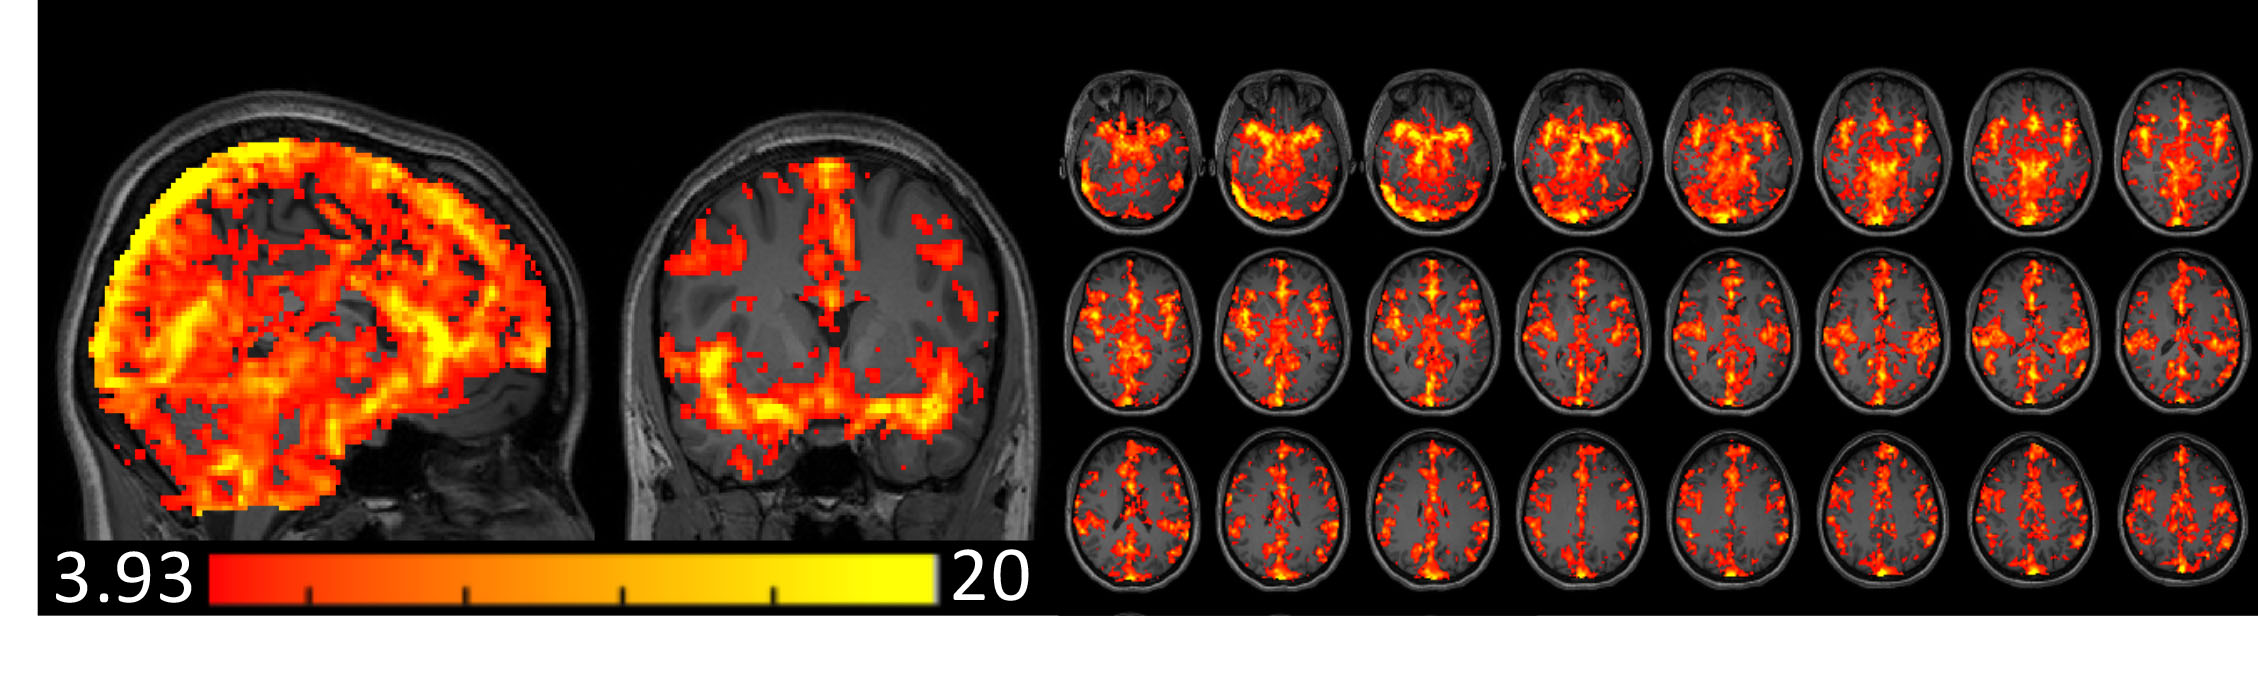
Fig. 1B shows the first principle component of the cardiac-induced signal acquired from the ROI of Fig. 1A. Fig. 1C shows that four different runs of the cardiac phases calculated by our approach were in good agreement with the phases from the pulse oximeter data. Fig. 1D shows a slight mismatch of the cardiac phase between our approach and pulse oximeter data. The phase shift does not change the sum of squares of the coefficients by fitting of the Fourier series. The correlation coefficient between both cardiac-phases were r > 0.8, except 3 studies (r = 0.59, 0.67 and 0.74). Figs. 2 and 3 show the cardiac pulsatile maps from our approach (Hilbert) and the pulse oximeter. All subjects showed areas of high cardiac-induced signal localized to the regions of the major blood vessels and ventricles. Fig.2 shows that the pulsatile maps from Hilbert transformation and pulse-oximeter were perfectly matched, while Fig.3 shows slightly lower intensity in the pulsatile map from pulse-oximeter. We compared averaged cardiac pulsatile values in the brain between the Hilbert and pulse-oximeter methods. Both techniques showed similar results, but Hilbert method is slightly better at detecting cardiac pulsatility (our method = 7.9 ± 0.6 vs. pulse-oximeter= 7.6 ± 0.7, p < 10-14, n=516 studies). Fig.4 demonstrates our method was also able to obtain the cardiac pulsatile map successfully with TR = 1.5.DISCUSSION
Our method showed slightly better cardiac pulsatile map compared to that acquired with pulse-oximeters. This may be due to more accurate cardiac-phase measurement as there is no time shift between the cardiac pulse measured in the finger vs. the brain, with less error due to pulse-oximeter measurement errors.CONCLUSION
Our method was able to accurately measure the cardiac phases with rs-fMRI data itself without the assistance of the external pulse oximeter.Acknowledgements
This work was supported by the National Institutes of Health (UF1-AG051197).References
1. Glover GH, Li TQ. Ress D. Image-based method for retrospective correction of physiological motion effects in fMRI: RETROICOR. Magn Reson Med. 2000 Jul;44(1):162-7.
2. Dagli MS, Ingeholm JE. Haxby JV. Localization of cardiac-induced signal change in fMRI. Neuroimage. 1999 Apr;9(4):407-15.
3. Tong Y, Hocke LM, Frederick Bd. Short repetition time multiband echo-planar imaging with simultaneous pulse recording allows dynamic imaging of the cardiac pulsation signal. Magn Reson Med. 2014 Nov;72(5):1268-76
4. Lund TE, Madsen KH, Sidaros K, Luo WL, Nichols TE. Non-white noise in fMRI: does modelling have an impact? Neuroimage. 2006 Jan 1;29(1):54-66
5. Theyers AE, Goldstein BI, Metcalfe AW, Robertson AD, MacIntosh BJ. Cerebrovascular blood oxygenation level dependent pulsatility at baseline and following acute exercise among healthy adolescents. J Cereb Blood Flow Metab. 2019 Sep;39(9):1737-1749.
Figures