1825
QuaSI-MTR (qualitative scans for imaging MTR): deep-learned MTR from routine scans using U-nets.
Antonio Ricciardi1,2, Francesco Grussu1,3, Ferran Prados1,2,4, Baris Kanber2, Rebecca S Samson1, Daniel C Alexander3, Declan T Chard1,5, and Claudia A M Gandini Wheeler-Kingshott1,6,7
1NMR Research Unit, Queen Square MS Centre, Department of Neuroinflammation, UCL Queen Square Institute of Neurology, Faculty of Brain Sciences, University College London, London, United Kingdom, 2Centre for Medical Image Computing, Department of Medical Physics and Biomedical Engineering, University College London, London, United Kingdom, 3Centre for Medical Image Computing, Department of Computer Science, University College London, London, United Kingdom, 4Universitat Oberta de Catalunya, Barcelona, Spain, 5National Institute for Health Research (NIHR) University College London Hospitals (UCLH) Biomedical Research Centre, London, United Kingdom, 6Department of Brain and Behavioral Sciences, University of Pavia, Pavia, Italy, 7Brain MRI 3T Research Center, IRCCS Mondino Foundation, Pavia, Italy
1NMR Research Unit, Queen Square MS Centre, Department of Neuroinflammation, UCL Queen Square Institute of Neurology, Faculty of Brain Sciences, University College London, London, United Kingdom, 2Centre for Medical Image Computing, Department of Medical Physics and Biomedical Engineering, University College London, London, United Kingdom, 3Centre for Medical Image Computing, Department of Computer Science, University College London, London, United Kingdom, 4Universitat Oberta de Catalunya, Barcelona, Spain, 5National Institute for Health Research (NIHR) University College London Hospitals (UCLH) Biomedical Research Centre, London, United Kingdom, 6Department of Brain and Behavioral Sciences, University of Pavia, Pavia, Italy, 7Brain MRI 3T Research Center, IRCCS Mondino Foundation, Pavia, Italy
Synopsis
Magnetisation transfer ratio (MTR) is a popular MR-modality for the identification of brain anomalies in multiple sclerosis due to its sensitivity to myelin changes. It however requires dedicated sequences with long acquisition times, which make its applicability in clinics less feasible. In this work, deep learning U-net architectures have been used to extract MTR information directly from routine qualitative images, bypassing the need for specialised acquisitions. Results show strong correlation with MTR and agreement between regional distributions in normal appearing tissues, both in healthy controls and multiple sclerosis patients.
Introduction
Magnetisation transfer ratio (MTR) is key for the quantification of brain abnormalities in neurodegenerative diseases such as multiple sclerosis (MS)1, due to its established correlation with myelin density2. Standard MTR protocols require, however, long acquisition times (~25 minutes3), making it less feasible in clinics.Recently it was shown4 that standard qualitative scans, acquired as part of routine anatomical protocols, can be used to extract robust macromolecular tissue volume maps that correlated well with MTR. In this study, we further explore this result by introducing QuaSI-MTR (qualitative scans for imaging MTR): a novel deep learning framework based on U-net architectures5 that directly extracts MTR maps from qualitative scans.
Materials and Methods
Subjects and MR-acquisition: The cohort is composed of 48 subjects (28 females, age: 43±12years), consisting of 16 healthy controls, 9 primary progressive (PPMS), 17 relapsing-remitting (RRMS) and 10 secondary progressive (SPMS) patients. 24 subjects (8 controls, 3 PPMS, 9 RRMS, 4 SPMS) were used for training, 12 (3 controls, 3 PPMS, 3 RRMS, 3 SPMS) for validation and 12 (3 controls, 3 PPMS, 3 RRMS, 3 SPMS) for testing.All images were acquired on a 3T Philips Achieva MR system. The clinical scans include one PD-/T2-weighted turbo spin-echo (TE=19/85ms, TR=3.5s, 1x1x3mm3, 4:01’) and one T1-weighted spin-echo (TE=10ms, TR=625ms, 1x1x3mm3, 5:43’) per subject. MTR was acquired sagittally with two dual-echo 3D gradient-echo (TE=2.4/4.3ms, TR=30ms, 1x1x1mm3, ~12:30’), with and without a MT saturation pulse. An anatomical 3D sagittal T1-weighted (3DT1) MPRAGE was also acquired.
U-net: The U-net architecture was defined by a ResNet34 encoder6, with three input (corresponding to PD-, T2- and T1-weighted images) and one output (MTR) channels. To account for the anisotropic resolution of the data, two independent networks were trained: one U-net (hereby called Z-net) was trained over axial slices (data resolution: 1x1mm2), while the other over sagittal and coronal slices (XY-net, resolution: 1x3mm2)(Figure 1). Only slices containing at least 20% non-zero voxels (after brain extraction) were selected to avoid spurious training data. Training was conducted over 100 epochs, taking about 6 hours per network. Each epoch is composed of 32 training batches, followed by a validation step performed over the validations set. A mini-batch of 12 slices, randomly selected across subjects, was used for each training batch.
The loss function measuring the distance between the prediction ($$$y'$$$) and MTR ($$$y$$$) was defined as:
$$l(y', y) = L_2(y'-y) + L_2(G(y')-G(y))+DSSIM(y',y)$$
with $$$G$$$ indicating the Sobel gradient magnitude operator7, and $$$DSSIM$$$ the structural dissimilarity index8. At the end of the training, the network achieving the lowest validation loss was selected and tested. Z-net and XY-net provide two independent predictions which are then averaged to produce the final QuaSI-MTR map. Single-subject QuaSI-MTR regression required, on average, 50 seconds to complete on a trained network.
Training and testing were performed using Pytorch 1.0.09 on a 5GB Nvidia Quadro P2000 GPU.
Data analysis: MTR images were linearly registered10 onto PD/T2 common space before training. Lesions were segmented semi-automatically by a clinical expert on the PD-weighted images using JIM v6.0 (Xinapse systems), and then linearly registered to 3DT1 space. 3DT1 images were then lesion-filled11 and parcellated into regions of interest (ROI)12. Cortical grey matter volumes were merged into cortical lobes. For each test-subject, mean QuaSI-MTR scores were calculated over all brain ROIs, and compared with the ground-truth via Pearson correlation coefficient and t-test.
Results
Training and validation performances for Z-net and XY-net are reported in Figure 2: training loss shows a decreasing trend for both networks; conversely, validation loss appears to stabilise around 20 epochs for Z-net (minimum at the 57th epoch), while it keeps decreasing for XY-net, albeit at a lower rate compared to training. This is likely due to noise affecting the MTR data and subtle misregistration errors between MTR and PD/T2 common space: while these spurious features will eventually be learned on the training set, they will not be generalisable to the validation set, causing the validation loss to stabilise when all the useful information has been learned.QuaSI-MTR examples are shown in Figure 3. Comparisons between regional QuaSI-MTR test values and ground-truth are shown in Figure 4. The average (±standard deviation) Pearson correlation coefficient over the test set is 0.95±0.03; when using one slice orientation only: r=0.92±0.03 for axial, r=0.95±0.02 for sagittal, r=0.94±0.04 for coronal slices. These results demonstrate a very strong correlation between QuaSI-MTR and ground-truth for all groups. Regional values distributions in normal appearing tissues show no significant differences (p>0.05) for MTR and QuaSI-MTR in healthy controls and all three MS subtypes, as displayed in Figure 5.
Discussion
Strong correlation (r>0.95) between QuaSI-MTR and the ground-truth was observed. The networks learned the physical model to extract myelin-related information out of qualitative data, decoupling it from confounding effects (e.g. bias-field), which would require additional correction steps in standard model fitting.The two-network training enabled exploiting 3D information contained in the images, while using simple 2D networks, and reducing the effect of prediction errors by averaging.
Conclusion
QuaSI-MTR provides a powerful alternative to MTR in case MT-data are missing or unavailable. Requiring only routine qualitative data, QuaSI-MTR can be used to enable myelin-based studies on large historical datasets and harness the quantitative potential of qualitative images.Acknowledgements
This project has received funding under the European Union’s Horizon 2020 research and innovation programme under grant agreement No. 634541 (funding AR and FG) and 666992, and from: Engineering and Physical Sciences Research Council (EPSRC EP/R006032/1, M020533/1, G007748, I027084, M020533, N018702); INSPIRED study, funded by Spinal Research (UK), Wings for Life (Austria), Craig H. Neilsen Foundation (USA); UK Multiple Sclerosis Society (grants 892/08 and 77/2017); Department of Health's National Institute for Health Research (NIHR) Biomedical Research Centres (BRC R&D 03/10/RAG0449); Guarantors of Brain non-clinical post-doctoral Fellowships (funding FP).References
- Thompson AJ, Banwell BL, Barkhof F, Carroll WM, Coetzee T, Comi G, Correale J, Fazekas F, Filippi M, Freedman MS, Fujihara K. Diagnosis of multiple sclerosis: 2017 revisions of the McDonald criteria. The Lancet Neurology. 2018 Feb 1;17(2):162-73.
- Schmierer K, Scaravilli F, Altmann DR, Barker GJ, Miller DH. Magnetization transfer ratio and myelin in postmortem multiple sclerosis brain. Annals of neurology. 2004 Sep;56(3):407-15.
- Pardini M, Sudre CH, Prados F, Yaldizli Ö, Sethi V, Muhlert N, Samson RS, van de Pavert SH, Cardoso MJ, Ourselin S, Wheeler-Kingshott CA. Relationship of grey and white matter abnormalities with distance from the surface of the brain in multiple sclerosis. J Neurol Neurosurg Psychiatry. 2016 Nov 1;87(11):1212-7.
- Ricciardi A, Grussu F, Battiston M, Prados F, Kanber B, Samson RS, Alexander DC, Chard DT, Gandini Wheeler-Kingshott CAM. Myelin-sensitive indices in multiple sclerosis: the unseen qualities of qualitative clinical MRI, ISMRM 2019.
- Ronneberger O, Fischer P, Brox T. U-net: Convolutional networks for biomedical image segmentation. InInternational Conference on Medical image computing and computer-assisted intervention 2015 Oct 5 (pp. 234-241). Springer, Cham.
- He K, Zhang X, Ren S, Sun J. Deep residual learning for image recognition. InProceedings of the IEEE conference on computer vision and pattern recognition 2016 (pp. 770-778).
- Riba E, Mishkin D, Ponsa D, Rublee E, Bradski G. Kornia: an Open Source Differentiable Computer Vision Library for PyTorch. arXiv preprint arXiv:1910.02190. 2019 Oct 5.
- Wang Z, Bovik AC, Sheikh HR, Simoncelli EP. Image quality assessment: from error visibility to structural similarity. IEEE transactions on image processing. 2004 Apr 13;13(4):600-12.
- Paszke A, Gross S, Chintala S, Chanan G, Yang E, DeVito Z, Lin Z, Desmaison A, Antiga L, Lerer A. Automatic differentiation in pytorch.
- Modat M, Cash DM, Daga P, Winston GP, Duncan JS, Ourselin S. Global image registration using a symmetric block-matching approach. Journal of Medical Imaging. 2014 Sep;1(2):024003.
- Prados F, Cardoso MJ, Kanber B, Ciccarelli O, Kapoor R, Wheeler-Kingshott CA, Ourselin S. A multi-time-point modality-agnostic patch-based method for lesion filling in multiple sclerosis. Neuroimage. 2016 Oct 1;139:376-84.
- Cardoso MJ, Modat M, Wolz R, Melbourne A, Cash D, Rueckert D, Ourselin S. Geodesic information flows: spatially-variant graphs and their application to segmentation and fusion. IEEE transactions on medical imaging. 2015 Apr 14;34(9):1976-88.
Figures
Figure 1: Diagram of the QuaSI-MTR regression process. Two different U-nets were trained based on the resolution of input data: Z-net, which uses 1x1mm2 axial slices, and XY-net, which uses 1x3mm2 sagittal and coronal slices. The networks produce two independent predictions, which are then averaged into the final QuaSI-MTR.
Figure 2: Training and validation loss over 100 epochs. Each colour represents a different training epoch, at the end of which validation is performed. The training loss (semi-transparent markers) decreases over time, while the validation loss (opaque markers) slows down (XY-net) or stops (Z-net). We hypothesise this is due to noise and misregistration errors, both slowly learned on the training set, but not generalisable to the validation set, causing the validation loss to stabilise when all the useful information has been learned.
Figure 3: Examples of QuaSI-MTR. The first three rows show qualitative images, ground-truth MTR, QuaSI-MTR and absolute error maps for one control, PPMS and SPMS test-subjects. Residuals are highest at the borders of high contrast regions (cerebro-spinal fluid and lesions); they are instead homogeneous and significantly lower in normal appearing tissues. In the bottom-right row, one RRMS subject is shown, which we excluded due to the extremely noisy ground-truth; QuaSI-MTR however, lacks such artifacts. This subject is shown as an example of the usefulness of this method.
Figure 4: Comparison between mean MTR and QuaSI-MTR regional values. QuaSI-MTR strongly correlates with MTR (mean Pearson correlation coefficient r=0.95) across all test-subjects. Each masker correspond to a different brain ROI, whose tissue type is specified in the legend, e.g. cortical grey matter (GM) lobes in blue, deep GM structures in yellow, or white matter (WM) regions in red.
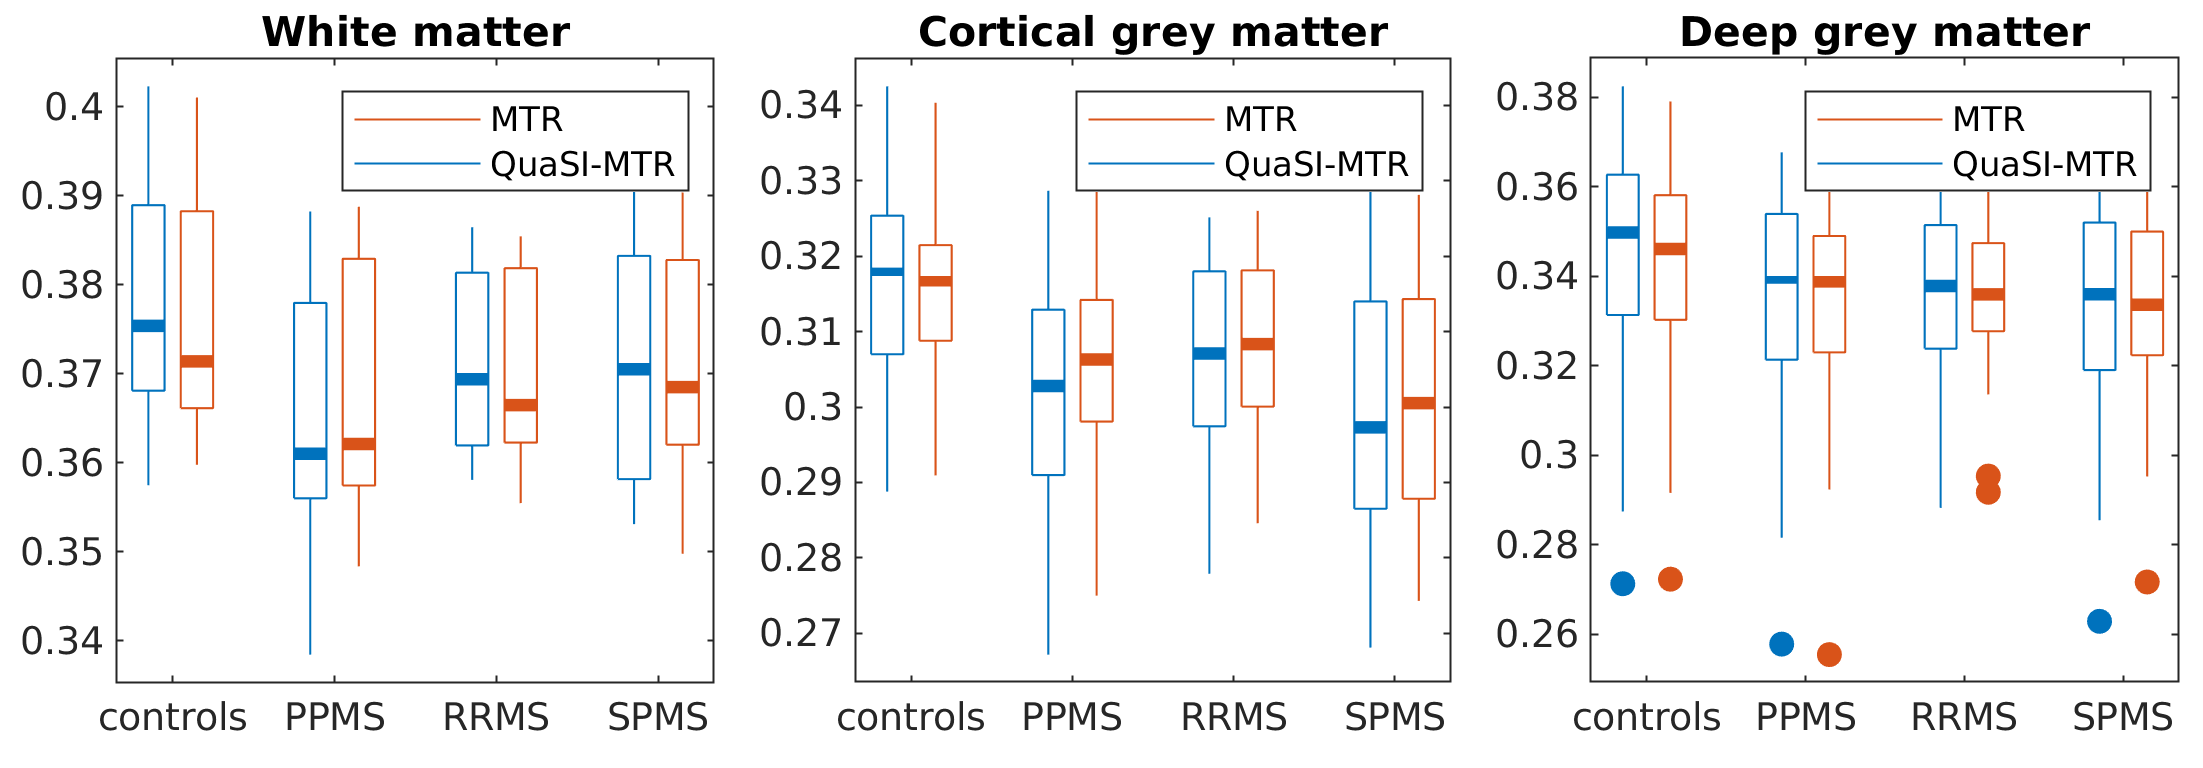
Figure 5: Distributions of regional values in normal appearing tissues. QuaSI-MTR regional values distribute similarly to the ground-truth across all tissues and groups. No significant differences (t-test) have been found between MTR and QuaSI-MTR distributions. The deep grey matter outliers shown in the third plot correspond to the same subjects for both MTR and QuaSI-MTR.