1824
Viscerotoxic Brain Infarcts: A Voxel-Based Neuroanatomic Localization Study1Martinos Center for Biomedical Imaging, Charlestown, MA, United States, 2University of Lincoln, Lincoln, United Kingdom, 3University of Washington, Seattle, WA, United States
Synopsis
It is currently not fully known what parts of the human brain predispose to neurogenic organ injury when injured. In this study, we aimed to identify the neuroanatomic correlates of a broad range of cardiac and systemic alterations occurring after ischemic stroke. Using a mapping technique that is free from the bias of a-priori hypothesis as to any specific location, we show that both cardiac and systemic abnormalities occurring after stroke map to specific infarct locations on diffusion-weighted MR. We show that these maps are predictive of the abnormalities as well as patient outcomes.
Introduction
Classic textbook teaching has been that problems in internal organs, such as atrial fibrillation in the heart, lead to problems in the brain, such as ischemic stroke. However, emerging evidence suggests that acute brain injury could independently lead to internal organ injury as well, often with serious outcomes ranging from transient dysfunction to permanent morphological injury in internal organ systems. This form of injury, which is called neurogenic organ injury (NOI), is thought to result from excessive activation of or withdrawal of inhibitory inputs on central autonomic modulation centers by stroke lesions resulting in pathologically increased activity of the autonomic nervous system.1,2 While autonomic response is generally considered systemic, i.e., response throughout the system is total, organic brain injury can cause organ-selective activation where manifestations depend on the organ involved.3,4 Organ specificity may indicate the existence of a viscerotopic organization in the brain, analogous to the somatotopic organization, where each organ or visceral function is governed by discrete regions of the brain. It is currently not fully known what parts of the human brain predispose to NOI when injured. In this study, we aimed to identify the neuroanatomic correlates of a broad range of cardiac and systemic alterations occurring after ischemic stroke using a method that is free from the bias of an a priori hypothesis as to any specific location. Our goal was to understand how internal organ dysfunction after acute ischemic stroke might be mediated.Methods
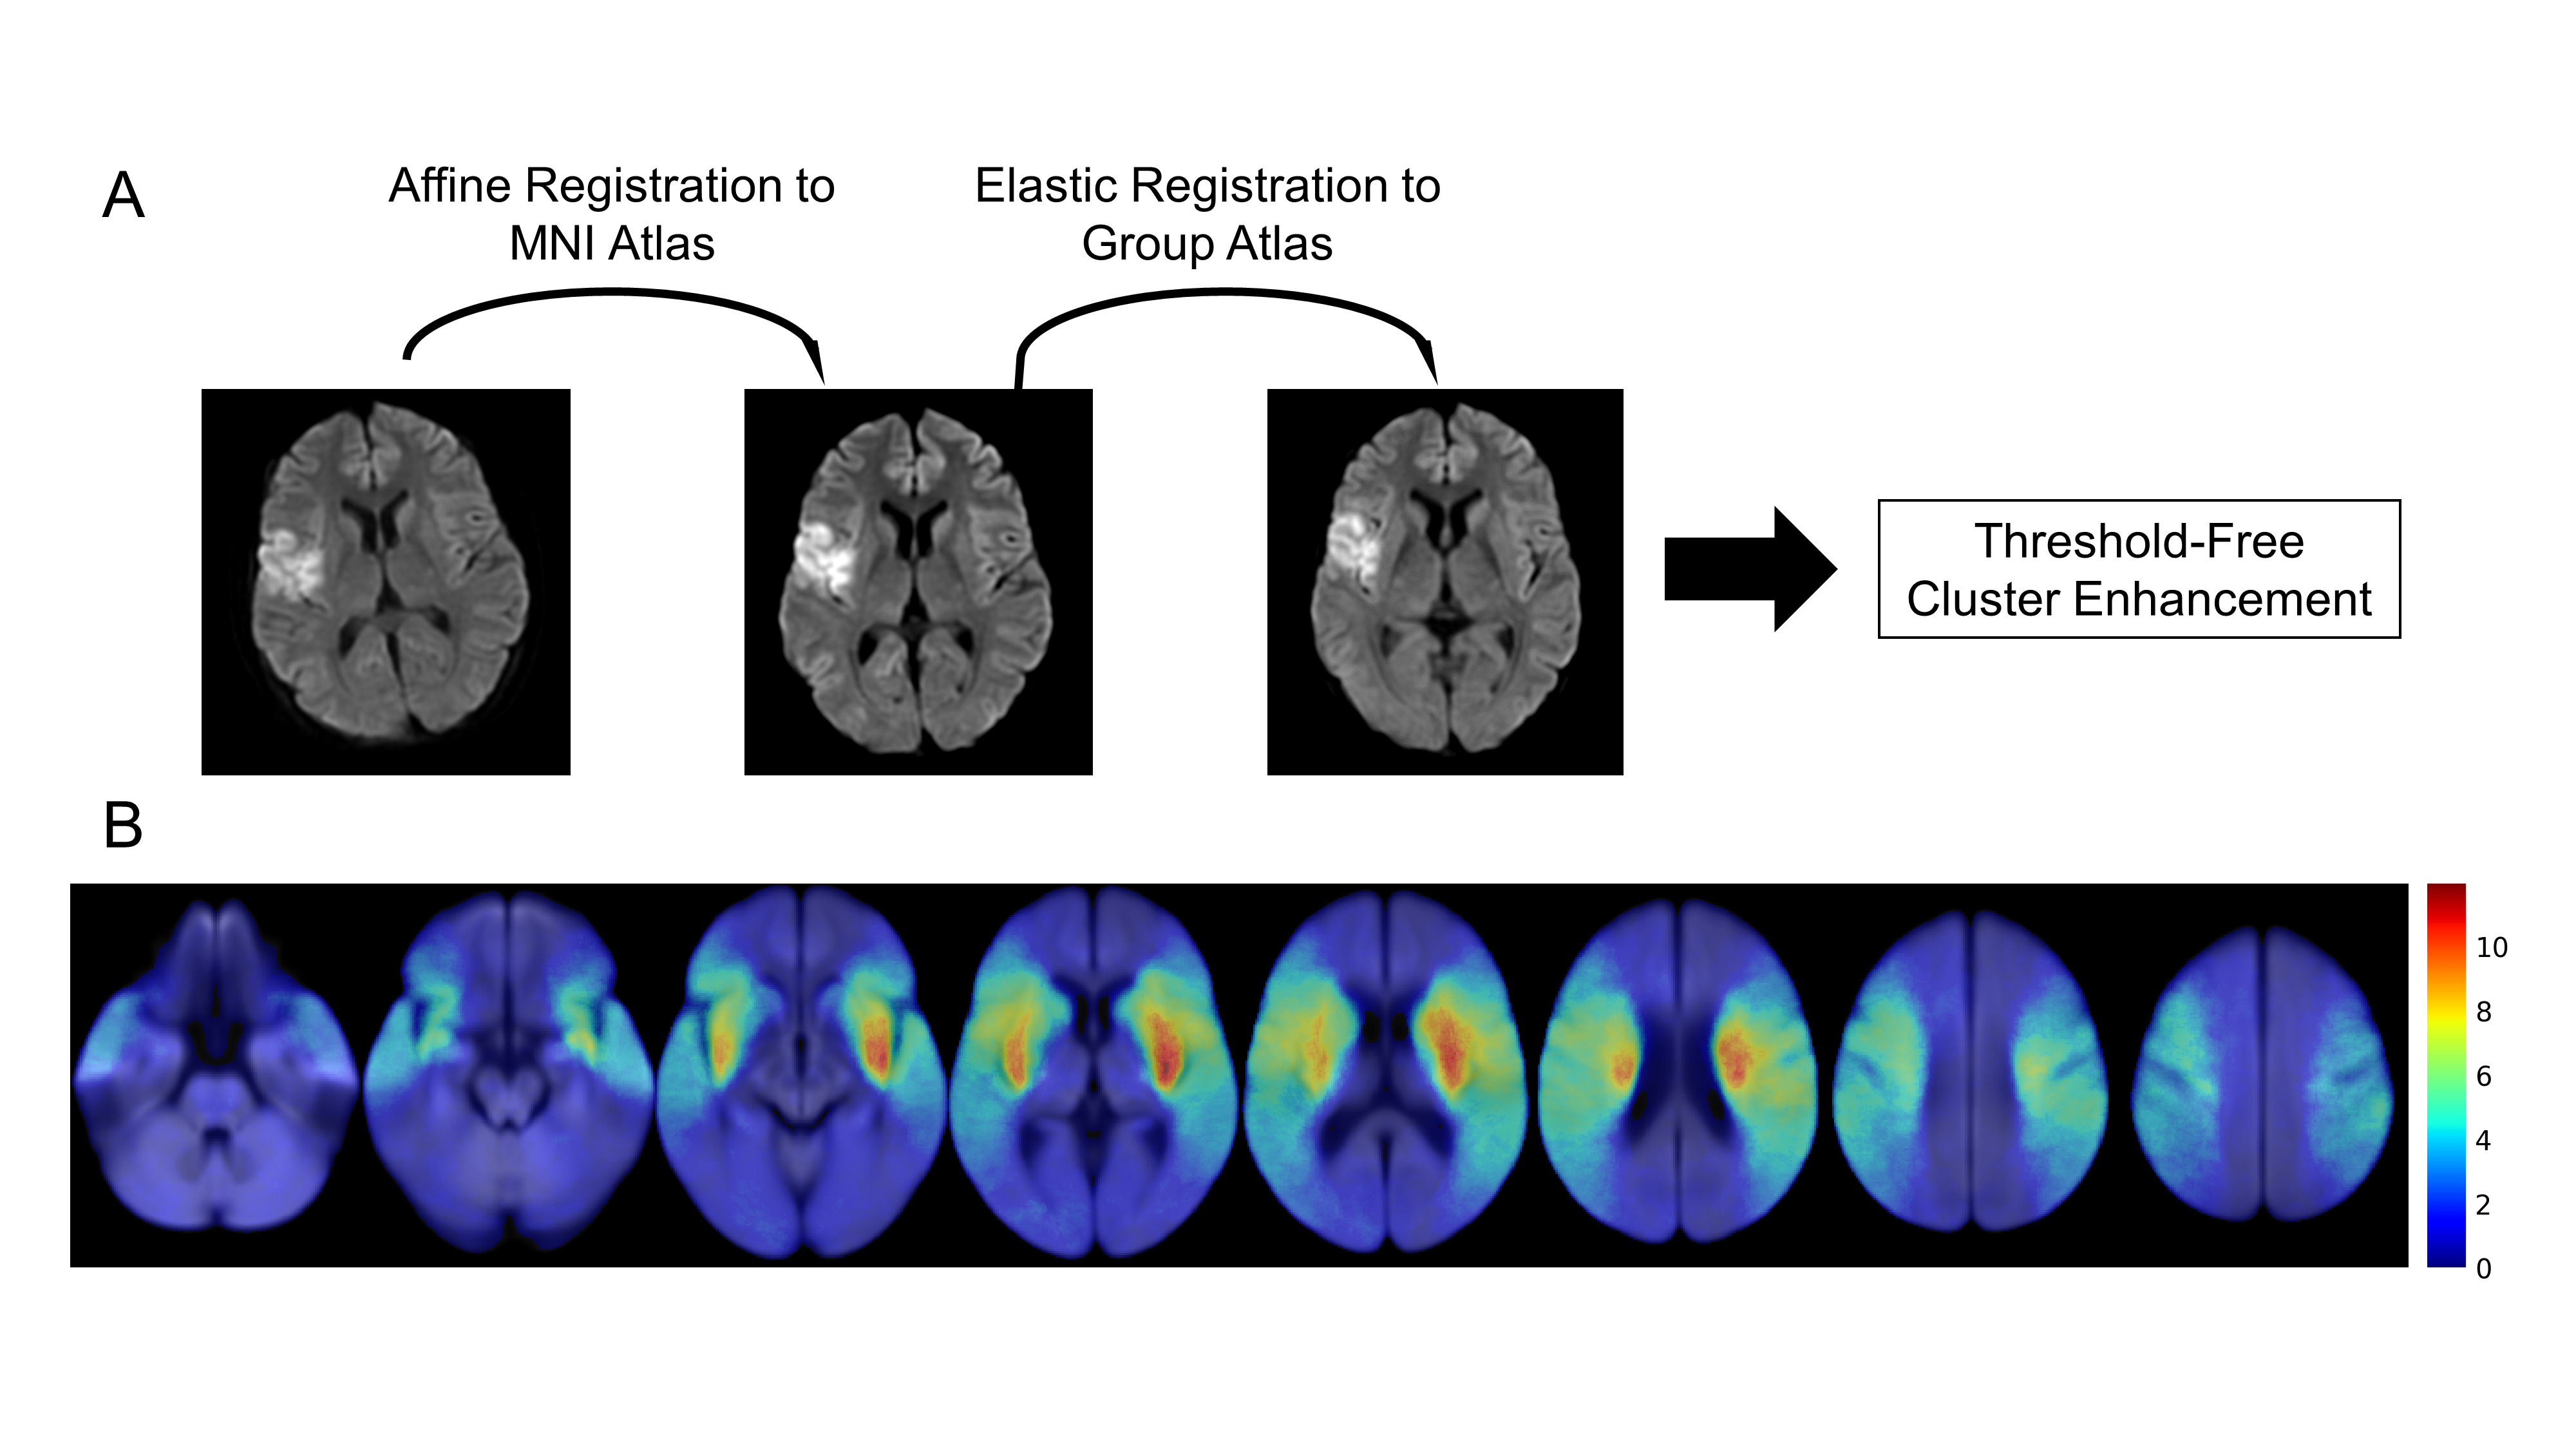
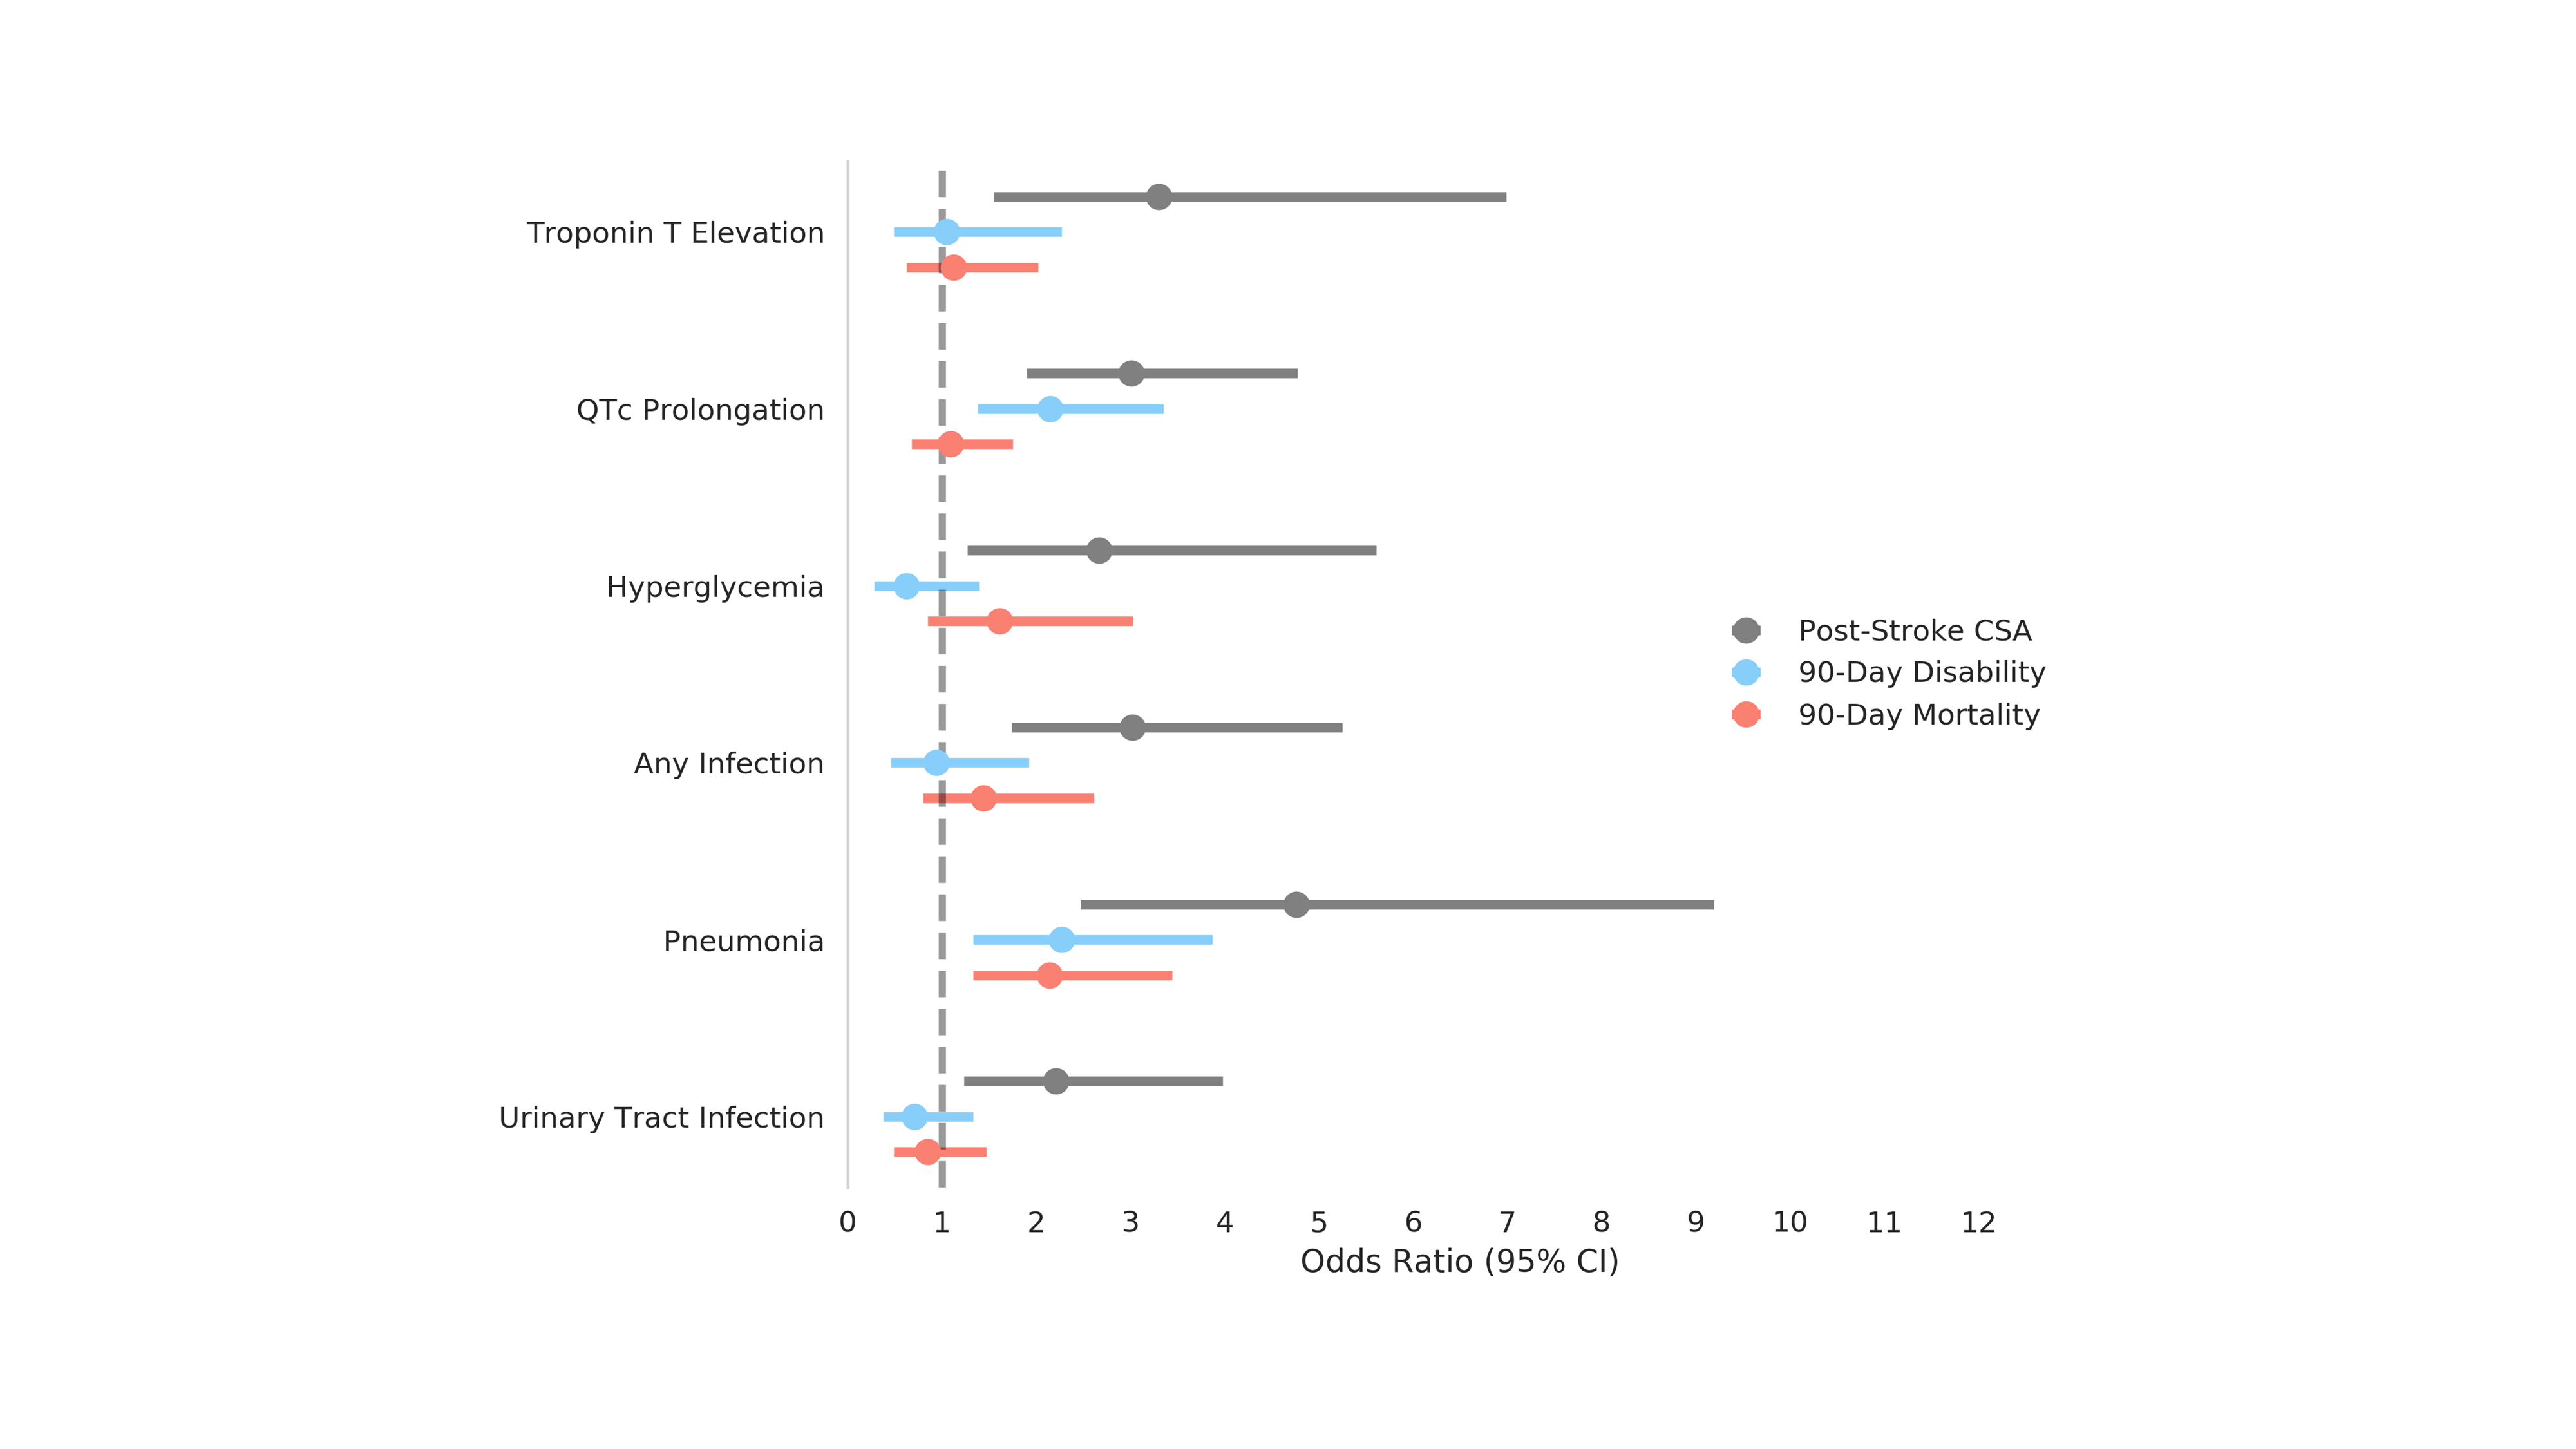
We explored the neuroanatomic correlates of four different post-stroke cardiac or systemic abnormalities (CSA) that included plasma cardiac troponin T (cTnT) elevation as a marker of structural cardiac injury, QT segment prolongation on ECG as a marker of electrophysiological cardiac alteration, pneumonia and urinary tract infection (UTI) as a marker of altered pulmonary, urinary, or immune system functioning, and acute stress hyperglycemia (ASH) as a marker of increased glycogenolysis in the liver. A corrected QT interval (QTc) was calculated using the Bazett's formula: QTc = QT interval / square root of the RR interval (sec). For 1208 patients in the prospective, longitudinal, consecutive, NIH-funded study (Heart-Brain Interactions Study), a neuroradiologist manually generated binary maps of acute infarcts on DWI. The diffusion weighted images and corresponding outline images were co-registered to the Montreal Neurological Institute (MNI) 152 template using a 12-degrees of freedom affine transformation via the BRAINSFit module in 3D Slicer.5,6 This was followed by iterative groupwise elastic registration using SimpleElastix.7 The diffusion images and corresponding outline images were subsequently re-sampled at 4 mm isotropic resolution in for faster permutation calculation. P-value maps were generated using threshold-free cluster enhancement via Randomise in FMRIB Software Library with sex and age as covariates (Fig. 1A).8,9 Using a nonparametric permutation test with 5,000 permutations, significance was reported at a family-wise error corrected p < .05.10 Overlap of each patient with the resulting neuroanatomic maps was calculated. Logistic regression models were fit with an overlap ratio of 10% for each of the neuroanatomic maps to determine the odds ratio for an abnormal lab test, 90-day disability (90-day modified Rankin Score > 2), and 90-day survival, correcting for infarct volume.Results
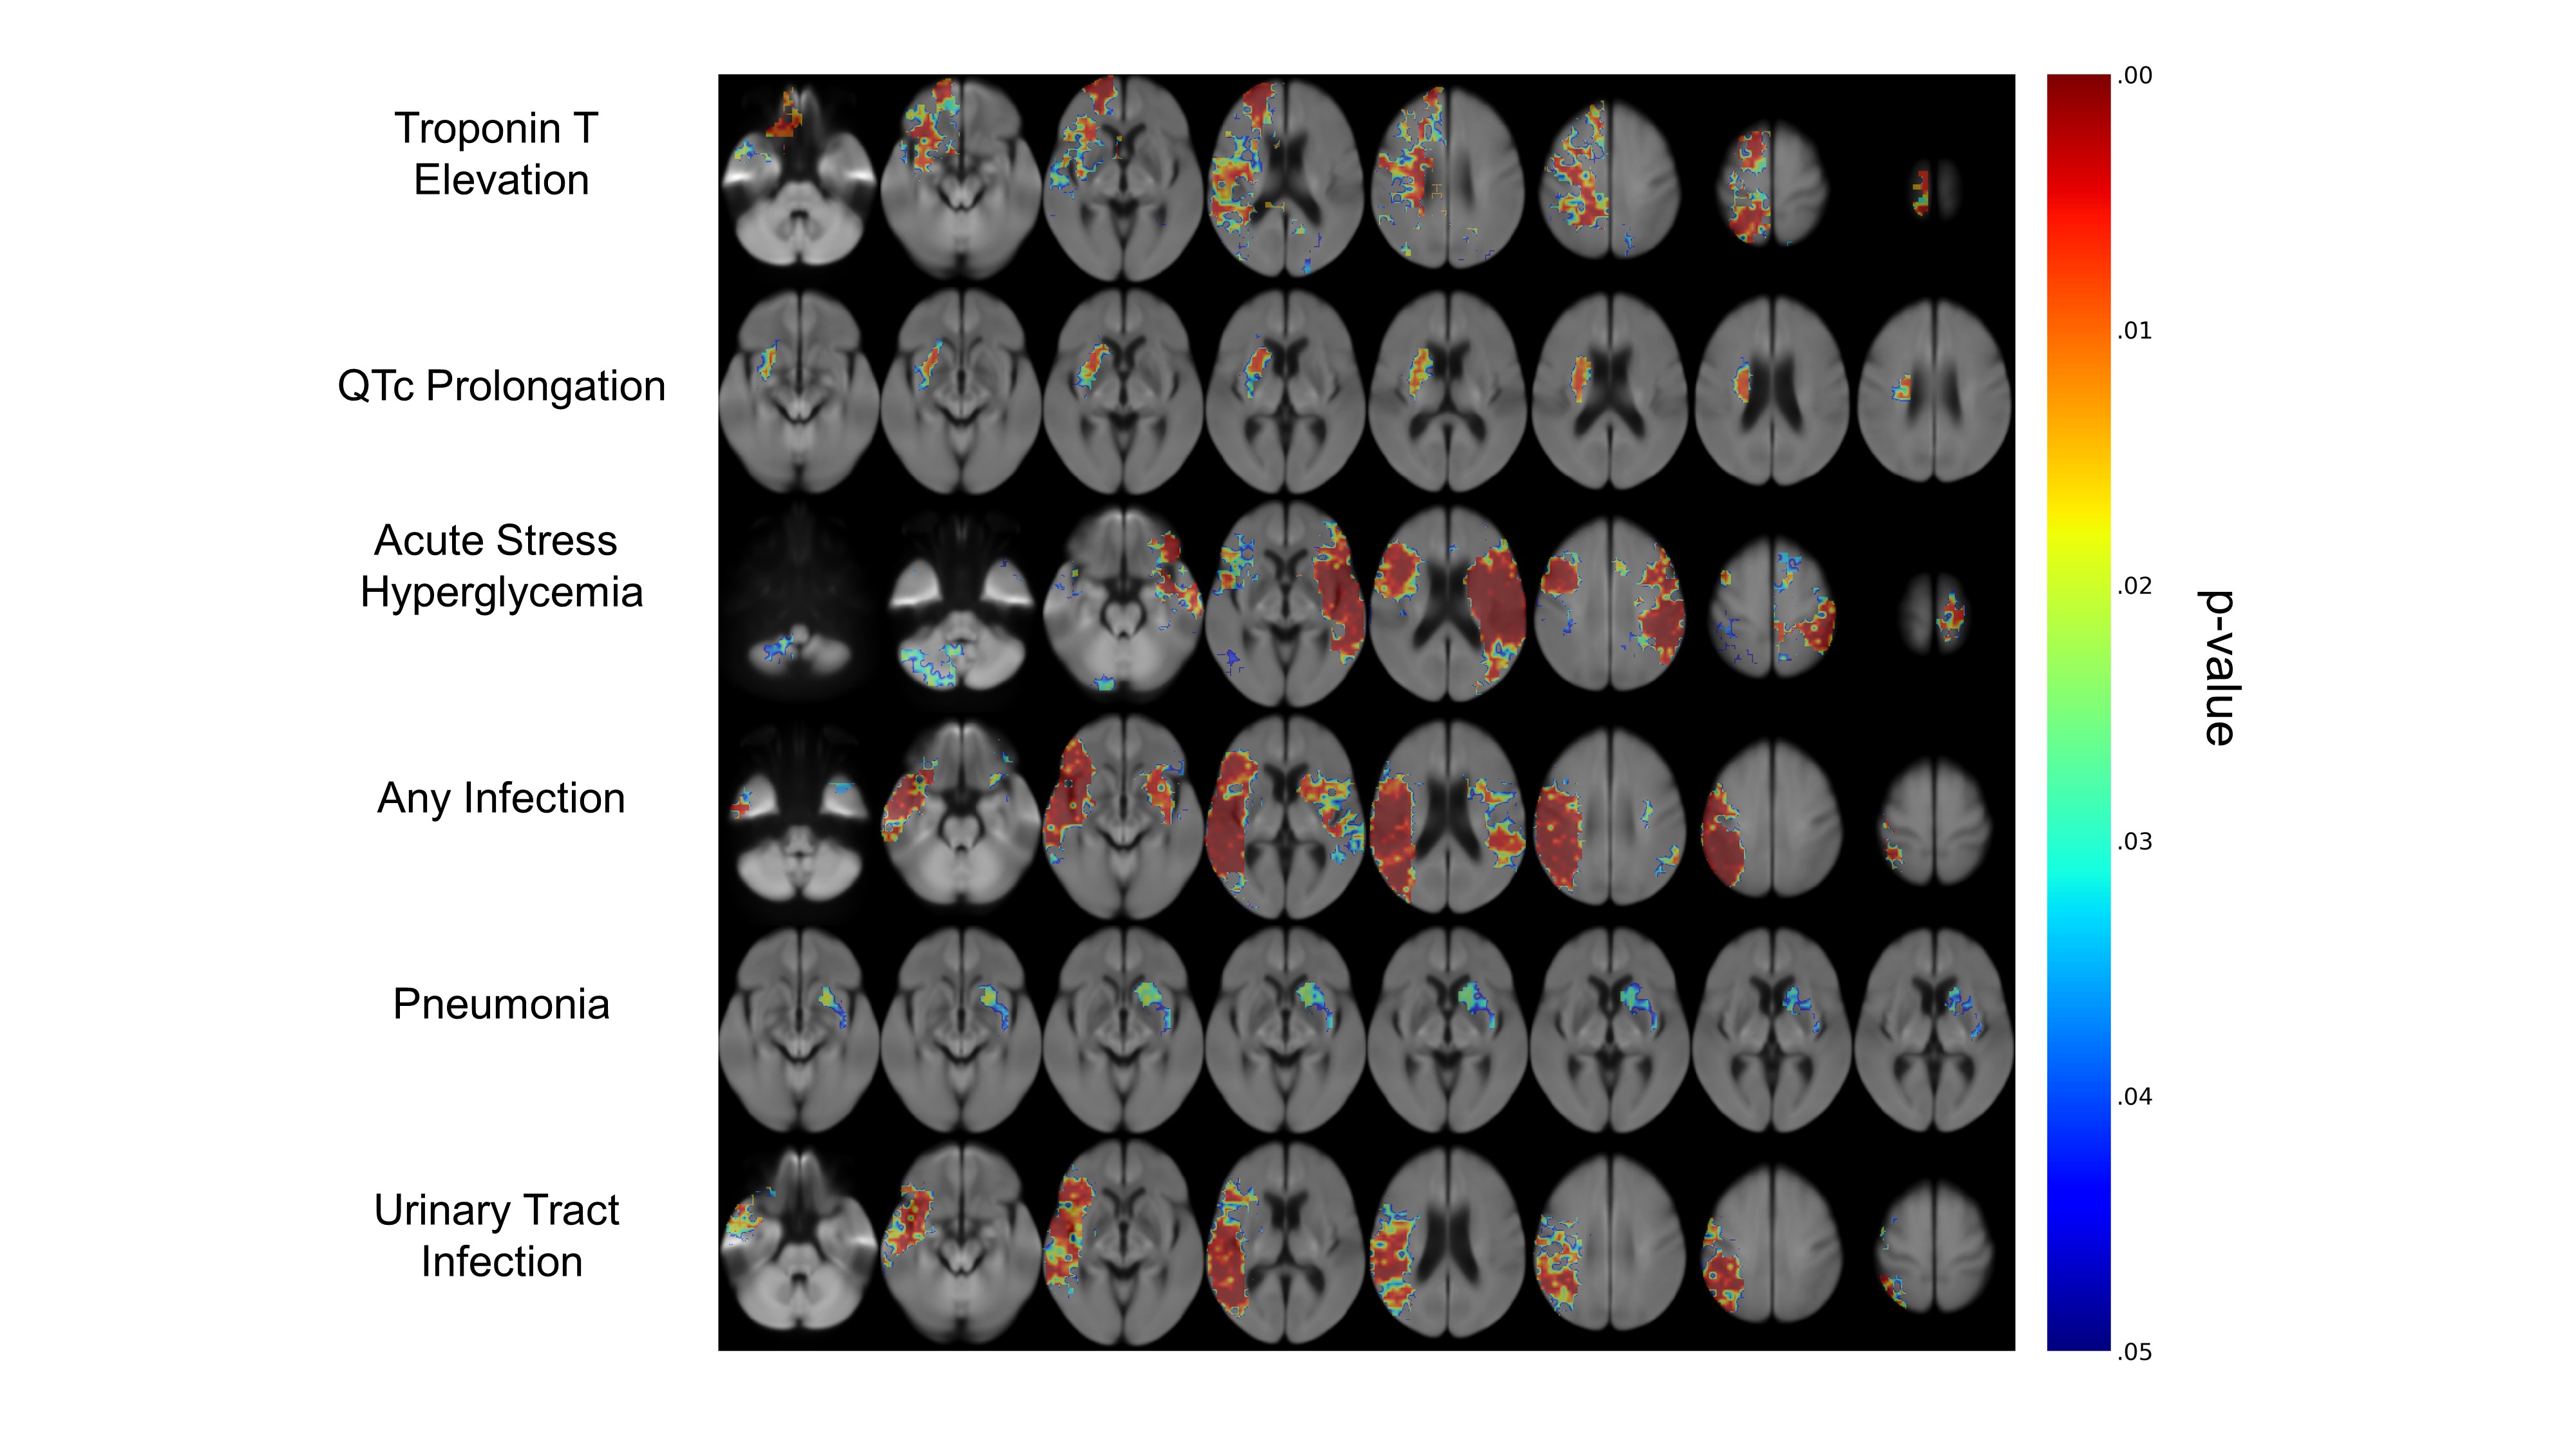
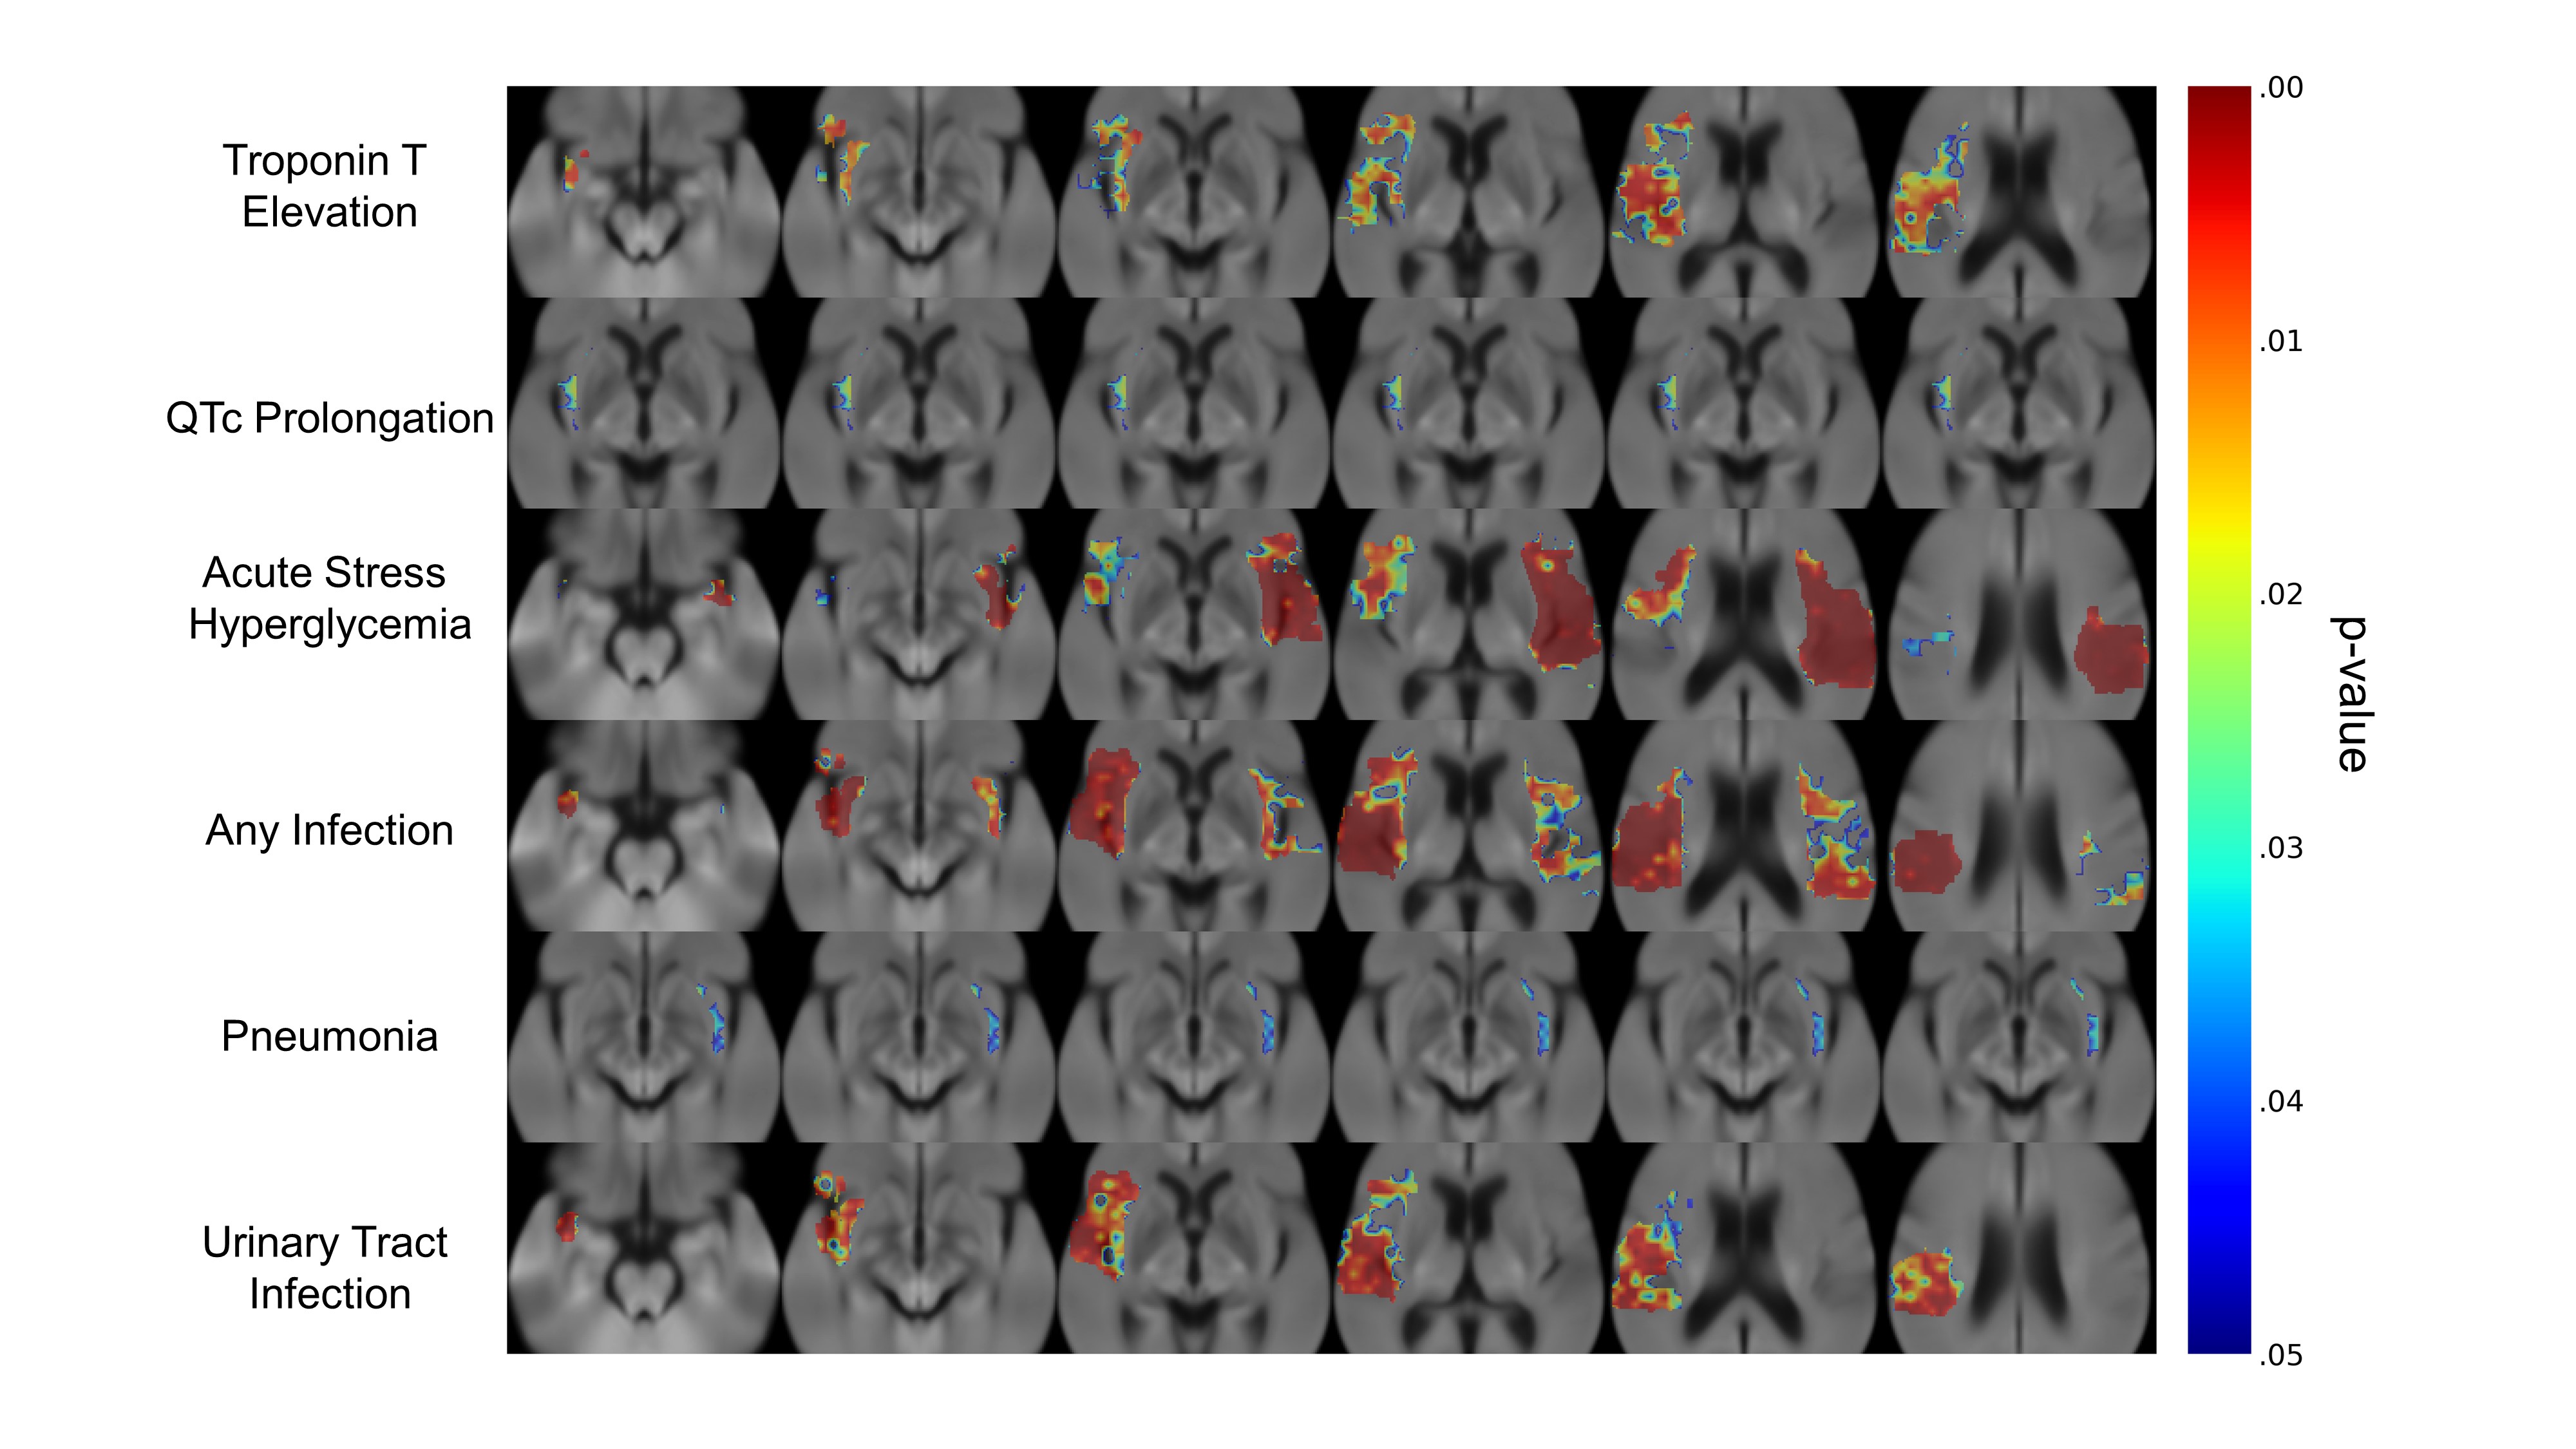
Fig. 1B demonstrates topographic distribution of coregistered binary infarct maps showing infarct probability in all 1208 consecutive patients. The burden of stroke on the brain was mainly on deep hemispheric gray and white matter structures. Fig. 2 demonstrates the neuroanatomic maps for each CSA. We identified at least one cluster for each CSA. The clusters for cTnT elevation and QTc prolongation were both located in the right hemisphere. There were three clusters for ASH, a small cluster in the right hemisphere, a small cluster in the cerebellum, and a large one in the left hemisphere. There were two clusters for post-stroke infection, one in the right and the second one in the left hemisphere. Infection type specific maps revealed that the cluster on the left was exclusively associated with pneumonia whereas the one on the right with UTI (Fig. 2). All CSA maps displayed overlap with the insula and opercula regions (Fig. 3). Overlap with all maps were predictive of post-stroke CSA. Overlap with QTc prolongation and pneumonia maps was predictive of 90-day functional disability. Overlap with the pneumonia map was predictive of 90-day mortality (Fig. 4).Conclusion
Using a mapping technique that is free from the bias of a-priori hypothesis as to any specific location, we show that both cardiac and systemic abnormalities occurring after stroke map to specific regions in the brain. We show that maps for all abnormalities overlap in part with the insula and opercula. We also show that these maps are predictive of the abnormalities as well as patient outcomes, showing the potential utility of the maps to aid with clinical-decision making.Acknowledgements
We would like to acknowledge the GPU computing resources provided by the MGH and BWH Center for Clinical Data Science. This project was supported by the National Institute of Biomedical Imaging and Bioengineering (NIBIB) of the National Institutes of Health under award number 5T32EB1680 to K. Chang and J. Patel and by the National Cancer Institute of the National Institutes of Health under Award Number F30CA239407 to K. Chang. The content is solely the responsibility of the authors and does not necessarily represent the official views of the National Institutes of Health. Heart and Brain Interactions in Stroke Study was supported by the National Institutes of Health grant R01-NS059710 to H. Ay. This publication was supported from the Martinos Scholars fund to K. Hoebel. Its contents are solely the responsibility of the authors and do not necessarily represent the official views of the Martinos Scholars fund. This study was supported by National Institutes of Health grants U01-CA154601, U24-CA180927, and U24-CA180918 to J. Kalpathy-Cramer. This research was carried out in whole or in part at the Athinoula A. Martinos Center for Biomedical Imaging at the Massachusetts General Hospital, using resources provided by the Center for Functional Neuroimaging Technologies, P41EB015896, a P41 Biotechnology Resource Grant supported by the National Institute of Biomedical Imaging and Bioengineering (NIBIB), National Institutes of Health.References
1. Oppenheimer, S. M. & Cechetto, D. F. Cardiac chronotropic organization of the rat insular cortex. Brain Res. (1990). doi:10.1016/0006-8993(90)91796-J
2. Cechetto, D. F. et al. Autonomic and myocardial changes in middle cerebral artery occlusion: stroke models in the rat. Brain Res. (1989). doi:10.1016/0006-8993(89)90625-2
3. Ay, H. et al. Neuroanatomic correlates of stroke-related myocardial injury. Neurology (2006). doi:10.1212/01.wnl.0000206077.13705.6d
4. Krause, T. et al. Stroke in right dorsal anterior insular cortex Is related to myocardial injury. Ann. Neurol. (2017). doi:10.1002/ana.24906
5. Johnson, H., Harris, G. & Williams, K. BRAINSFit: Mutual Information Rigid Registrations of Whole-Brain 3D Images, Using the Insight Toolkit. Insight J. 1–10 (2007).
6. Fedorov, A. et al. 3D Slicer as an image computing platform for the Quantitative Imaging Network. Magn. Reson. Imaging 30, 1323–1341 (2012).
7. Marstal, K., Berendsen, F., Staring, M. & Klein, S. SimpleElastix: A User-Friendly, Multi-lingual Library for Medical Image Registration. in IEEE Computer Society Conference on Computer Vision and Pattern Recognition Workshops 574–582 (2016). doi:10.1109/CVPRW.2016.78
8. Smith, S. M. & Nichols, T. E. Threshold-free cluster enhancement: Addressing problems of smoothing, threshold dependence and localisation in cluster inference. Neuroimage 44, 83–98 (2009). 9. Woolrich, M. W. et al. Bayesian analysis of neuroimaging data in FSL. Neuroimage (2009). doi:10.1016/j.neuroimage.2008.10.055
10. Nichols, T. E. & Holmes, A. P. Nonparametric permutation tests for functional neuroimaging: A primer with examples. Hum. Brain Mapp. (2002). doi:10.1002/hbm.1058
Figures