1820
Quantitative Measurement of Cerebral Oxygen Extraction in Patients with Sickle Cell Disease after Diamox Infusion Using Asymmetric Spin Echo1Biomedical Engineering, University of Southern California, Los Angeles, CA, United States, 2Neuroscience Graduate Program, University of Southern California, Los Angeles, CA, United States, 3Academic Medical Center, Amsterdam, Netherlands, 4Division of Cardiology, Children's Hospital Los Angeles, Los Angeles, CA, United States
Synopsis
This study demonstrated tissue oxygen extraction change in patients with sickle cell disease after Acetazolamide injection using Asymmetric Spin Echo technique, and compared with global oxygen extraction change revealed by TRUST. The results suggested that global oxygen extraction decreased as blood flow increased, while tissue oxygen extraction remained stable. And this mismatch might be a proof to the existence of "physiological shunting".
Introduction
Sickle cell disease (SCD) is caused by hemoglobin mutation, causing chronic hemolytic anemia.1,2 The quantitative analysis of cerebral oxygen extraction fraction (OEF) is important in assessing the balance between oxygen supply and demand for SCD. Asymmetric Spin Echo (ASE) sequence is a modified spin echo sequence whose contrast is sensitive to R2’ and venous volume fraction, allowing calculation of voxel-wise OEF maps, offering tissue OEF information. Previous studies have examined relative OEF changes during prolonged inhaled gas challenges.3 Unfortunately, these challenges can modify cerebral metabolic rate of oxygen (CMRO2) in addition to blood flow and blood volume, complicating their interpretation.4,5 In this study, we used acetazolamide injection to evaluate tissue and global OEF changes in patients with sickle cell disease. Acetazolamide (Diamox) is an exogenous vasoactive stimulus that causes cerebral vasodilation. We hypothesized that acetazolamide would increase non-nutritive cerebral blood flow (CBF), decreasing whole brain OEF proportional to the changes in brain blood flow with relatively little change in tissue OEF.Methods
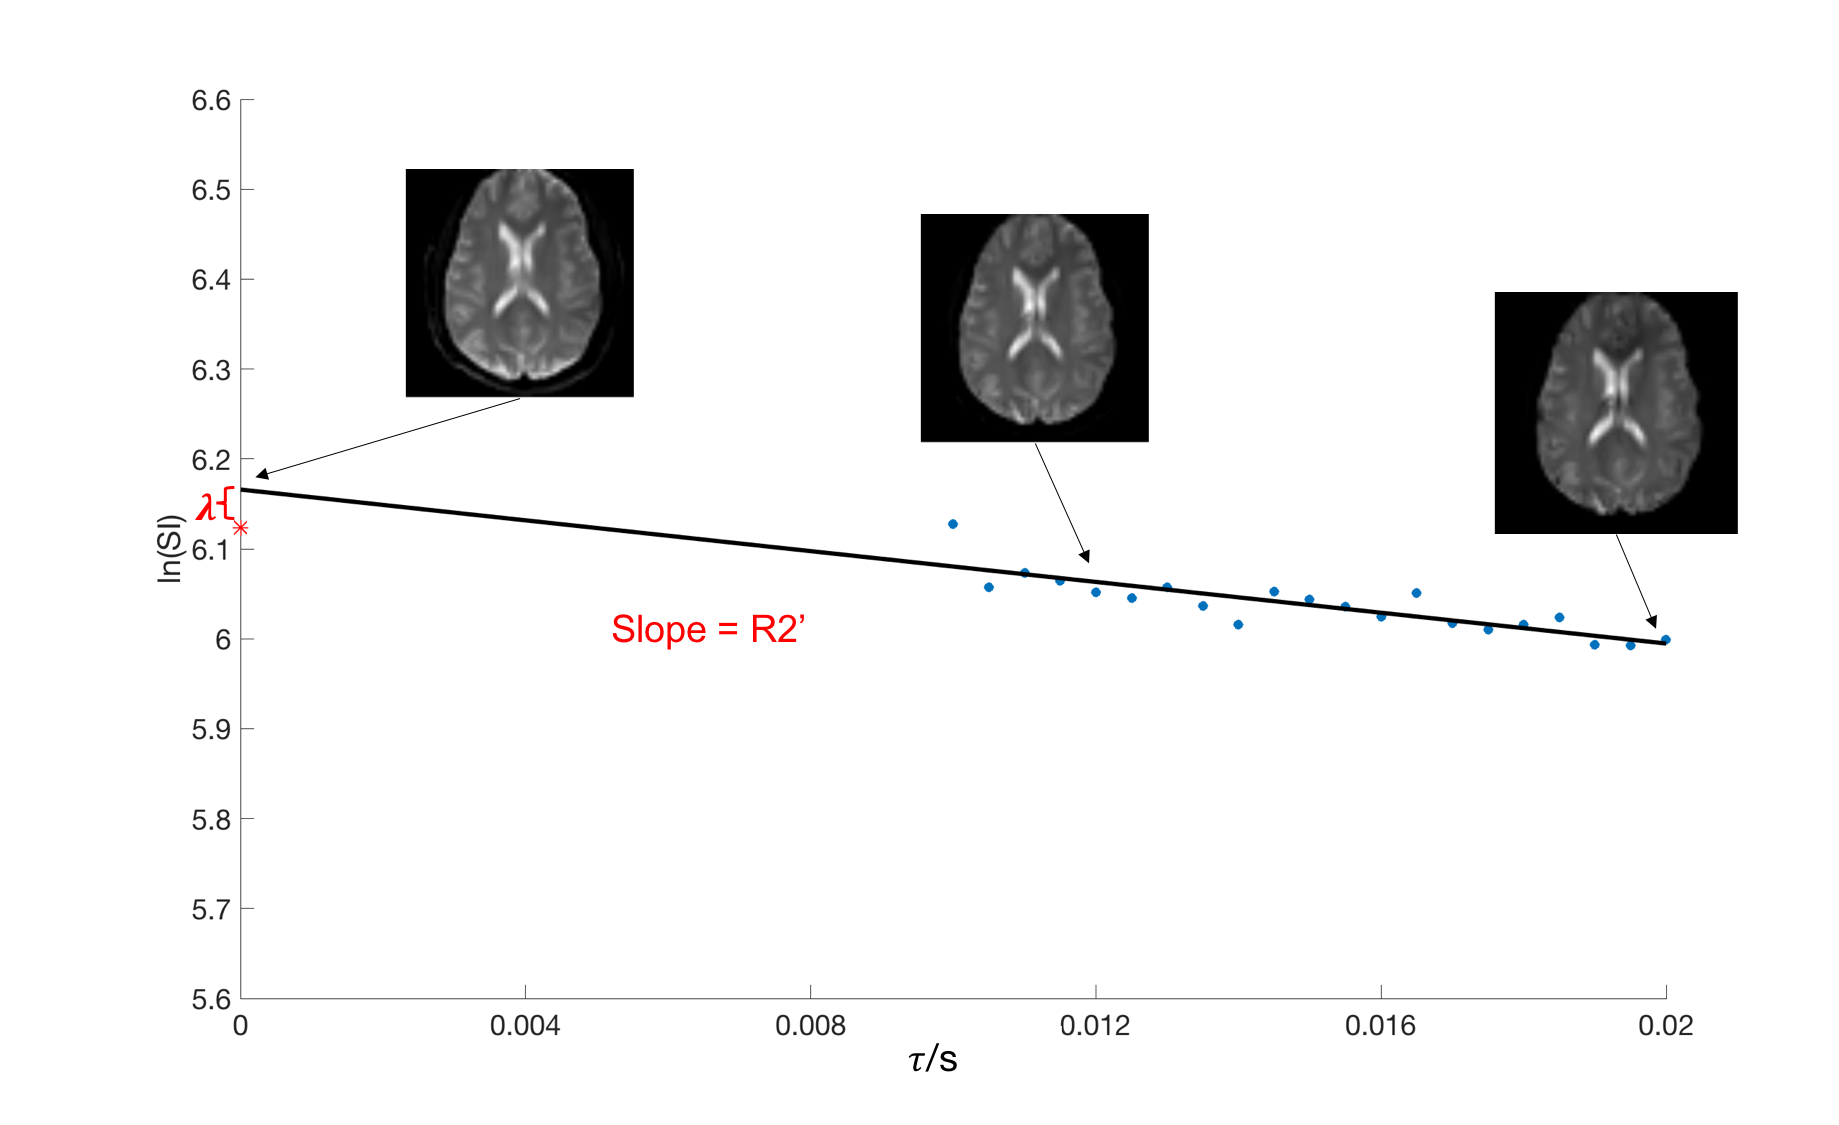
Theory: ASE can be viewed as a modification of SE in which the acquisition window is shifted in time relative to the center of spin echo, increasing dephasing and creating signal decay with R2’ contrast. The signal decay can be calculated as6,7:$$S(\tau) = \rho*(1-\lambda)*f(\lambda, \delta\omega, \tau)*exp(-TE/T2)*g(\tau, T1, TR)(1)$$where ρ is the spin density, λ is the venous blood volume fraction, τ is the time shift from the expected echo formation, and δw is the frequency shift induced by the microscopic susceptibility. In the presence of randomly oriented cylinders containing de-oxygenated hemoglobin, δw can be written as follows: $$\delta\omega = 4/3*\pi*\gamma*\chi*Hct*B_{0}*OEF(2)$$
where γ is the gyro-magnetic ratio, B0 is the main magnetic field strength, Hct is the fractional hematocrit and Δχ is the susceptibility difference between fully oxygenated and fully deoxygenated blood. The reversible relaxation rate, R2’, is simply the product of λ and δw. With constant TE and a sufficiently long TR, the signal decay can be simplified to two relaxation regimes separated by :$$S_{s}(\tau) = c * exp(-0.3*\lambda*(\delta\omega*2\tau)^{2})(3)$$ $$S_{L}(\tau) = c * exp(-\lambda*\delta\omega*2\tau+\lambda)(4)$$
R2’ and λ can be estimated calculating the slope and intercept of plot of log (SL(t)) versus 2t (Eq 3).
MRI acquisition: A total of 8 patients (female 25%, age 24±4) with sickle cell disease were studied. All subjects underwent an MR study using Philips 3T Achieva with a 32-element head coil. For each subject, ASE was acquired before and after infusing acetazolamide (16 mg/kg over three minutes) with the following parameters: TR = 3s, TE = 62ms, resolution = 3mm * 3mm * 6mm, matrix size = 64*64, range = 10ms : 0.5ms : 20ms. Each scan was composed of 28 dynamics, including 7 spin echo scans (τ = 0) and other 21 equally spaced τ values from 10ms to 20ms. All subjects also underwent normal anatomical 3D T1 and T2 scans. Total brain blood flow and global cerebral oxygenation were measured by phase contrast MRI and T2 relaxation under spin tagging as previously described.4,8
Image Processing: For each subject, the ASE data were smoothed by a 3*3 Gaussian kernel. We rigidly registered the ASE data to skull-stripped T1 image (BrainSuite), and generated masks of gray matter and white matter using FMRIB Software Library (FSL) Automated Segmentation Tool (FAST).9 For every voxel in ASE dataset, the first 7 spin echo values were averaged, and the other 21 values with different τ values were fitted linearly in log space to generate R2’ and λ. Voxel-wise OEF maps were subsequently derived using equation 2.
Results
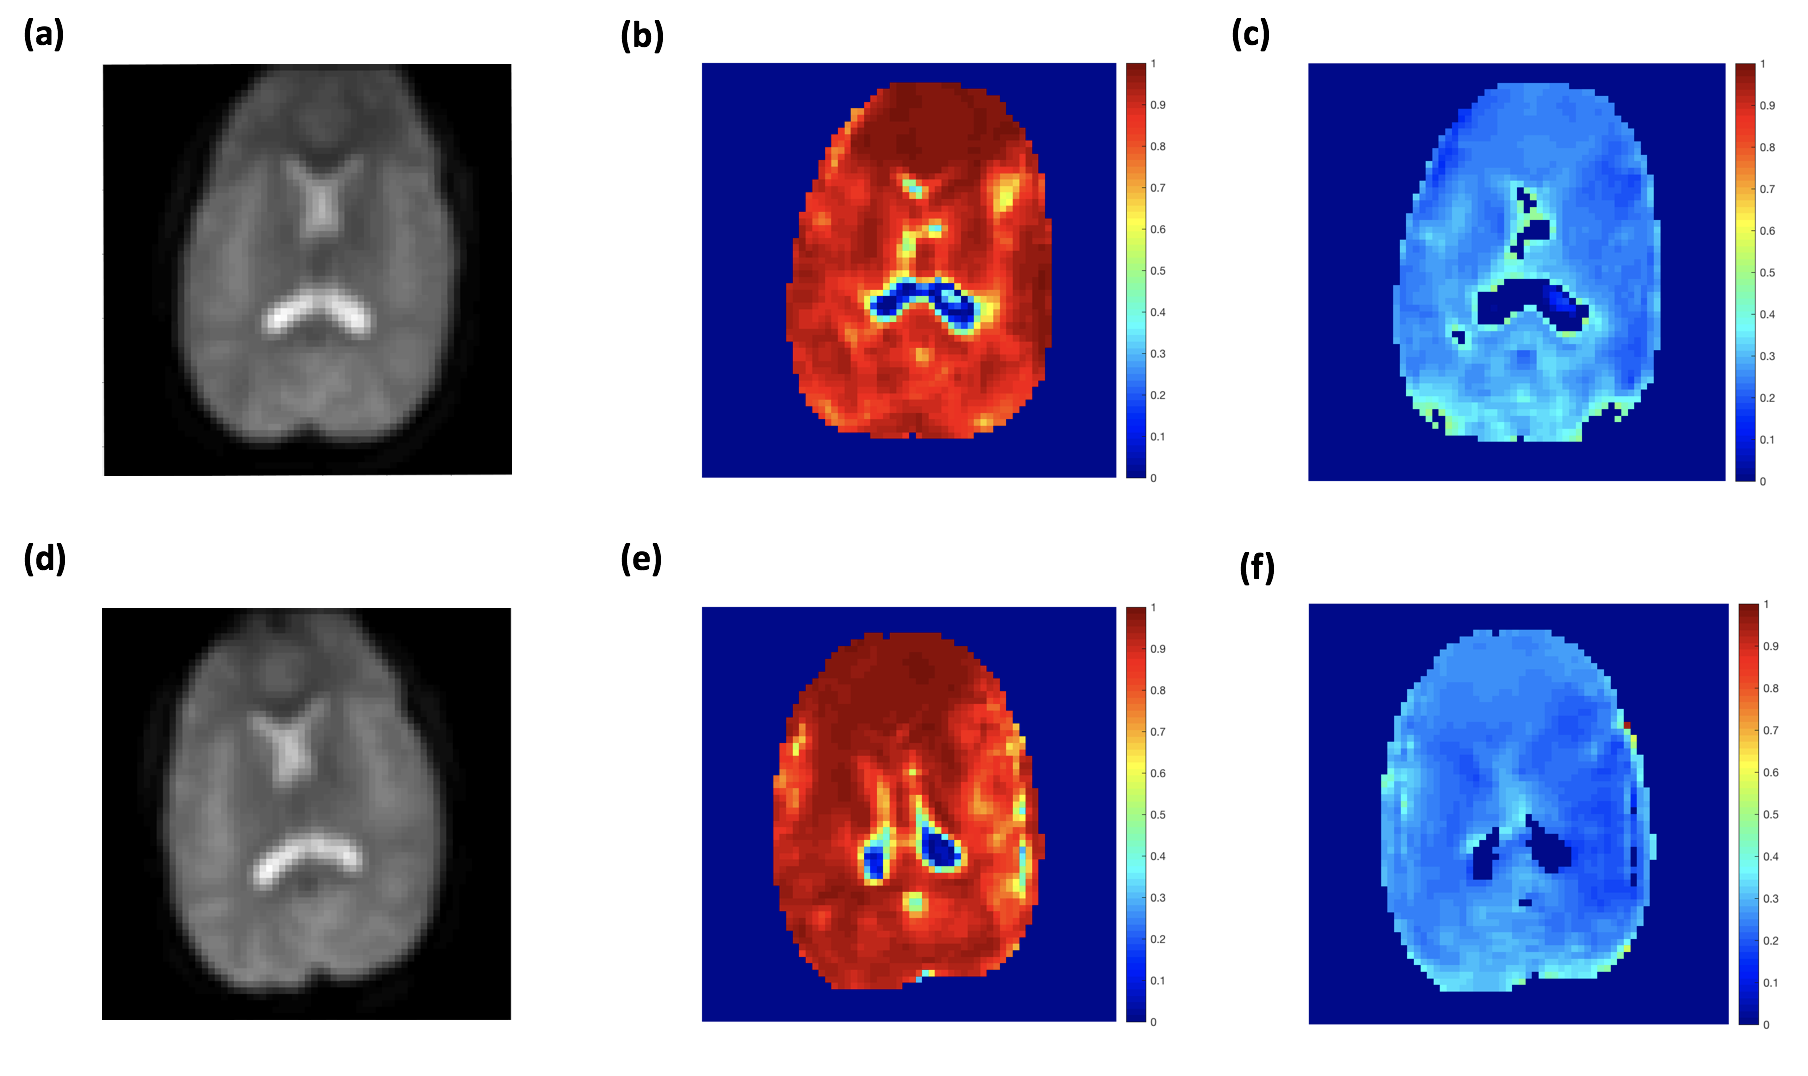
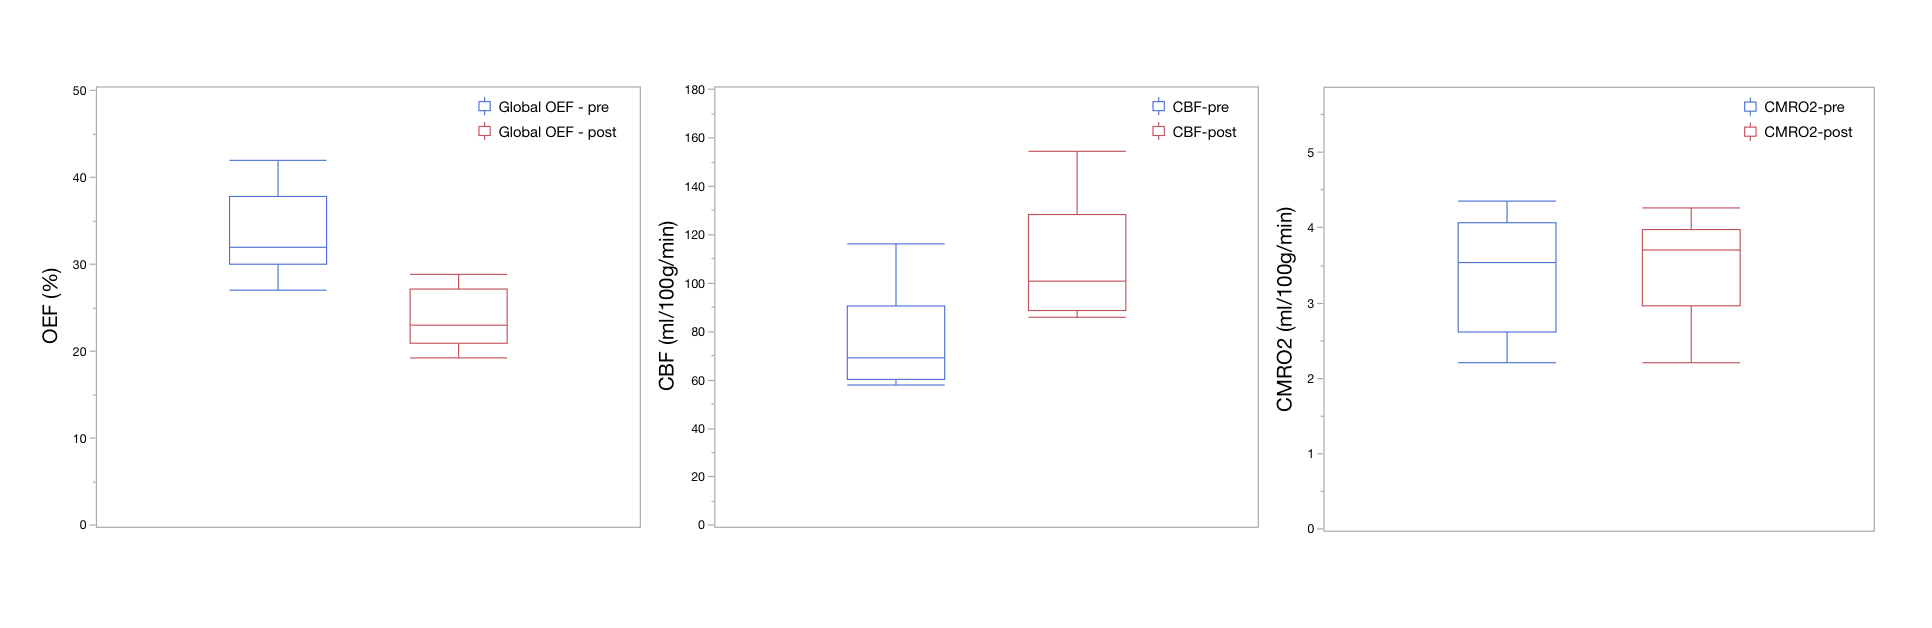
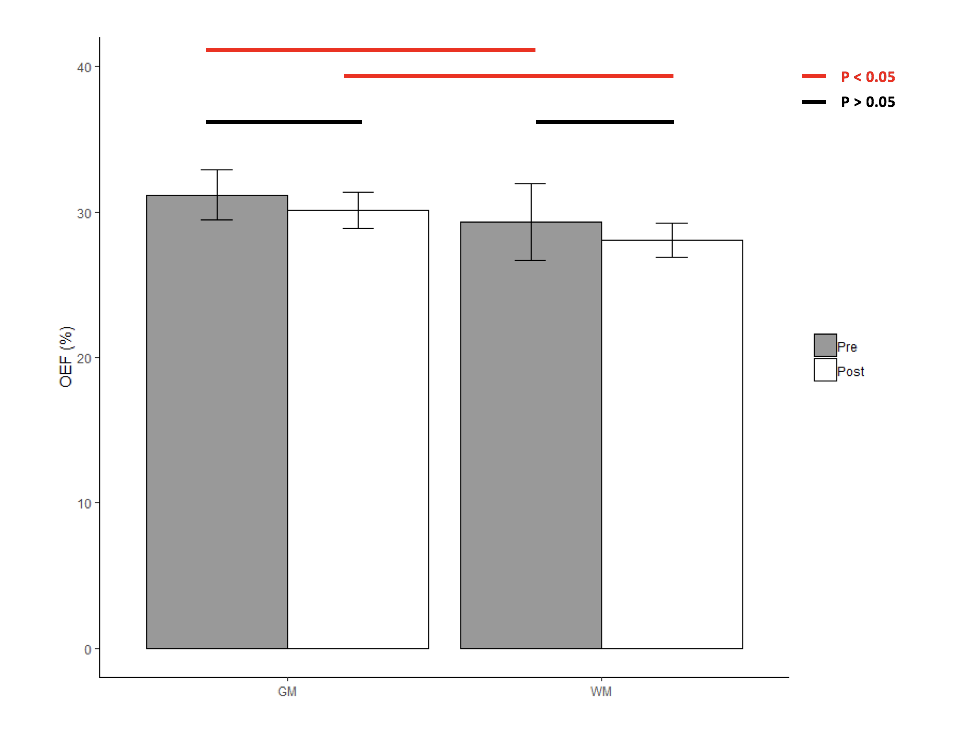
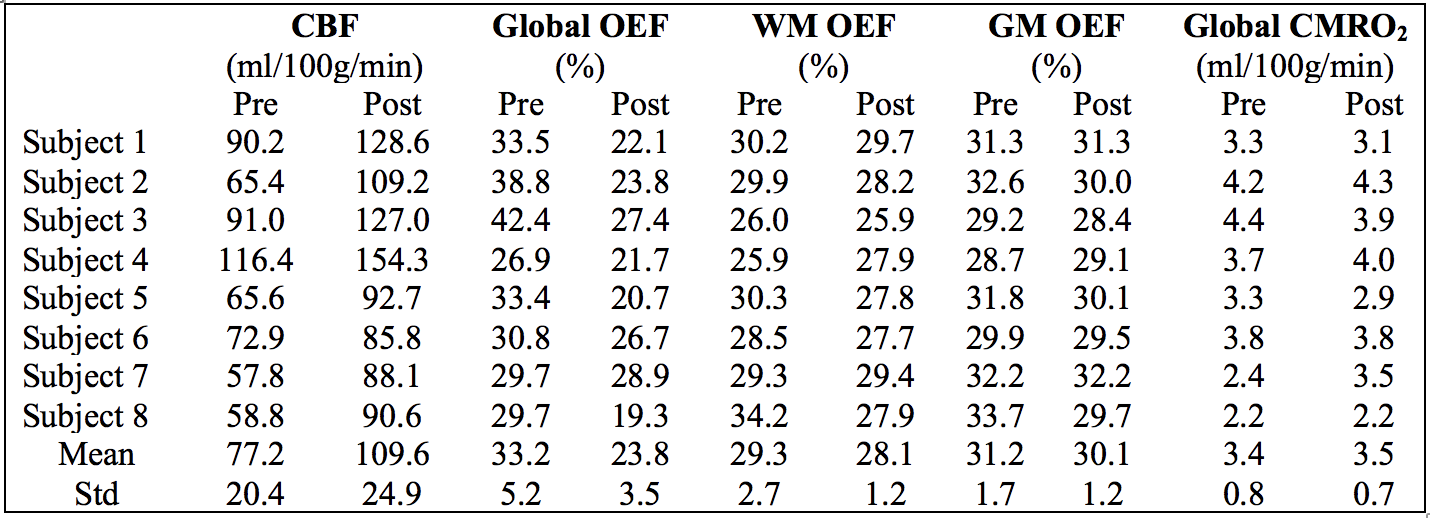
Typical anatomical SE images and signal decay curves are illustrated in Figure 1, and derived OEF maps are shown in Figure 2. Measurements of tissue OEF, global OEF, CBF and global CMRO2 are summarized in Table 1.Following acetazolamide, the CBF increased significantly from 77.2 to 109.6 ml/100g/min (p < 0.01), the global OEF (derived from TRUST) decreased from 33% to 24% (p < 0.01), while the global CMRO2 remained stable (Figure 3). Surprisingly, the tissue OEF value in white matter and gray matter was unchanged with acetazolamide (Figure 4).
Discussion
In this study, we replicated the expected effects of acetazolamide infusion, namely, reciprocal changes in CBF and OEF with stable CMRO2. If the increased oxygen delivery produced by acetazolamide were evenly distributed to perfusing capillaries, one would expect parallel changes in tissue and global OEF measurements. However, the absence of any detectable decline in tissue OEF, despite a 27% reduction in global OEF, indicates that increased blood flow is bypassing capillary networks (non-nutritive flow), supporting the existence of recruitable arteriovenous bypass channels. Our laboratory has postulated the existence of “physiologic shunting” in chronically anemic subjects8 for several years based upon the unexpectedly low OEF’s observed in both the systemic and cerebral circulations, but the present work provides compelling evidence for this physiology.Acknowledgements
This work is supported by the National Heart Lung and Blood Institute (1RO1HL136484-A1, 1U01HL117718-01), the National Institutes of Health (1R01-NS074980), the National Institute of Clinical Research Resources (UL1 TR001855-02) and by research support in kind from Philips Healthcare.References
1. Pauling, Linus, et al. "Sickle cell anemia, a molecular disease." Science 110.2865 (1949): 543-548.
2. Becklake, Margaret R., et al. "Oxygen dissociation curves in sickle cell anemia and in subjects with the sickle cell trait." The Journal of clinical investigation 34.5 (1955): 751-755.
3. An, Hongyu, and Weili Lin. "Impact of intravascular signal on quantitative measures of cerebral oxygen extraction and blood volume under normo‐and hypercapnic conditions using an asymmetric spin echo approach." Magnetic Resonance in Medicine: An Official Journal of the International Society for Magnetic Resonance in Medicine 50.4 (2003): 708-716.
4. Lu, Hanzhang, et al. "Calibration and validation of TRUST MRI for the estimation of cerebral blood oxygenation." Magnetic resonance in medicine 67.1 (2012): 42-49.
5. Xu, Feng, et al. "Effect of hypoxia and hyperoxia on cerebral blood flow, blood oxygenation, and oxidative metabolism." Journal of Cerebral Blood Flow & Metabolism 32.10 (2012): 1909-1918.
6. Yablonskiy, Dmitriy A., and E. Mark Haacke. "Theory of NMR signal behavior in magnetically inhomogeneous tissues: the static dephasing regime." Magnetic resonance in medicine 32.6 (1994): 749-763.
7. An, Hongyu, and Weili Lin. "Quantitative measurements of cerebral blood oxygen saturation using magnetic resonance imaging." Journal of Cerebral Blood Flow & Metabolism 20.8 (2000): 1225-1236.
8. Bush, Adam M., Thomas D. Coates, and John C. Wood. "Diminished cerebral oxygen extraction and metabolic rate in sickle cell disease using T2 relaxation under spin tagging MRI." Magnetic resonance in medicine 80.1 (2018): 294-303.
9. Zhang, Yongyue, Michael Brady, and Stephen Smith. "Segmentation of brain MR images through a hidden Markov random field model and the expectation-maximization algorithm." IEEE transactions on medical imaging 20.1 (2001): 45-57.
Figures