1817
Evaluating normative radiomics in T2-FLAIR MRI of the brain1Symbiosis Centre For Medical Image Analysis, Symbiosis International University, Pune, India, 2Department of Radiology, National Institute of Mental Health and Neurosciences, Bengaluru, India, 3Department of Radiology, Fortis Hospital, Gurgaon, India
Synopsis
Radiomics has gained momentum as a non-invasive prediction tool to assess MRI based tumor data in neuro-oncology. However, there’s little understating about the robustness and reproducibility of these features in normative population which is an important first step before translating to pathology. This work investigates and demonstrates the reproducibility of radiomic features on T2-FLAIR images and variation within hemispheres and lobes and its gender and age-related effect. Overall, our findings suggest that care must be taken while interpreting these features for pathological inference.
Introduction
Radiomics is an emerging translational field where an array of attributes that include geometry, intensity and textures are computed from radiographic images and used in a multi-variate predictive framework for the purposes of prognosis, disease tracking and evaluation of response to treatment1. Radiomics in neuro-oncology is gaining momentum for non-invasive prediction of the type of neoplasm, tumor grading as well as genomic and transcriptomic subtyping2,3. However, there is no understanding about the robustness and reproducibility of these radiomic features in normative population which is an important first step before translating to pathology. This work employs T2-FLAIR scans that are most commonly used for tumor analysis and investigates the radiomics on a healthy population to (1) understand the variation in radiomic features across hemispheres, lobes as well as with age and gender in a large control population and (2) to compute reproducibility and variability using test-retest scans.Method
This study consisted of two sets of data of healthy subjects: (1) 87 subjects [mean age = 36.43 ± 12.54, 46 M/41 F, age range: 12-64 years] (2) test-retest: 4 subjects scanned at 3 different time points. Imaging was carried out on a Philips 3T Ingenia scanner with a 15/32 channel head-coil. FLAIR images were acquired using (dataset 1) TR/TE = 4700/278 ms, FOV = 288 x 288 mm, voxel size of 0.56 x 0.8582 x 0.8582 mm3 (dataset 2) TR/TE =4700/284 ms FOV =400 x 400 mm and voxel size of 0.62 x 0.6182 x 0.6182 mm3. Images were checked for motion or other artifacts and brain was extracted using BET tool4 and tissue classification was performed to obtain the gray matter (GM) and white matter (WM) masks. Subjects were registered to the MNI space5 using ANTs tool6 and the lobes of the brain as defined on the ICBM 152 Nonlinear Symmetric atlas7 were mapped back to the subject space using inverse transformation. For each region (separate for GM and WM), radiomics based feature extraction was performed using PyRadiomics 2.2.0 library and included intensity features, statistical features, Gray-Level Co-occurrence Matrix (GLCM), Gray-Level dependence matrix (GLDM), Gray Level Run Length Matrix (GLRLM), Gray Level Size Zone Matrix (GLSZM) and Neighboring Gray Tone Difference Matrix (NGTDM).8 A total number of 93 features were extracted per region. For the second dataset, a similar pipeline was followed with the addition of computing shape features making a total of 107 features per region. On dataset 1 (87 subjects), statistical analysis was carried out to test for gender and age changes using a MANCOVA model where gender was used as group factor and age as a covariate. Further, to test if radiomic features could predict the age, support vector regression (SVR) was used on the lobar features that were trained and cross-validated/tested using a 75/25% split. A two-tailed heteroscedastic t-test was performed to check for laterality differences in radiomic features in WM and GM separately. Correction for multiple comparisons was performed using Bonferroni–Holm (BH) method.9 Furthermore, lobar differences for all 93 features were tested for between lobes (separately for WM and GM) using heteroscedastic two-tailed t-test and their p-values were corrected for multiple comparisons using BH test. Finally to evaluate the reproducibility of the radiomics features, the second dataset was used and intra-class correlation (ICC) was computed for R- and L, GM and WM separately. ICC is the measure of the total variance accounted for by between subject variation.10Results
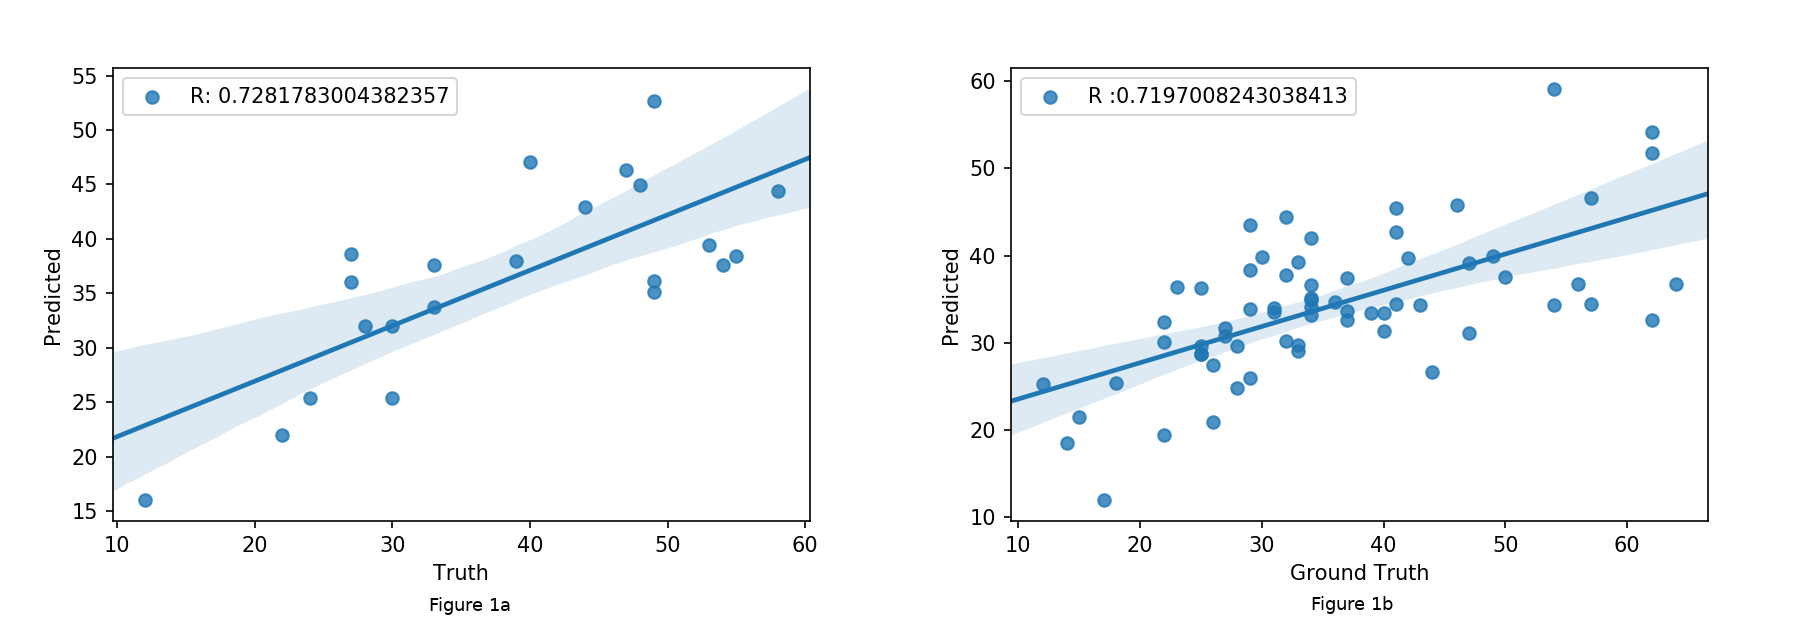
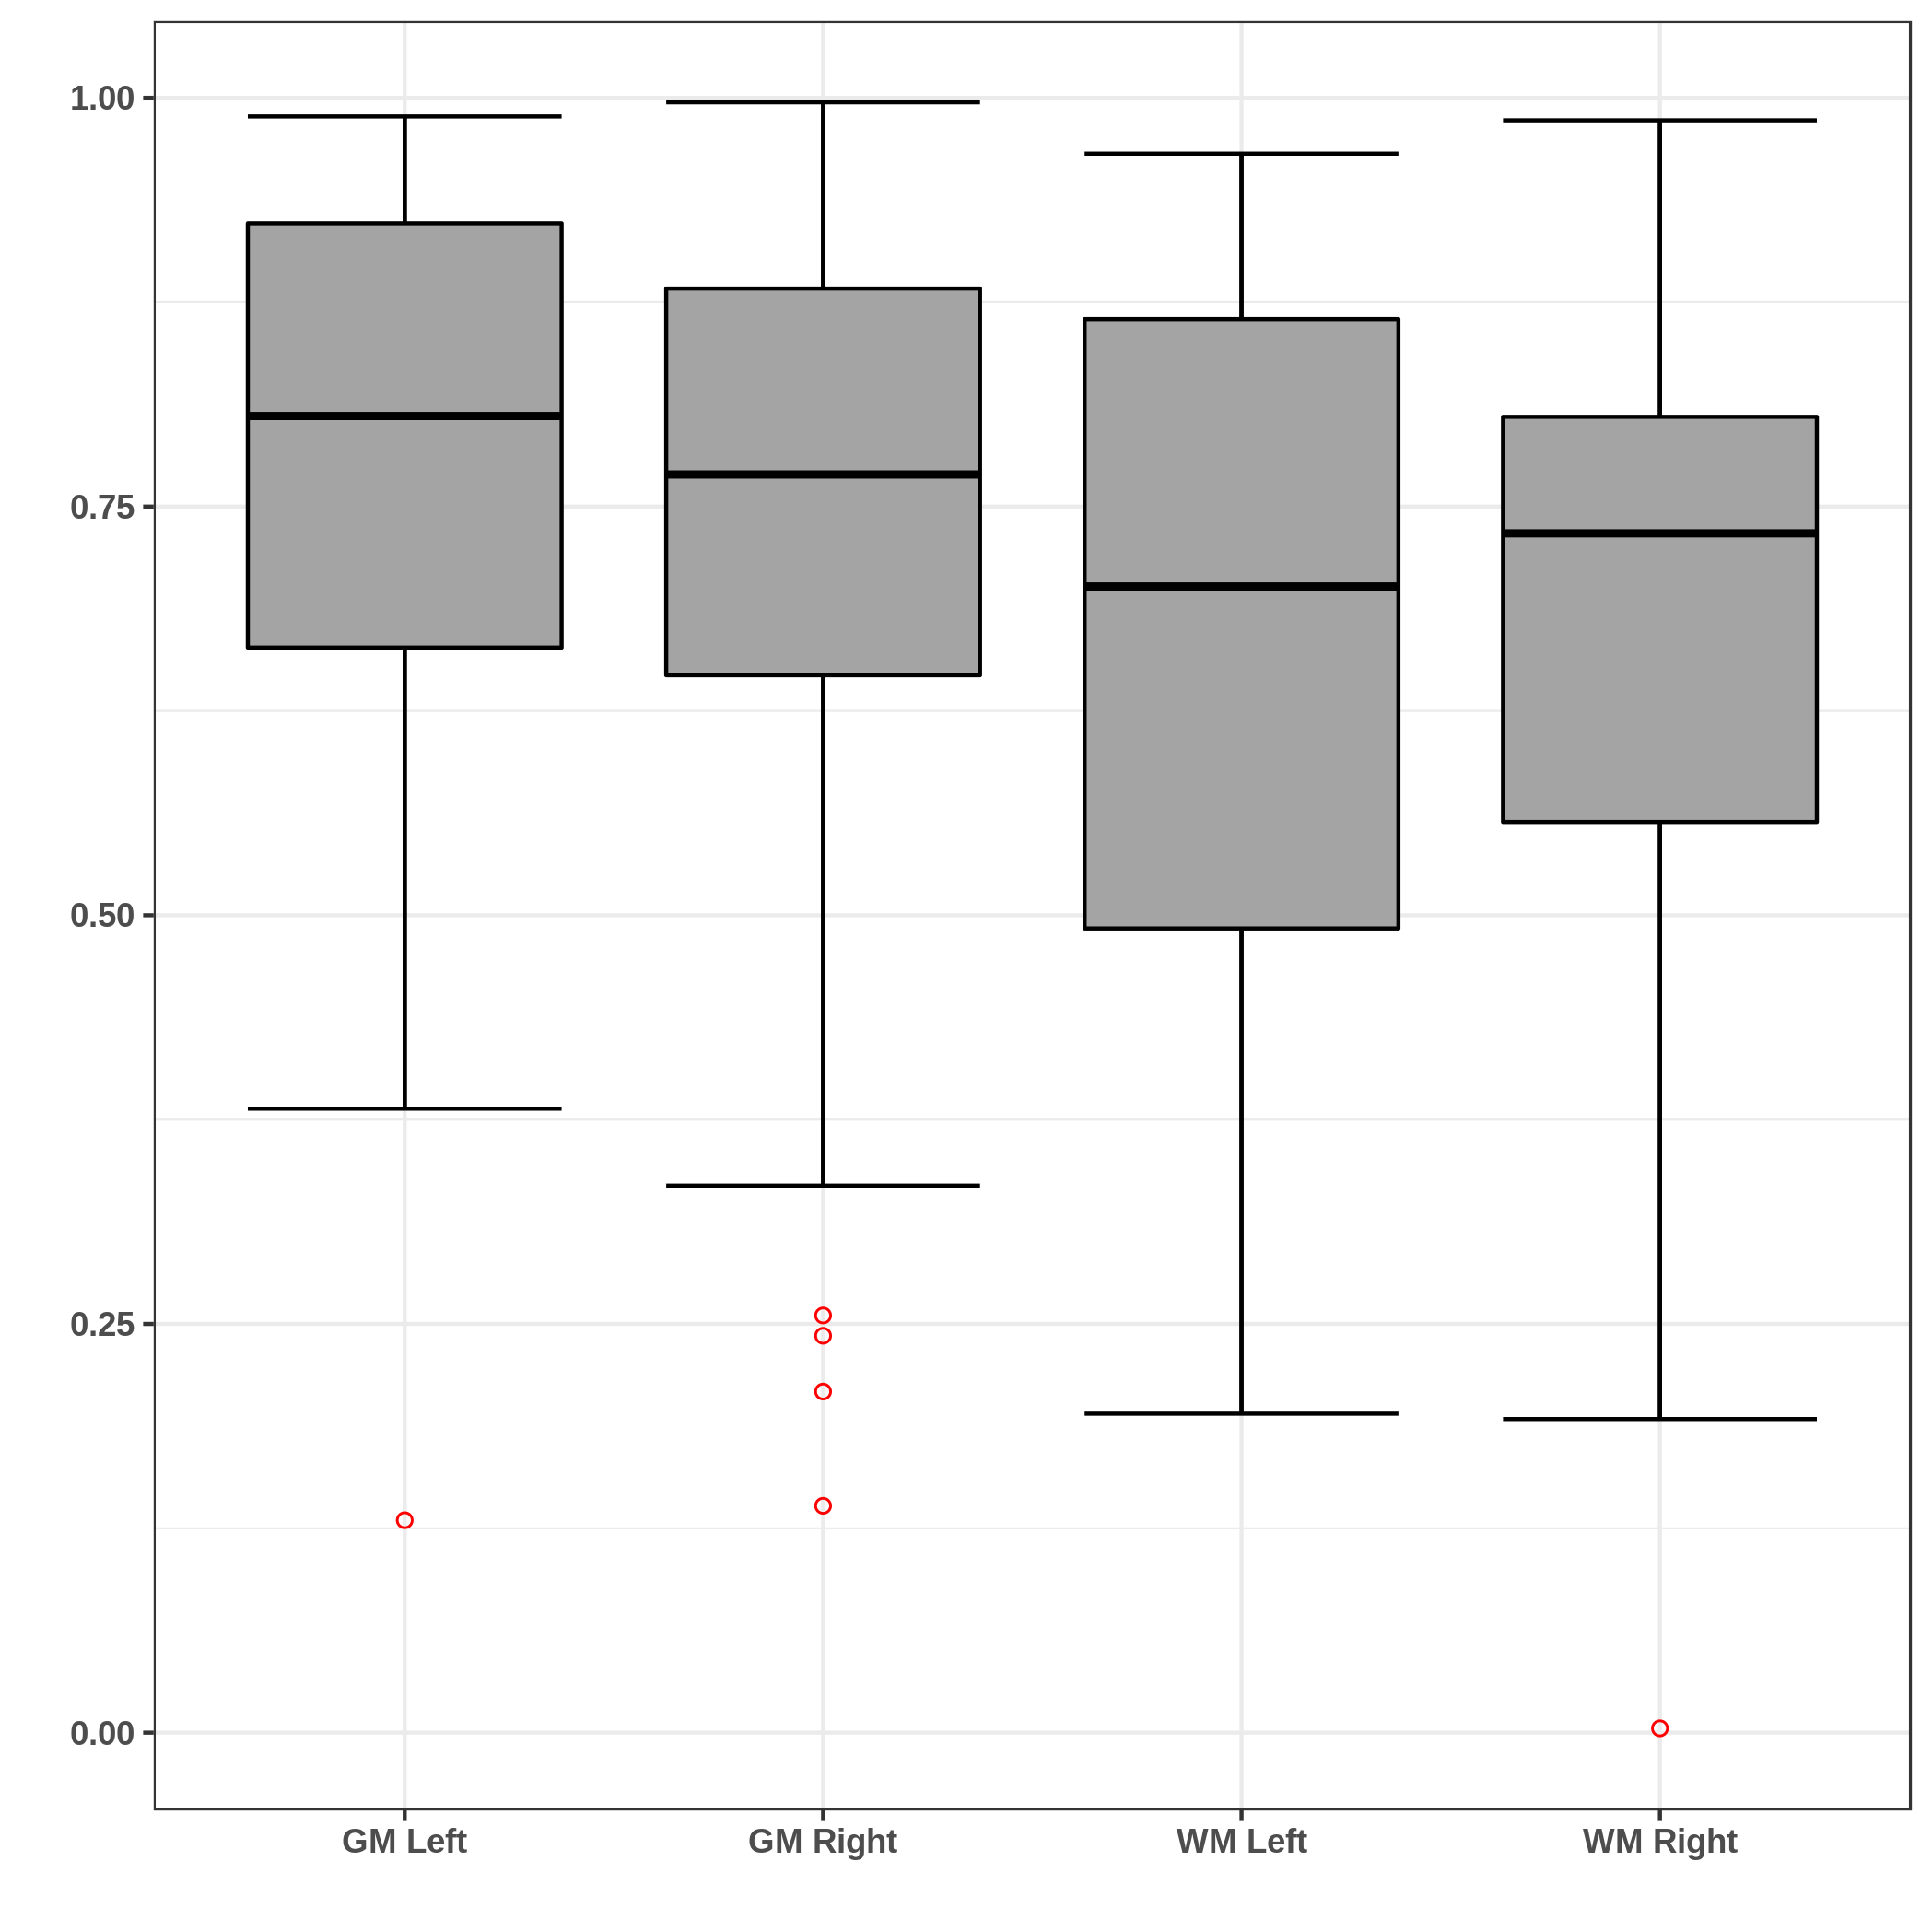
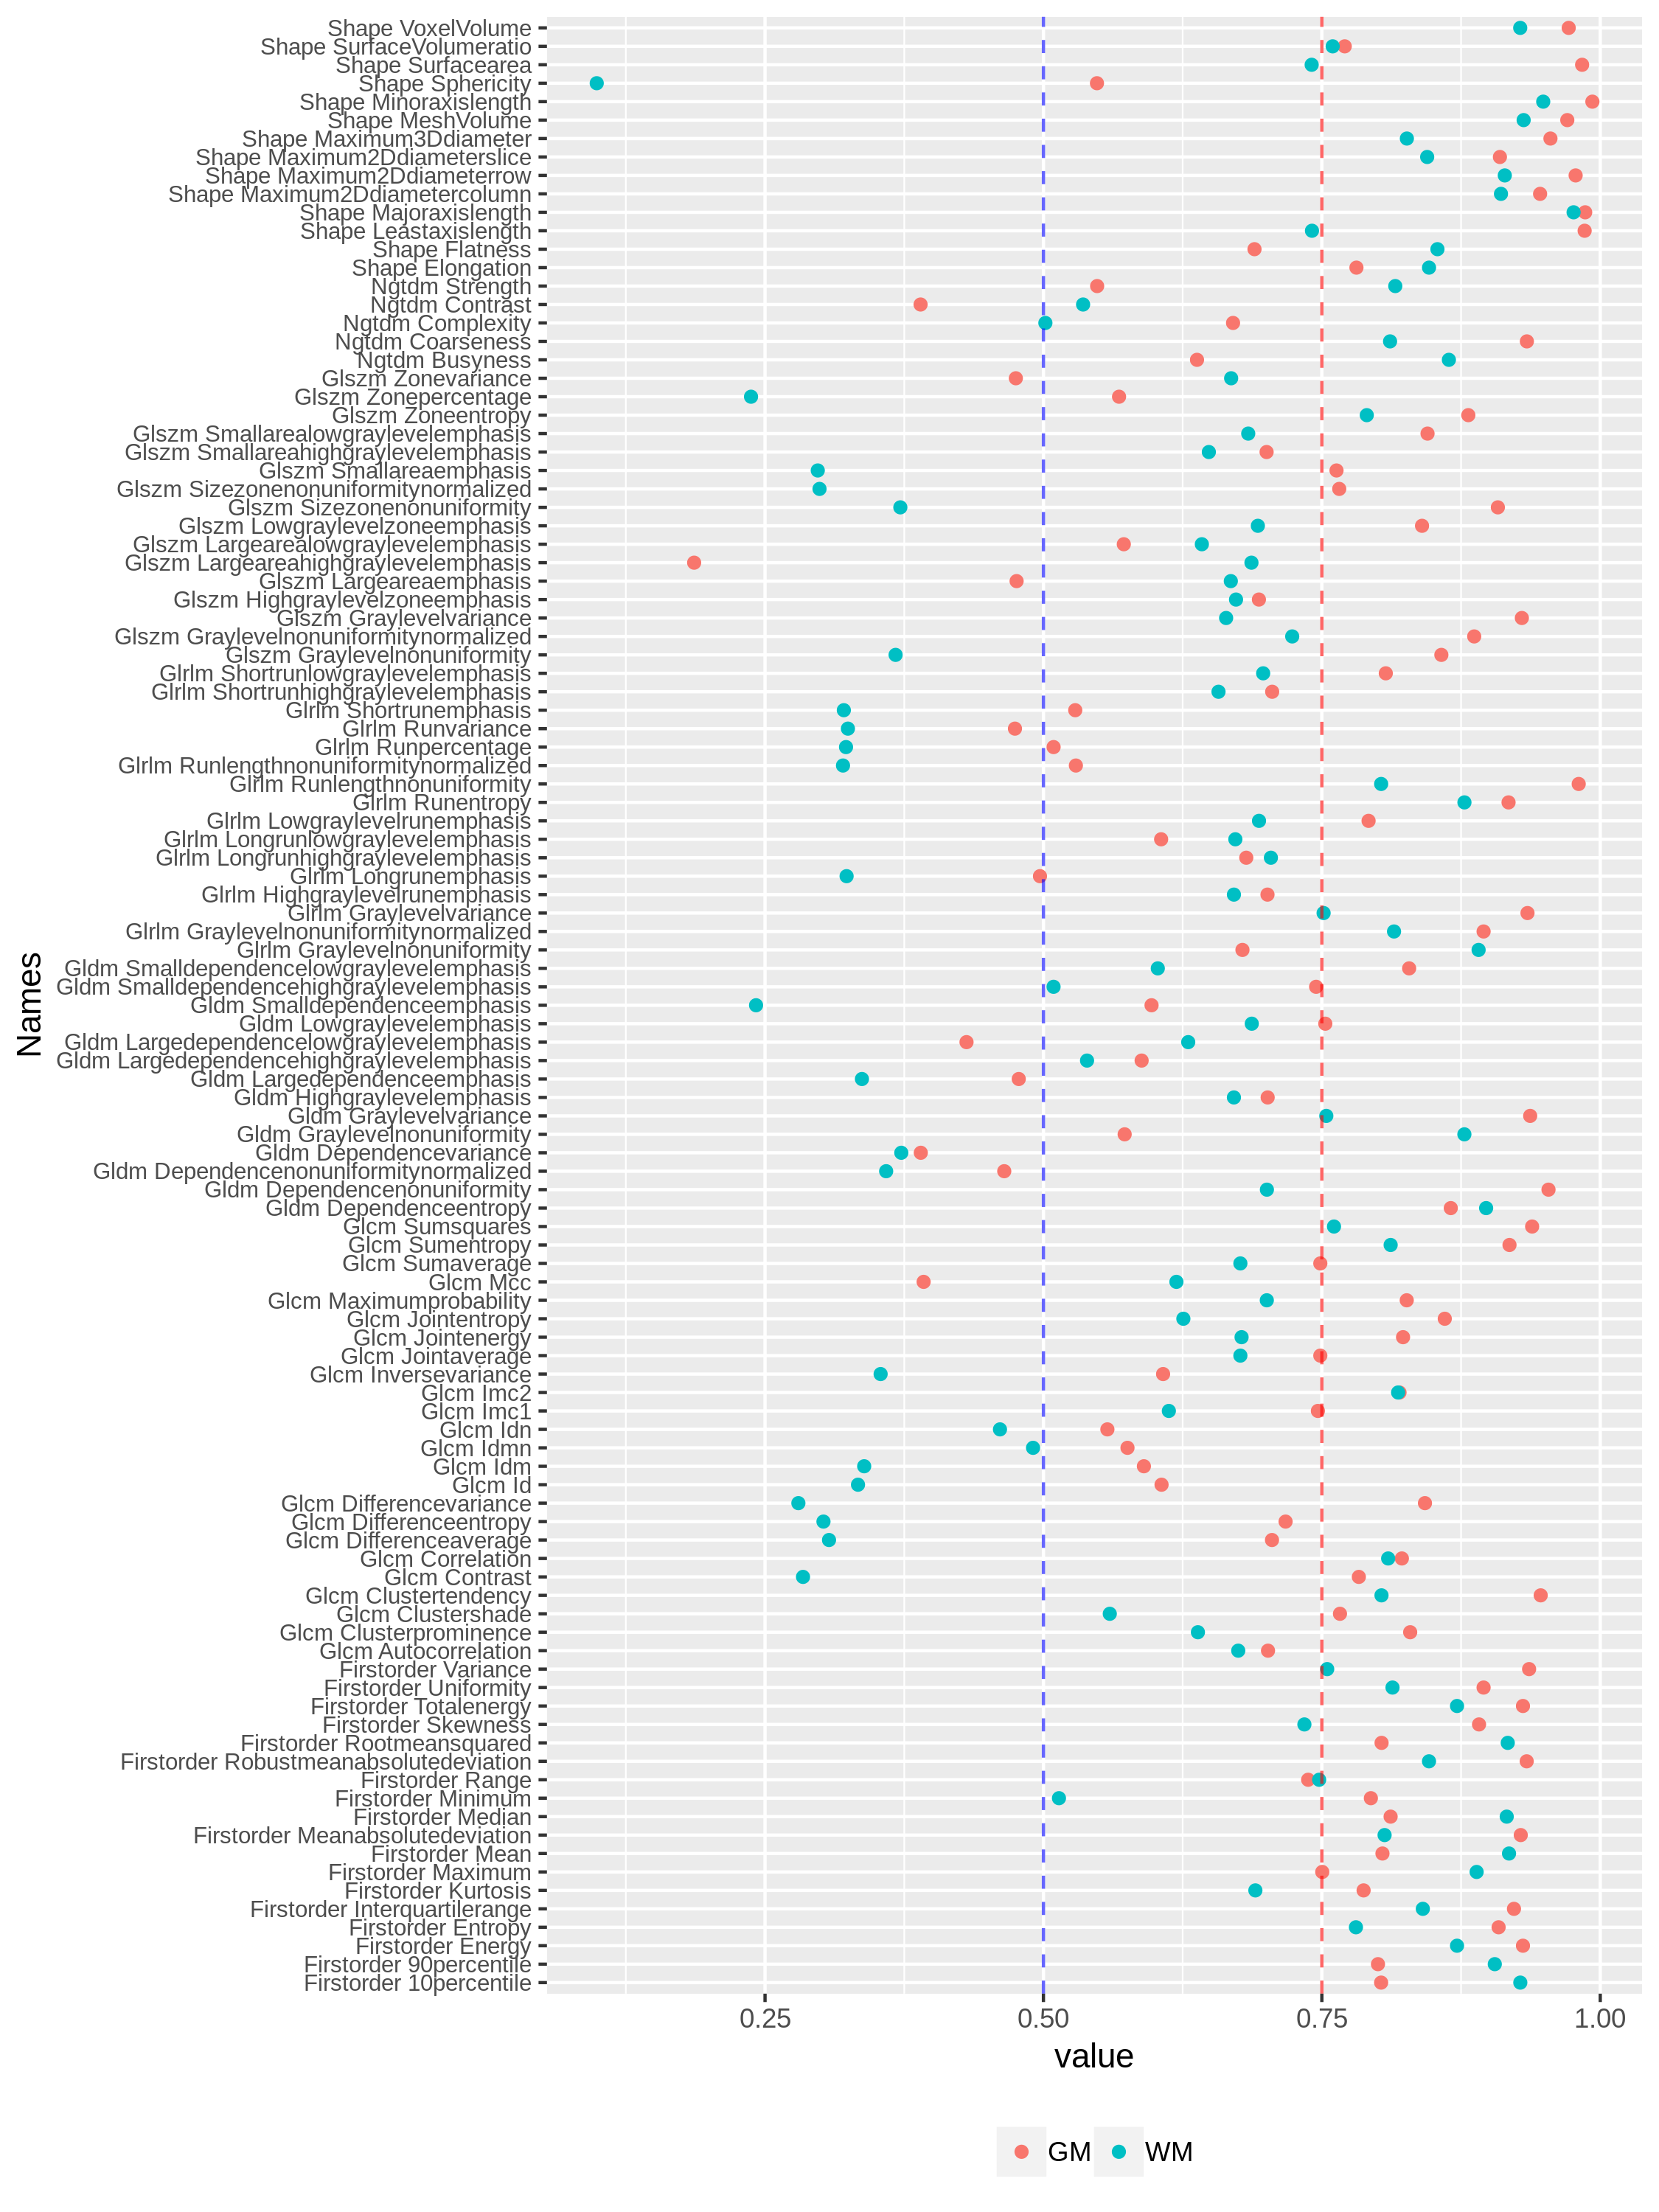
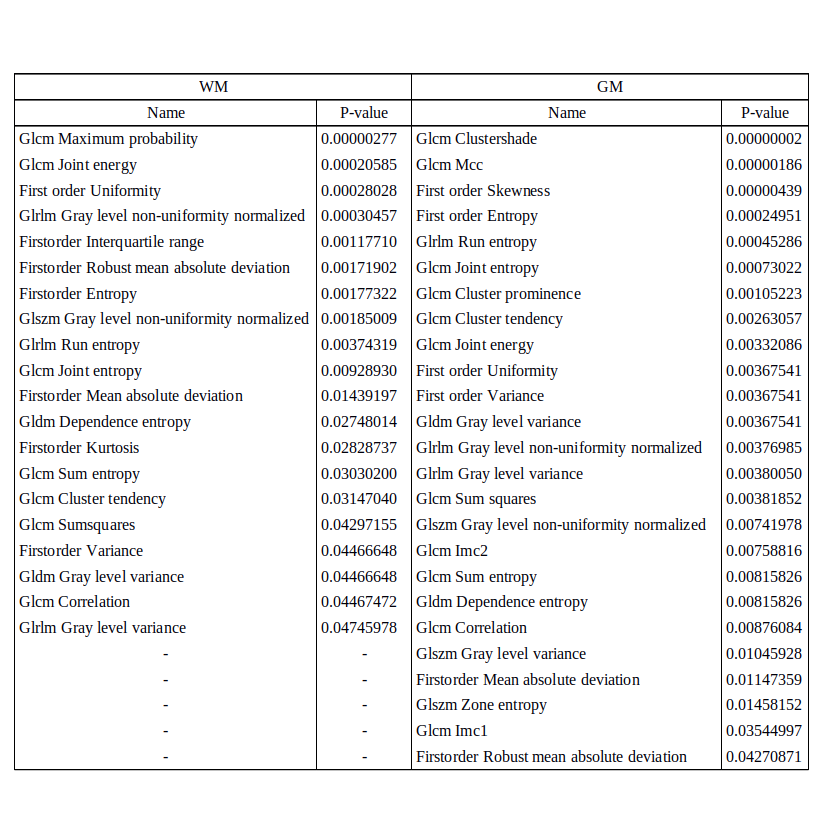
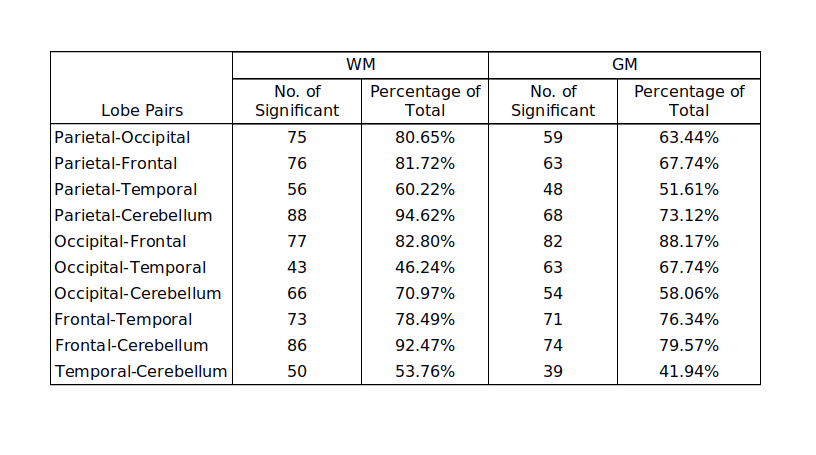
No significant differences for radiomics were observed between genders. For age, the SVR could predict the age with R-value (correlation between ground truth and predicted) of 0.72 for test cases and 0.719 for cross validation (as shown in Figure 1). Significant laterality differences were observed for 25 features of GM and 20 of WM as listed in table 1. Between lobes, significant differences were observed with an average of 70.48% features. Table 2 illustrates the percent features that were different between lobes. These features mainly included textural features rather than intensity or statistical features. For the test-retest data, the ICC scores of all the 107 features computed: GM Left: 0.7785 ± 0.17, GM Right: 0.7314 ± 0.2, WM Left: 0.6697 ± 0.2 and WM Right 0.6452 ± 0.23 respectively- as shown in Figure 2. ICC values that were >0.5 indicated more variability between subjects than between scans. Figure 3 illustrates the ICC values for each radiomic features for GM and WM where 83 (WM) and 96 (GM) features were reproducible (ICC>0.5).Discussion
FLAIR radiomics demonstrated an overall high intra-subject reproducibility and inter-subject sensitivity as demonstrated from the test-retest ICC results. Moreover, radiomics did not change with gender, however significantly altered with age where we could predict the age using a multi-variate regression model. Finally, many features especially textural features did not demonstrate consistency across hemispheres as well as across lobes. Taking into account these findings, care must be taken in the interpretation of such non-robust features in pathological inference. Test- retest on multiple scanners is also required to gain deeper understanding of the reproducibility and robustness of radiomics.Acknowledgements
No acknowledgement found.References
1. Gillies, R. J., Kinahan, P. E., & Hricak, H. (2015). Radiomics: images are more than pictures, they are data. Radiology, 278(2), 563-577.
2. Rathore, S., Akbari, H., Rozycki, M., Abdullah, K. G., Nasrallah, M. P., Binder, Z. A., ... & O’Rourke, D. M. (2018). Radiomic MRI signature reveals three distinct subtypes of glioblastoma with different clinical and molecular characteristics, offering prognostic value beyond IDH1. Scientific reports, 8(1), 5087.
3. Rathore, S., Akbari, H., Doshi, J., Shukla, G., Rozycki, M., Bilello, M., ... & Davatzikos, C. A. (2018). Radiomic signature of infiltration in peritumoral edema predicts subsequent recurrence in glioblastoma: implications for personalized radiotherapy planning. Journal of Medical Imaging, 5(2), 021219.
4. Smith, S. M. (2002). Fast robust automated brain extraction. Human brain mapping, 17(3), 143-155.
5. Winkler AM, Kochunov P, Glahn DC. FLAIR Templates. Available at http://brainder.org
6. Avants, B. B., Epstein, C. L., Grossman, M., & Gee, J. C. (2008). Symmetric diffeomorphic image registration with cross-correlation: evaluating automated labeling of elderly and neurodegenerative brain. Medical image analysis, 12(1), 26-41.
7. Collins, D. L., Zijdenbos, A. P., Baaré, W. F., & Evans, A. C. (1999, June). ANIMAL+ INSECT: improved cortical structure segmentation. In Biennial International Conference on Information Processing in Medical Imaging (pp. 210-223). Springer, Berlin, Heidelberg.
8. Van Griethuysen, J. J., Fedorov, A., Parmar, C., Hosny, A., Aucoin, N., Narayan, V., ... & Aerts, H. J. (2017). Computational radiomics system to decode the radiographic phenotype. Cancer research, 77(21), e104-e107.
9. Holm, S. (1979). A simple sequentially rejective multiple test procedure. Scandinavian journal of statistics, 65-70.
10. Lachin, J. M. (2004). The role of measurement reliability in clinical trials. Clinical trials, 1(6), 553-566.
Figures