1812
Probabilistic structural atlas of human ventral tegmental area, mesencephalic and isthmic reticular formation using in-vivo 7 Tesla MRI1Brainstem Imaging Laboratory, Department of Radiology, Athinoula A. Martinos Center for Biomedical Imaging, Massachusetts General Hospital and Harvard Medical School, Boston, MA, United States
Synopsis
Human ventral tegmental area and its parabrachial pigmented nucleus are involved in attention, memory, reward, drug abuse, and motivation. Mesencephalic and isthmic reticular formation nuclei are implicated in the control of head/eye movement and position. Currently, their assessment in radiological investigations is difficult due to the limited-resolution and contrast of clinical MRI. We precisely delineated these nuclei on 7 Tesla MRI of healthy humans and generated a validated in-vivo stereotaxic probabilistic atlas of these structures. Upon coregistration to clinical MRI, this atlas might improve the evaluation of lesions and assessment of connectivity pathways underlying clinical conditions relating to these nuclei.
Introduction
Dopamine neurons in the ventral tegmental area (VTA) project to the forebrain and are involved in attention, memory, reward, drug abuse and motivation1. Parabrachial pigmented nucleus of the VTA (PBP) mediates ‘unconditioned reward’ and function of limbic system along with closely related functions of VTA such as reward, motivation, learning, memory and movement. Human mesencephalic (mRt) and isthmic (isRt) reticular formation brainstem nuclei are implicated in the control of head/eye movement and position1 (e.g. gaze). VTA dysfunction can be seen as depression and addiction2. PBP has been involved in Parkinson’s disease alongside substantia nigra3. Lesions in mRt lead to specific eye deficits, hyper- or hypometria of saccades, disruption of gaze fixation and changes in forebrain wakefulness (due to damage to fibers of passage)1. However, due to the limited image resolution/contrast of clinical (1.5 Tesla, 3 Tesla) MRI scanners and the lack of a stereotaxic probabilistic atlas of these nuclei in living humans, the assessment of structural and functional alterations of these nuclei is difficult in routine research and clinical investigations.Purpose
To create in living humans a stereotaxic probabilistic structural atlas of the ventral tegmental area with parabrachial pigmented nucleus of the VTA (VTA-PBP complex), mesencephalic reticular formation (mRt), mesencephalic reticular formation-anterior part (mRTa), and isthmic reticular formation (isRt) by using a high-resolution (1.1 mm isotropic) multi-contrast (diffusion fractional anisotropy —FA— and T2-weighted—T2w) EPI approach at 7 Tesla, which provided complementary contrasts for brainstem anatomy with precisely matched geometric distortions and resolution.Methods
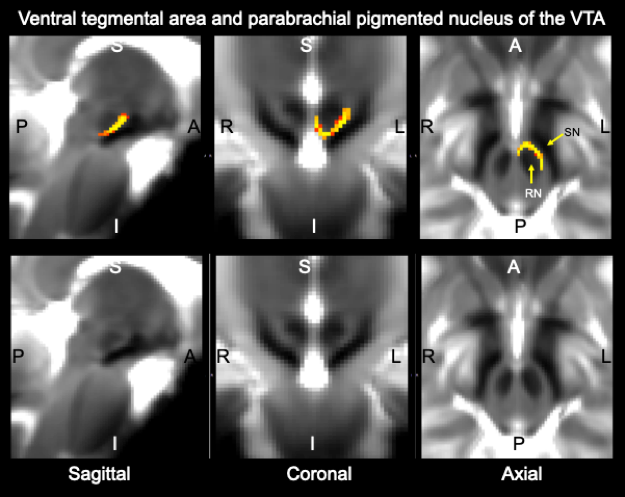
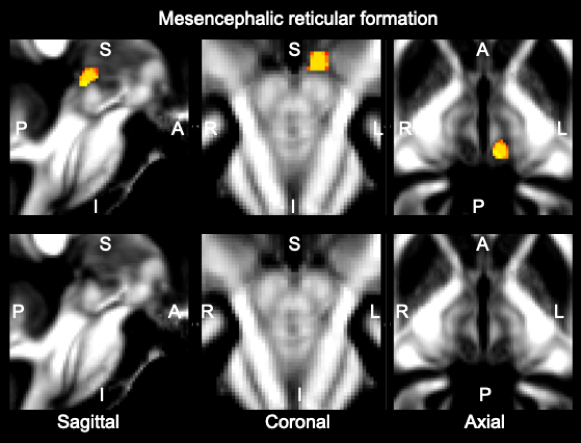
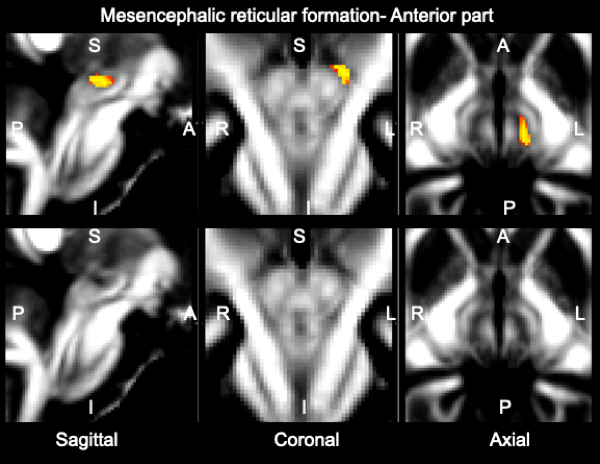
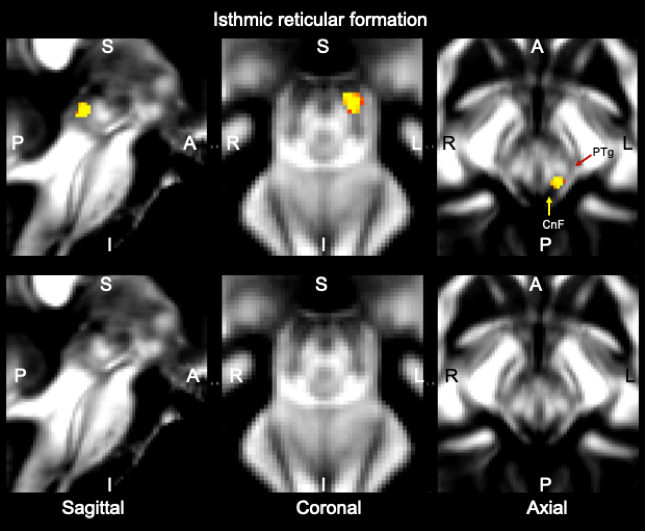
Data acquisition: Twelve subjects (6m/6f, age 28±1) underwent 7 Tesla MRI under IRB approval. We adopted a common single-shot 2D-EPI readout for 1.1 mm isotropic diffusion-tensor imaging (DTI, using a prototype sequence which supports unipolar diffusion encoding), and T2w sagittal images, with matrix size/GRAPPA factor/nominal echo-spacing = 180 × 240/3/0.82 ms. This yielded multi-contrast anatomical images with exactly matched resolution and geometric distortions4. Additional MRI parameters were: spin-echo EPI,61 slices, TE/TR = 60.8 ms/5.6 s, partial Fourier: 6/8, unipolar diffusion-weighting gradients for DTI, 60 diffusion directions (b-value ~ 1000 s/mm2), 7 interspersed “b0” images (non-diffusion weighted, b-value ~ 0 s/mm2), 4 repetitions, acquisition time/repetition 6’43”.Data analysis: DTIs were rotated to standard orientation, motion and distortion-corrected (FSL). We then computed the diffusion tensor invariants (such as fractional anisotropy, FA) and S0 image (which we used as T2w MRI) from the preprocessed DTI (FSL, dtifit). Single-subject FA were coregistered to IIT MNI space through high dimensional non-linear transformations (ANTs)5. On a single-subject basis, two independent researchers (K.S., M.B.) performed manual segmentation of multi-contrast (FA maps and T2w MRI) images as follows: VTA-PBP appeared as a hyperintense region on T2w MRI between hypointense red nucleus and substantia nigra. The mRt was identified as a hypointense triangular/quadrangular gray area on the FA map extending from the level of caudal border of inferior colliculus to the level of oral border of superior colliculus6. mRt was also seen ventral to VTA-PBP and medial lemniscus laterally. mRta was seen as FA hypointense region lateral to VTA-PBP and anterior to mRt. The isRT was visible as sandwiched hypointense area between pedunculotegmental nucleus (laterally) and cuneiform (medially)7. This segmentation yielded single-subject labels of VTA-PBP, mRt, mRta, and isRt. Only voxels rated by both raters as belonging to a nucleus were included in the final label. A probabilistic atlas for these nuclei in MNI space was created by computing the overlap of nuclei labels across subjects (highest probability = 100 % overlap across subjects).
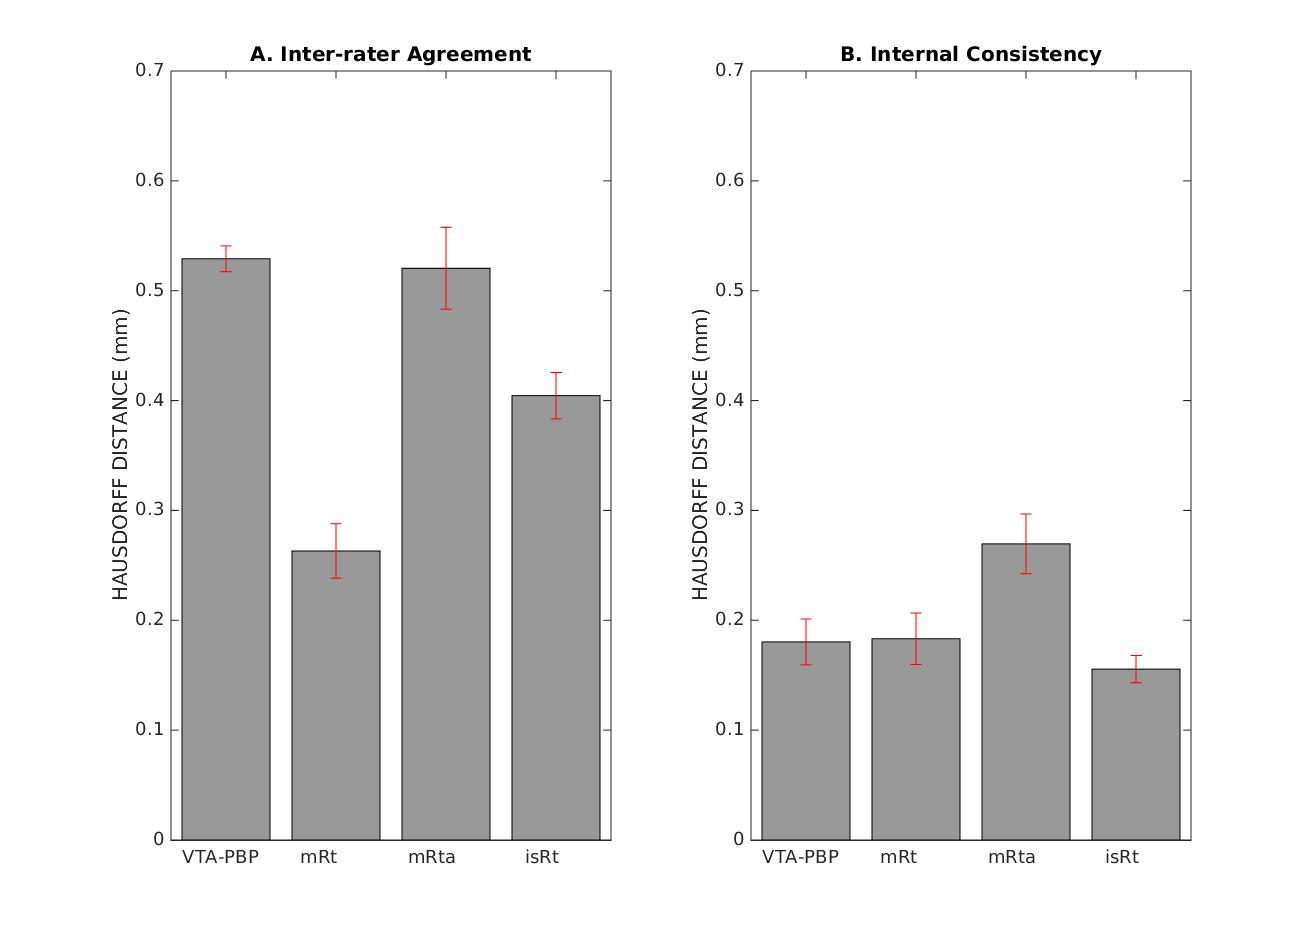
Atlas validation: The probabilistic nuclei atlas was validated by computing for each nucleus and subject: (i) the inter-rater agreement, as the modified Hausdorff distance8 between labels delineated by the two raters; (ii) the internal consistency across subjects of the final label, as the modified Hausdorff distance between each final label and the probabilistic atlas label (thresholded at 35%) generated by averaging the labels across the other 11 subjects (leave-one-out cross validation). For each nucleus, the modified Hausdorff distance of (i) and (ii) was then averaged across subjects and displayed.
Results
The probabilistic neuroimaging structural labels in MNI space of VTA-PBP, mRt, mRta and isRT are shown in Figures 1-4. For each nucleus, the average modified Hausdorff distance assessing the inter-rater agreement and the internal consistency (Figure 5) of nuclei atlas labels was below (p < 0.05, unpaired t-test) the linear spatial imaging resolution (1.1 mm), thus validating the generated probabilistic nuclei atlas.Discussion and Conclusions
Our findings demonstrated the feasibility of delineating on a single-subject basis tiny brainstem nuclei (VTA-PBP, mRt, mRta, and isRt) in high-contrast and high-sensitivity MRI at 7 Tesla. Crucially, our work also demonstrated the feasibility of generating a validated in vivo stereotaxic probabilistic atlas of these structures after precise image coregistration to MNI space. This atlas complements existing in vivo neuroimaging atlases of other brain structures9-12. We foresee the use of the generated probabilistic atlas of VTA-PBP, mRt, mRta, and isRt to aid the localization of these nuclei in conventional (e.g. 3 Tesla) images in future research studies of head/eye coordination, reward, memory and wakefulness.Acknowledgements
NIH-NIDCD R21DC015888; NIH-NIBIB K01EB019474; Dr. Thorsten Feiweier for providing the diffusion sequence used in this study.References
1. Olszewski J, Baxter D, Karger S. (Ed.), 1954. Cytoarchitecture of the Human Brainstem, JB Lippincott Company, Philadelphia and Montreal North America; 1954.
2. Polter AM, Kauer JA. Stress and VTA synapses: implications for addiction and depression. Eur J Neurosci. 2014;39(7):1179-88
3. Vogt Weisenhorn DM, Giesert F, Wurst W. Diversity matters - heterogeneity of dopaminergic neurons in the ventral mesencephalon and its relation to Parkinson's Disease. J Neurochem. 2016;139 Suppl 1:8-26.
4. Bianciardi M, Toschi N, Eichner C, et al. In vivo functional connectome of human brainstem nuclei of the ascending arousal, autonomic, and motor systems by high spatial resolution 7-Tesla fMRI. MAGMA. 2016;29(3):451-62.
5. Avants BB, Tustison NJ, Song G, et al. A reproducible evaluation of ANTs similarity metric performance in brain image registration. Neuroimage. 2011;54:2033- 2044.
6. García-Gomar MG, Strong C, Toschi N et al. In vivo Probabilistic Structural Atlas of the Inferior and Superior Colliculi, Medial and Lateral Geniculate Nuclei and Superior Olivary Complex in Humans Based on 7 Tesla MRI. Front Neurosci. 2019; 7(13):764.
7. Bianciardi M, Strong C, Toschi N et al. A probabilistic template of human mesopontine tegmental nuclei from in vivo 7T MRI. Neuroimage. 2018; 15(170):222-230.
8. Dubuisson, M.P., Jain, A.K., 1994. A modified Hausdorff distance for object matching. Proc. 12th International Conference on Pattern recognition, Jerusalem, Israel, 1, 566-568.
9. Destrieux C, Fischl B, Dale A, et al. Automatic parcellation of human cortical gyri and sulci using standard anatomical nomenclature. Neuroimage. 2010;53:1-15.
10. Desikan RS, Segonne F, Fischl B, et al. An automated labeling system for subdividing the human cerebral cortex on MRI scans into gyral based regions of interest. Neuroimage. 2006;31:968-980.
11. Tzourio-Mazoyer N, Landeau B, Papathanassiou D, et al. Automated anatomical labeling of activations in SPM using a macroscopic anatomical parcellation of the MNI MRI single-subject brain. Neuroimage. 2002;15:273-289.
12. Bianciardi M, Toschi N, Edlow BE, et al. Toward an in vivo neuroimaging template of human brainstem nuclei of the ascending arousal, autonomic, and motorsystems. Brain Connect. 2015;5(10):597-607.
Figures