1810
Improved Cerebral Microbleed vs Calcification Discrimination using QSM compared to SWI Phase Maps1Beth Israel Deaconess Medical Center / Harvard Medical School, Boston, MA, United States, 2Radiology, Beth Israel Deaconess Medical Center / Harvard Medical School, Boston, MA, United States, 3Neurology, Beth Israel Deaconess Medical Center / Harvard Medical School, Boston, MA, United States, 4Neurosurgery, Beth Israel Deaconess Medical Center / Harvard Medical School, Boston, MA, United States, 5Radiology, Weill Cornell Medicine, New York, NY, United States
Synopsis
Cerebral microbleeds are bleeds < 1 cm seen on MRI, not visible on CT, which play a role in diagnosing disease and identifying risks of developing multiple diseases. Many susceptibility based techniques, such as SWI require a phase map to distinguish CMB from calcification. However, studies have demonstrated that for non-CMB bleeds on GRE and SWI, the phase dominant sign may differ across slices, preventing clinical interpretation. We compared the dominant sign for candidate CMBs on SWI phase maps and MEDI QSM images, and found that QSM images showed much less change in dominant sign than SWI phase maps.
INTRODUCTION
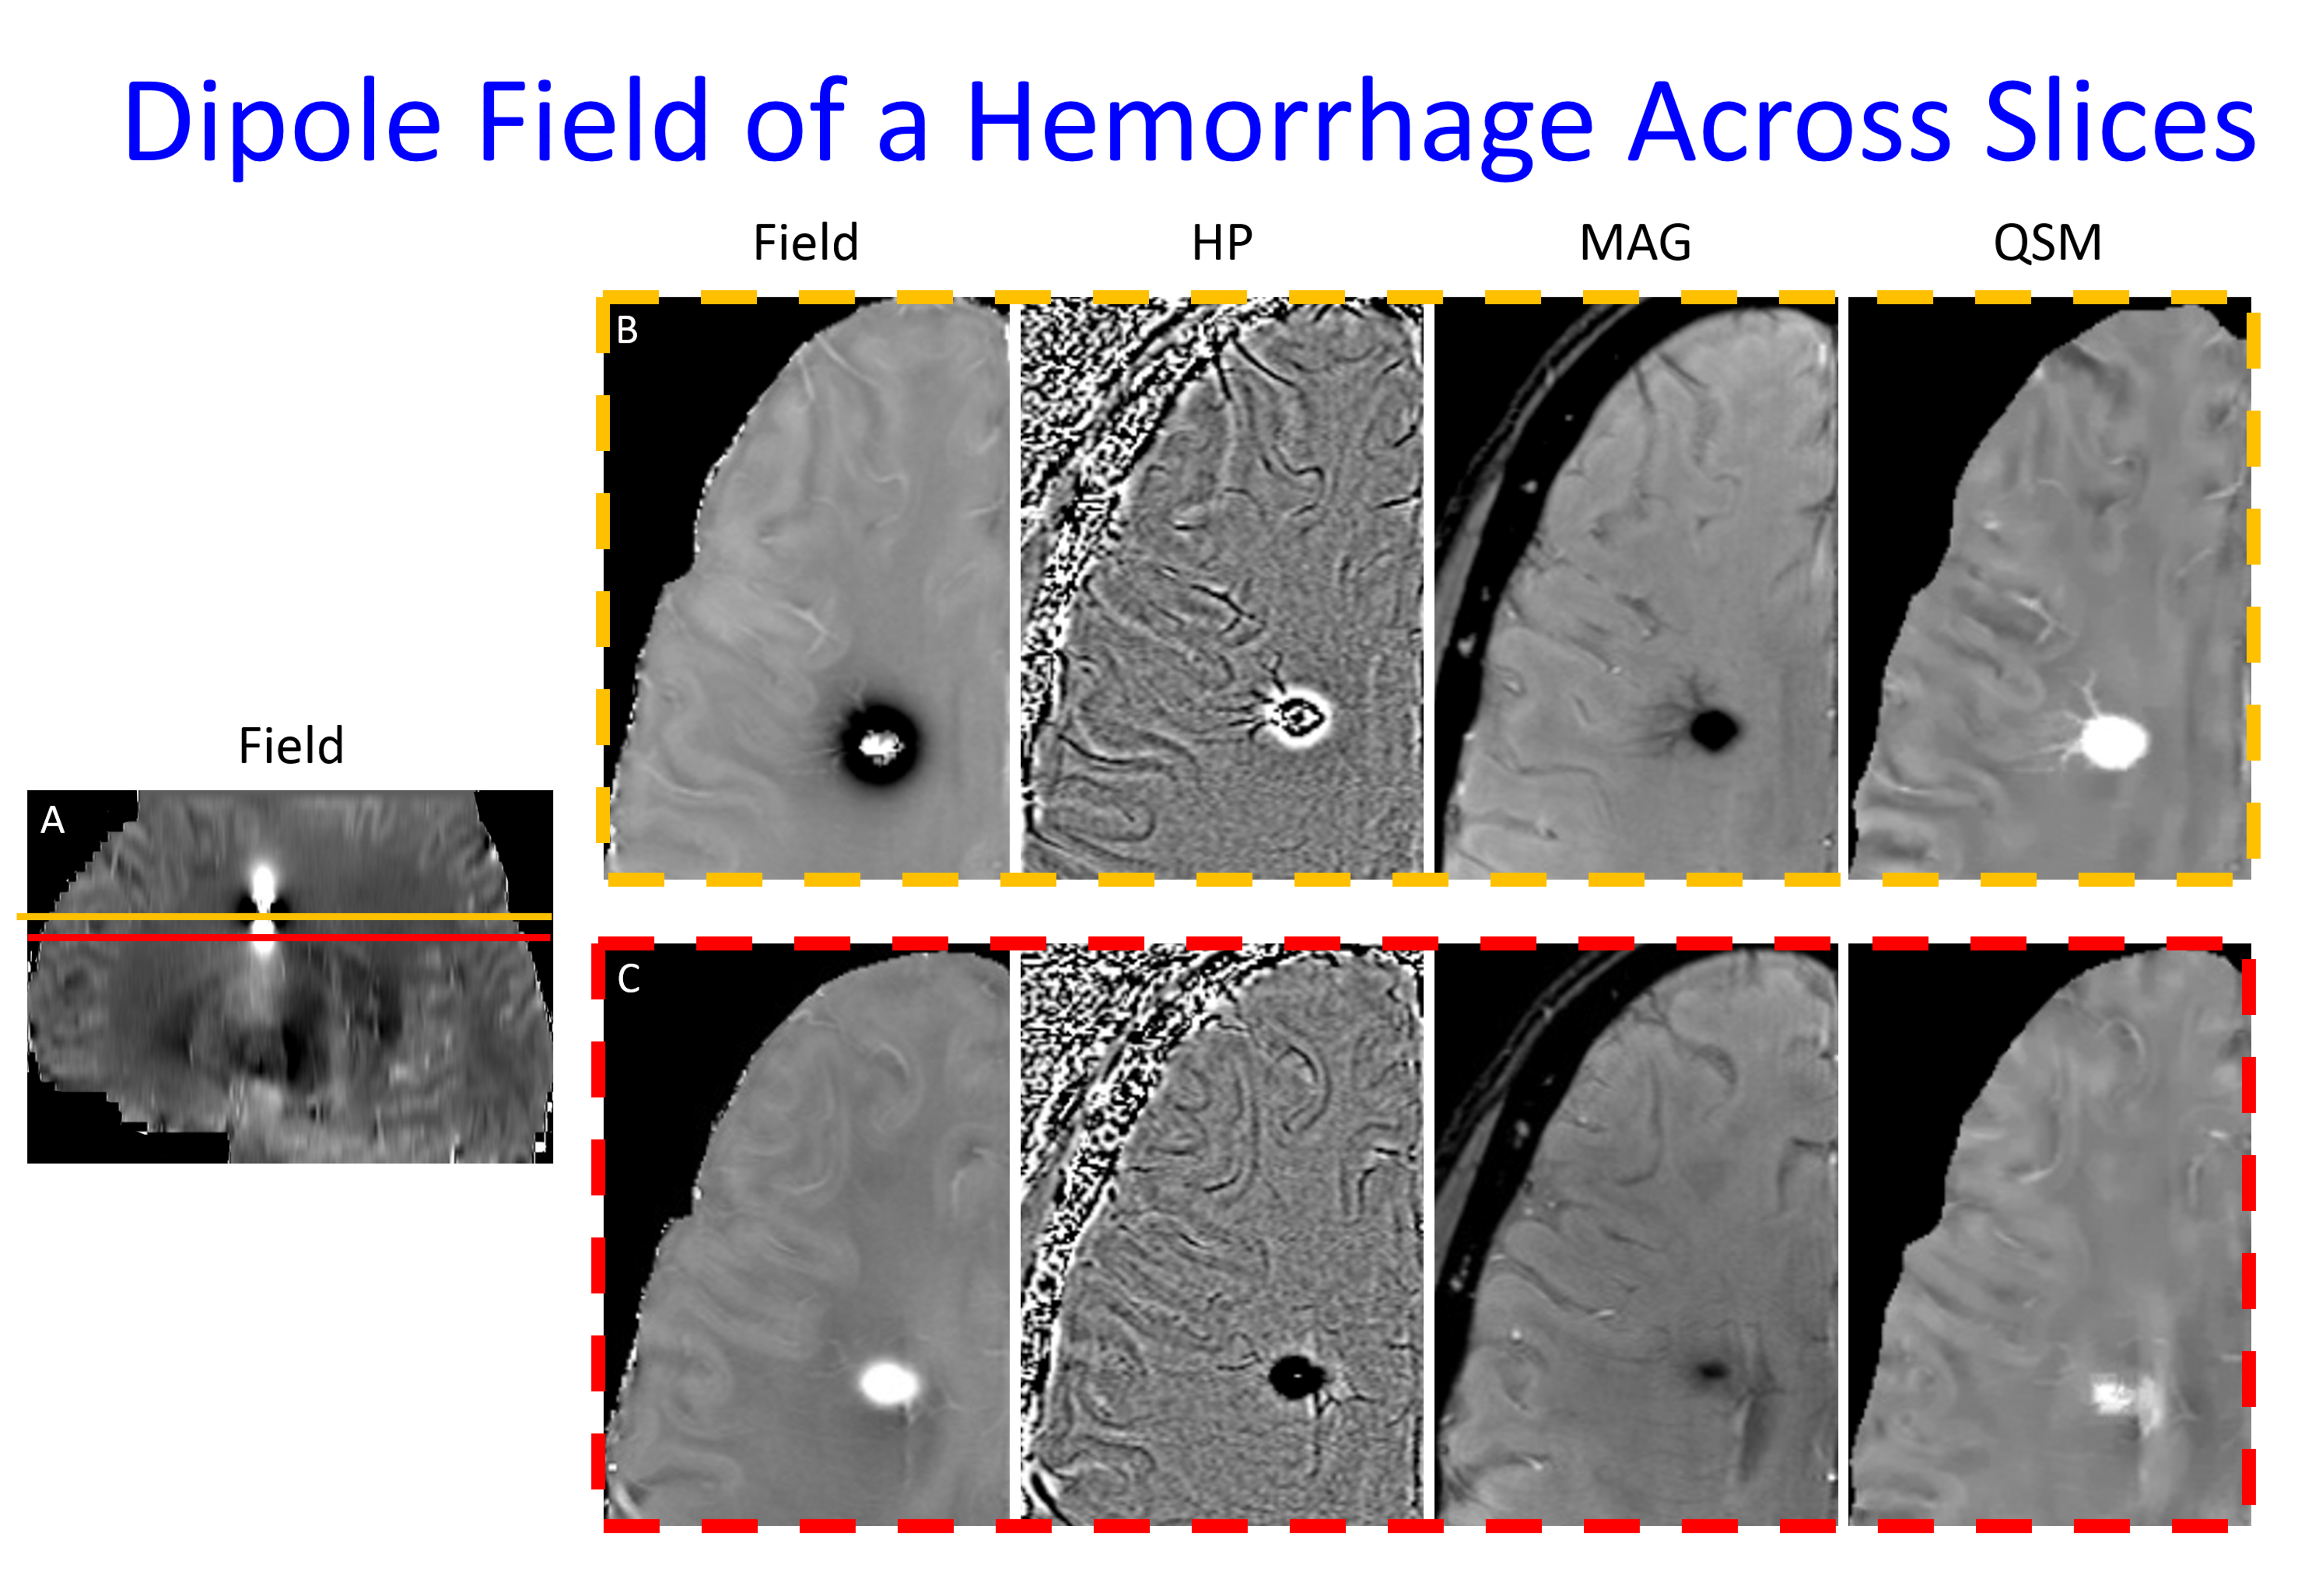
Cerebral microbleeds (CMBs) are small brain blood deposits less than 1cm on MRI, not visible on CT(1). CMB identification is central to the clinical diagnoses of cerebral amyloid angiopathy (CAA)(2), traumatic brain injury (TBI) and the Alzheimer Disease drug therapy complication Alzheimer’s related imaging abnormalities – hemorrhage (ARIA-H)(3,4). They are also part of the diagnosis of posterior reversible encephalopathy syndrome (PRES)(5), are markers of renal disease(6,7), and are associated with increased risk of symptomatic intracranial hemorrhage (ICH) after tissue plasminogen activator (TPA) administration (>10 CMBs)(8), aneurysm rupture in patients presenting with sentinel headaches (9-12), worse modified rankin scale scores after mechanical thrombectomy(13), ICH (>5 CMBs), developing dementia(14), and accelerated cognitive decline(15). However, multiple studies have found that even the most sensitive clinically available MRI technique for CMB evaluation, susceptibility weighted imaging (SWI) performed using 3T MRI, can miss up to 75% of CMBs(16). These false negative CMBs can impact clinical care if 1) a patient is pronounced to have no CMBs when at least 1 is truly present (which can result in mild TBI patients with neurologic symptoms being classified as psychiatric disorders(17,18)) and 2) the false negative CMBs occur in a clinically significant location (brainstem location in TBI may predict coma response, lobar location would suggest CAA, and basal ganglia would suggest hypertensive etiology)(17-21). Additionally, these false negatives may weaken correlations between CMBs and clinical findings such as cognitive impairment(22,23). One source of CMB false negatives is mistaking CMBs as calcifications, a remedy for which is using GRE or SWI phase maps. However, it has been shown that phase maps can be inconclusive for some susceptibility lesions, showing either alternating or co-existing signs (each sign indicating paramagnetic or diamagnetic susceptibility), making clinical determination of blood vs calcium not possible (figure 1). We sought to study if the morphology enabled dipole inversion (MEDI) QSM generated images with less of this uncertainty for evaluating CMBs.METHODS
3D multiecho GRE images were obtained on 45 patients with known recent hemorrhages using a GE 3T MR 750 DV 26 scanner using the following parameters - Field of View (FOV)=25.6, Flip Angle (FA)=12, Echo Time (TE)#1=3.648, Echo spacing=3.984, Number Echoes = 11, Bandwidth = 62.5 kHz, matrix=256x256, slice thickness = 2mm, zip2=on, zip512=on, unipolar echoes =1 using a 3.0T MRI scanner as part of clinical imaging. Under an IRB approved retrospective study protocol, the multiple echo gradient echo acquisition was used to generate a total field estiamte from the complex data of all echoes using nonlinear least squares.(24) A brain mask,was obtained using FSL BET (25,26). The background field was removed using the projection onto dipole field algorithm to yield the local field (27) Then a quantitative susceptibility map (QSM) was reconstructed using the MEDI algorithm (28,29). From the same multiple gradient echo acquisition, a susceptibility weighted image (SWI) was constructed closely following the recommendations in (30) using the first echo time that is larger than 20ms and using 4 high pass phase multiplications. A separate high pass filtered phase image (SWI phase) was constructed as well by dividing the complex gradient echo data at this echo time by the complex low-pass filtered phase of the same data. SWI phase images were then reviewed by a CAQ certified neuroradiologist with 7 years’ experience, and a first year diagnostic radiology resident for the presence of CMBs using established rating criteria(31). Structures that could be vessels or outside of the brain parenchyma (e.g. ventricles, falx, extra-axial spaces) were excluded. Lesions that may be CMBs were evaluated for changes in dominant sign from one slice to the next over the images depicting the candidate CMB. For any such structures, the corresponding MEDI images were reviewed to evaluate changes in dominant sign.RESULTS
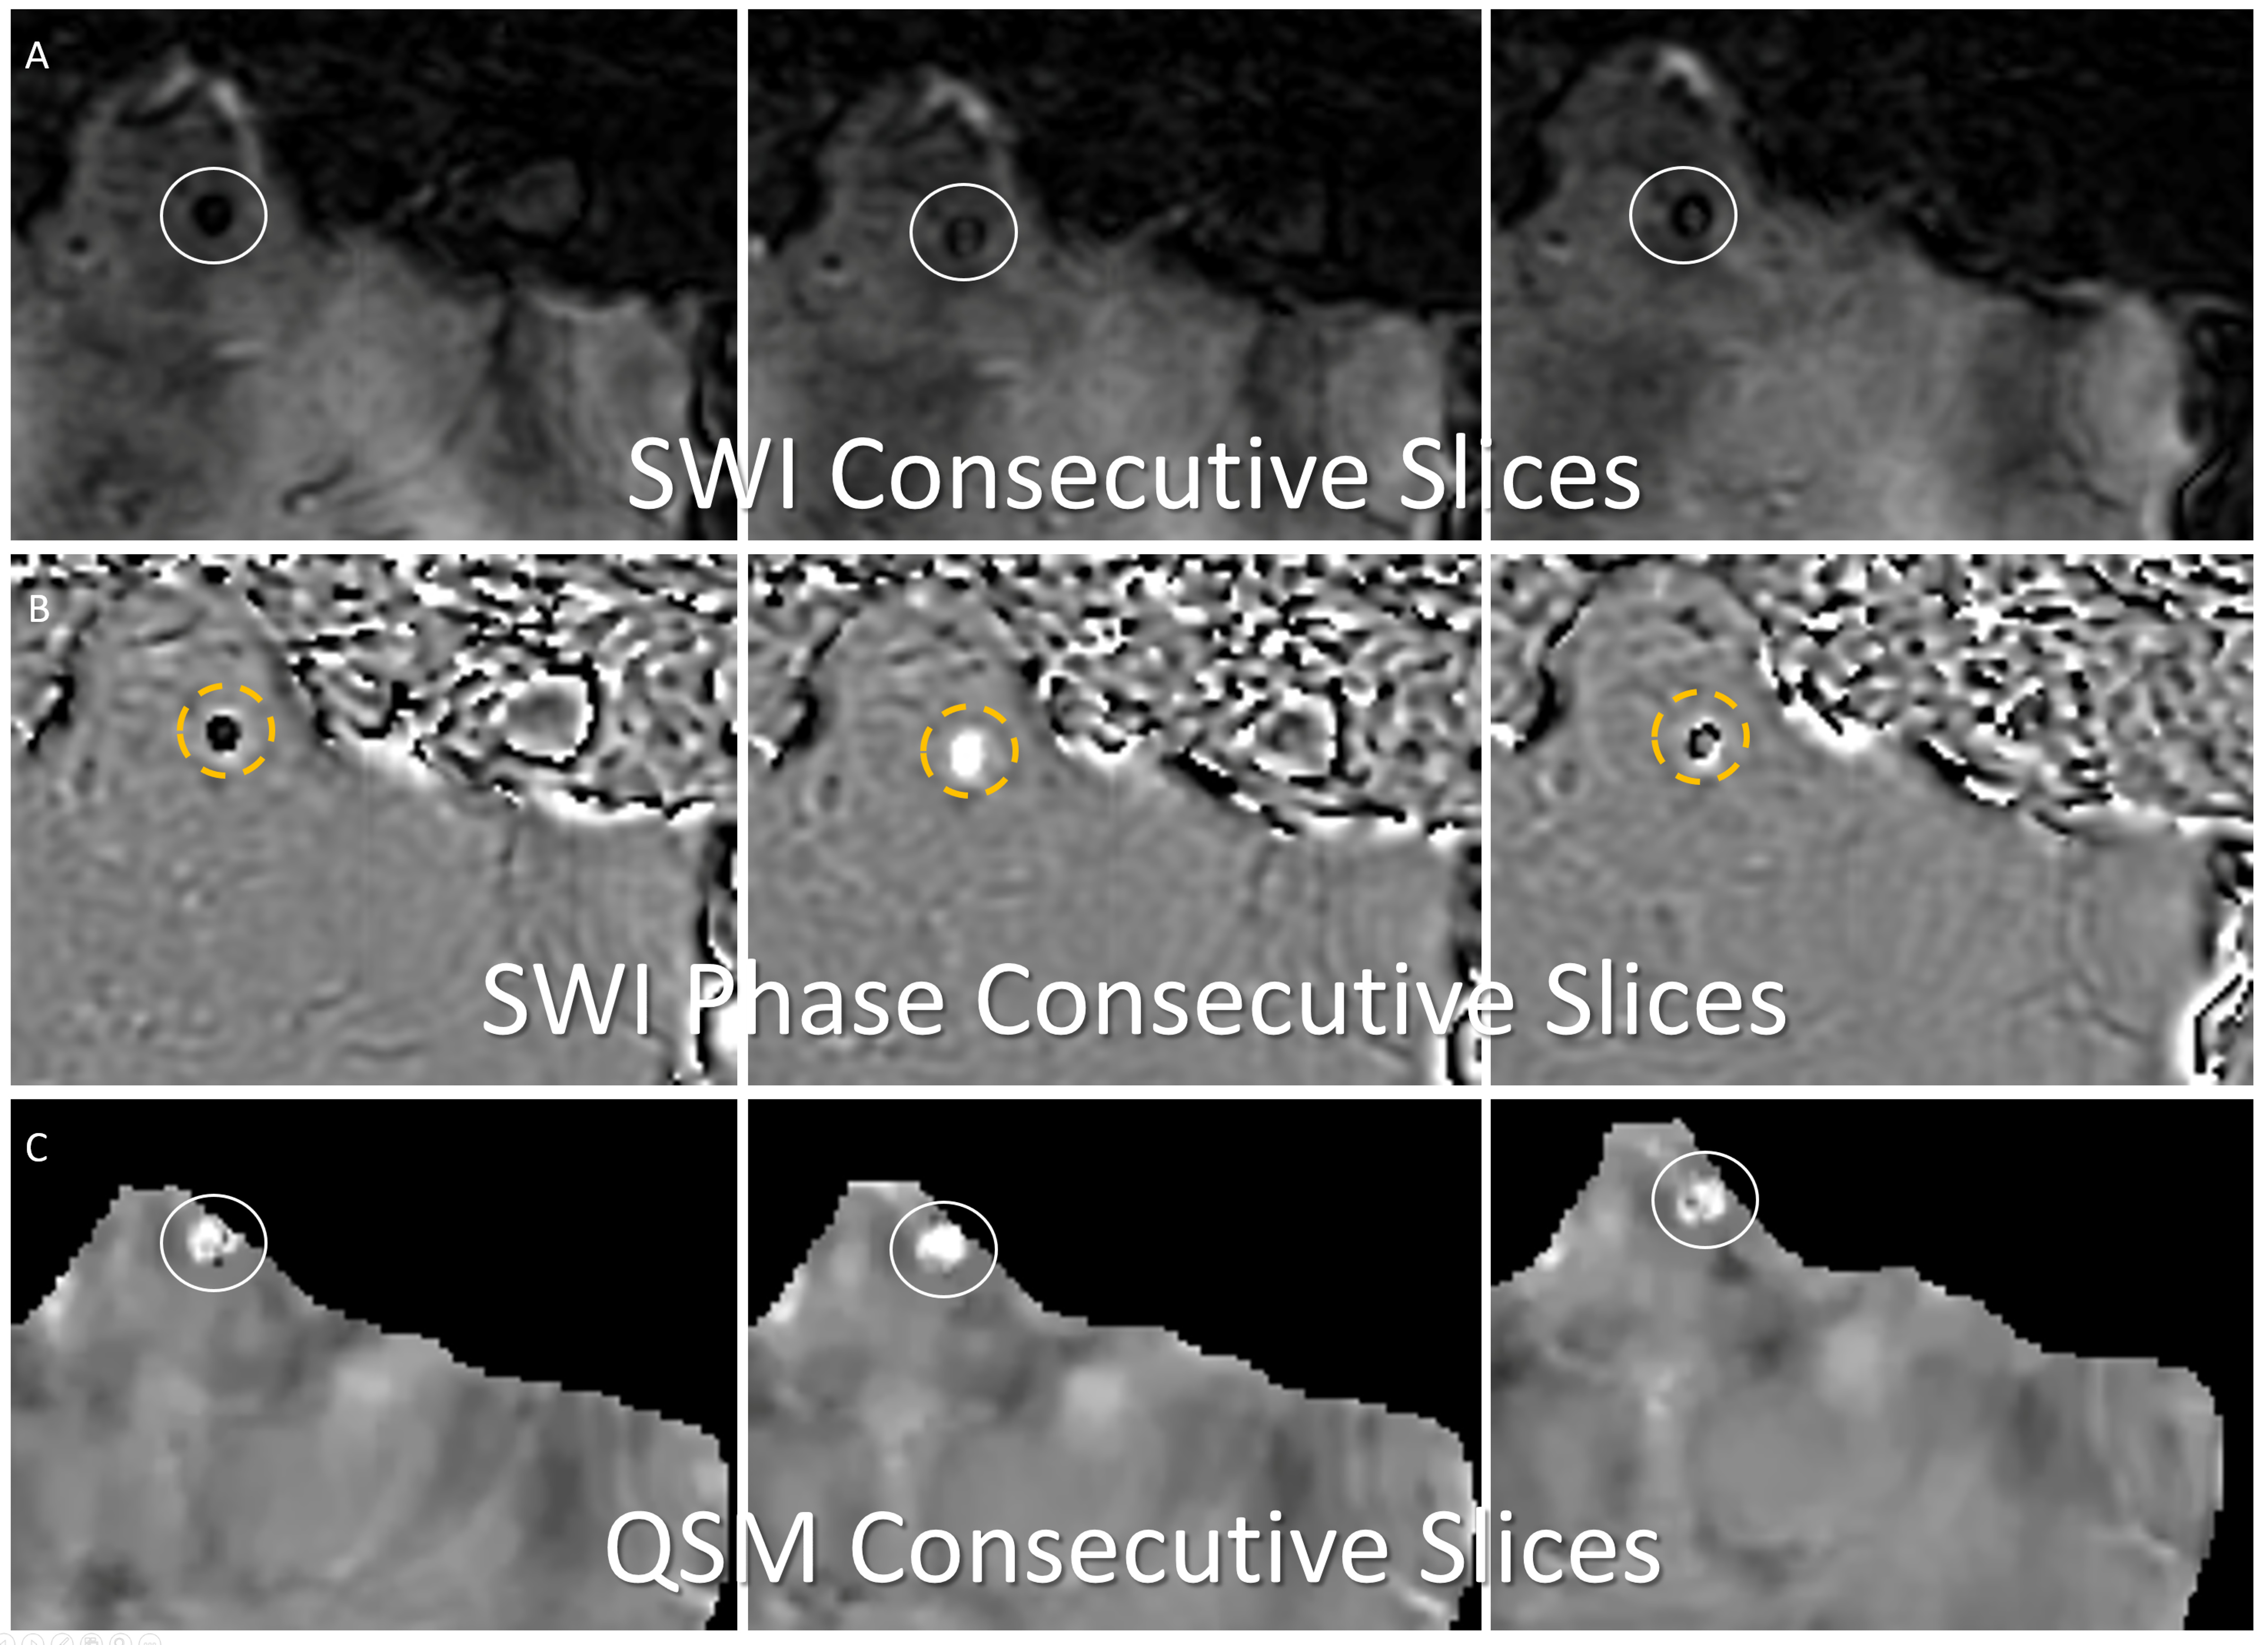
11 / 45 subjects (24%) demonstrated 1 or more candidate CMBs on SWI phase images where there was complete change in dominant sign from 1 slice to the next, with the corresponding MEDI images showing no change in dominant sign (figure 2). 30 / 45 subjects (67%) demonstrated candidate CMBs on SWI phase images with codominant signs on 1 or more image slices of the structure. Of these subjects, 21/30 (70%) did not demonstrate codominant signs on corresponding MEDI images.DISCUSSION
Similar to earlier studies comparing general intracranial bleed and calcifications on GRE and SWI to QSM(32,33), we have found that MEDI QSM images demonstrate an interpretable dominant sign for CMBs more often than SWI phase maps. These results suggest that for clinical applications, MEDI QSM may be a more reliable method for identifying the number and location of CMBs than SWI, in its ability to reduce false positives or negative determination of CMBs. Future studies validating the dominant sign seen on MEDI QSM images using some form of CT may be helpful, though micro CT techniques with pathological specimens may be necessary to do so(34).CONCLUSION
MEDI QSM may be a reliable method for distinguishing CMBs from calcifications than SWI phase maps in clinical applications.Acknowledgements
RSNA R & E foundation for support of this work through RSNA Research Scholar Grant.References
1. Greenberg SM, Vernooij MW, Cordonnier C, Viswanathan A, Al-Shahi Salman R, Warach S, Launer LJ, Van Buchem MA, Breteler MM, Microbleed Study G. Cerebral microbleeds: a guide to detection and interpretation. Lancet Neurol. 2009;8(2):165-74. Epub 2009/01/24. doi: 10.1016/S1474-4422(09)70013-4. PubMed PMID: 19161908; PMCID: PMC3414436.
2. Greenberg SM, Rosand J. Outcome markers for clinical trials in cerebral amyloid angiopathy. Amyloid. 2001;8 Suppl 1:56-60. Epub 2001/10/26. PubMed PMID: 11676292.
3. Arrighi HM, Barakos J, Barkhof F, Tampieri D, Jack C, Jr., Melancon D, Morris K, Ketter N, Liu E, Brashear HR. Amyloid-related imaging abnormalities-haemosiderin (ARIA-H) in patients with Alzheimer's disease treated with bapineuzumab: a historical, prospective secondary analysis. J Neurol Neurosurg Psychiatry. 2016;87(1):106-12. Epub 2015/02/12. doi: 10.1136/jnnp-2014-309493. PubMed PMID: 25669746; PMCID: PMC4717448.
4. Barakos J, Sperling R, Salloway S, Jack C, Gass A, Fiebach JB, Tampieri D, Melancon D, Miaux Y, Rippon G, Black R, Lu Y, Brashear HR, Arrighi HM, Morris KA, Grundman M. MR imaging features of amyloid-related imaging abnormalities. AJNR Am J Neuroradiol. 2013;34(10):1958-65. Epub 2013/04/13. doi: 10.3174/ajnr.A3500. PubMed PMID: 23578674.
5. McKinney AM, Sarikaya B, Gustafson C, Truwit CL. Detection of microhemorrhage in posterior reversible encephalopathy syndrome using susceptibility-weighted imaging. AJNR Am J Neuroradiol. 2012;33(5):896-903. Epub 2012/01/14. doi: 10.3174/ajnr.A2886. PubMed PMID: 22241378.
6. Kim SH, Shin DW, Yun JM, Lee JE, Lim JS, Cho BL, Kwon HM, Park JH. Kidney dysfunction and cerebral microbleeds in neurologically healthy adults. PLoS One. 2017;12(2):e0172210. Epub 2017/02/17. doi: 10.1371/journal.pone.0172210. PubMed PMID: 28207801; PMCID: PMC5312922.
7. Lau KK, Tsang ACO, Teo KC, Li HL, Chu LK, Li JCH, Chan MK, Wan VHL, Hui ES, Mak HKF. Age-Specific Associations of Renal Impairment and Cerebral Small Vessel Disease Burden in Chinese with Ischaemic Stroke. J Stroke Cerebrovasc Dis. 2019. Epub 2019/03/12. doi:10.1016/j.jstrokecerebrovasdis.2019.01.018. PubMed PMID: 30853188.
8. Powers WJ, Rabinstein AA, Ackerson T, Adeoye OM, Bambakidis NC, Becker K, Biller J, Brown M, Demaerschalk BM, Hoh B, Jauch EC, Kidwell CS, Leslie-Mazwi TM, Ovbiagele B, Scott PA, Sheth KN, Southerland AM, Summers DV, Tirschwell DL, American Heart Association Stroke C. 2018 Guidelines for the Early Management of Patients With Acute Ischemic Stroke: A Guideline for Healthcare Professionals From the American Heart Association/American Stroke Association. Stroke. 2018;49(3):e46-e110. Epub 2018/01/26. doi: 10.1161/STR.0000000000000158. PubMed PMID: 29367334.
9. Edlow JA, Caplan LR. Avoiding pitfalls in the diagnosis of subarachnoid hemorrhage. N Engl J Med. 2000;342(1):29-36. Epub 2000/01/06. doi: 10.1056/NEJM200001063420106. PubMed PMID: 10620647.
10. Landtblom AM, Fridriksson S, Boivie J, Hillman J, Johansson G, Johansson I. Sudden onset headache: a prospective study of features, incidence and causes. Cephalalgia. 2002;22(5):354-60. Epub 2002/07/12. doi: 10.1046/j.1468-2982.2002.00368.x. PubMed PMID: 12110111.
11. Ostergaard JR. Warning leak in subarachnoid haemorrhage. BMJ. 1990;301(6745):190-1. Epub 1990/07/28. PubMed PMID: 2203484; PMCID: PMC1663567.
12. Polmear A. Sentinel headaches in aneurysmal subarachnoid haemorrhage: what is the true incidence? A systematic review. Cephalalgia. 2003;23(10):935-41. Epub 2004/02/27. doi: 10.1046/j.1468-2982.2003.00596.x. PubMed PMID: 14984225.
13. Choi KH, Kim JH, Kang KW, Kim JT, Choi SM, Lee SH, Park MS, Kim BC, Kim MK, Cho KH. Impact of Microbleeds on Outcome Following Recanalization in Patients With Acute Ischemic Stroke. Stroke. 2018:STROKEAHA118023084. Epub 2018/12/26. doi: 10.1161/STROKEAHA.118.023084. PubMed PMID: 30580721.
14. Charidimou A, Shams S, Romero JR, Ding J, Veltkamp R, Horstmann S, Eiriksdottir G, van Buchem MA, Gudnason V, Himali JJ, Gurol ME, Viswanathan A, Imaizumi T, Vernooij MW, Seshadri S, Greenberg SM, Benavente OR, Launer LJ, Shoamanesh A, International M-MI. Clinical significance of cerebral microbleeds on MRI: A comprehensive meta-analysis of risk of intracerebral hemorrhage, ischemic stroke, mortality, and dementia in cohort studies (v1). Int J Stroke. 2018;13(5):454-68. Epub 2018/01/18. doi: 10.1177/1747493017751931. PubMed PMID: 29338604; PMCID: PMC6123529.
15. Cordonnier C, van der Flier WM, Sluimer JD, Leys D, Barkhof F, Scheltens P. Prevalence and severity of microbleeds in a memory clinic setting. Neurology. 2006;66(9):1356-60. Epub 2006/05/10. doi: 10.1212/01.wnl.0000210535.20297.ae. PubMed PMID: 16682667.
16. Haller S, Scheffler M, Salomir R, Herrmann FR, Gold G, Montandon ML, Kovari E. MRI detection of cerebral microbleeds: size matters. Neuroradiology. 2019;61(10):1209-13. Epub 2019/08/10. doi: 10.1007/s00234-019-02267-0. PubMed PMID: 31396662.
17. Scheid R, Preul C, Gruber O, Wiggins C, von Cramon DY. Diffuse axonal injury associated with chronic traumatic brain injury: evidence from T2*-weighted gradient-echo imaging at 3 T. AJNR Am J Neuroradiol. 2003;24(6):1049-56. Epub 2003/06/19. PubMed PMID: 12812926.
18. Iverson GL, Gardner AJ, Terry DP, Ponsford JL, Sills AK, Broshek DK, Solomon GS. Predictors of clinical recovery from concussion: a systematic review. Br J Sports Med. 2017;51(12):941-8. Epub 2017/06/02. doi: 10.1136/bjsports-2017-097729. PubMed PMID: 28566342; PMCID: PMC5466929.
19. Hilario A, Ramos A, Millan JM, Salvador E, Gomez PA, Cicuendez M, Diez-Lobato R, Lagares A. Severe traumatic head injury: prognostic value of brain stem injuries detected at MRI. AJNR Am J Neuroradiol. 2012;33(10):1925-31. Epub 2012/05/12. doi: 10.3174/ajnr.A3092. PubMed PMID: 22576887.
20. Humble SS, Wilson LD, Wang L, Long DA, Smith MA, Siktberg JC, Mirhoseini MF, Bhatia A, Pruthi S, Day MA, Muehlschlegel S, Patel MB. Prognosis of diffuse axonal injury with traumatic brain injury. J Trauma Acute Care Surg. 2018;85(1):155-9. Epub 2018/02/21. doi: 10.1097/TA.0000000000001852. PubMed PMID: 29462087; PMCID: PMC6026031.
21. Izzy S, Mazwi NL, Martinez S, Spencer CA, Klein JP, Parikh G, Glenn MB, Greenberg SM, Greer DM, Wu O, Edlow BL. Revisiting Grade 3 Diffuse Axonal Injury: Not All Brainstem Microbleeds are Prognostically Equal. Neurocrit Care. 2017;27(2):199-207. Epub 2017/05/10. doi: 10.1007/s12028-017-0399-2. PubMed PMID: 28477152; PMCID: PMC5877823.
22. Barnaure I, Montandon ML, Rodriguez C, Herrmann F, Lovblad KO, Giannakopoulos P, Haller S. Clinicoradiologic Correlations of Cerebral Microbleeds in Advanced Age. AJNR Am J Neuroradiol. 2017;38(1):39-45. Epub 2016/10/01. doi: 10.3174/ajnr.A4956. PubMed PMID: 27686485.
23. Haller S, Vernooij MW, Kuijer JPA, Larsson EM, Jager HR, Barkhof F. Cerebral Microbleeds: Imaging and Clinical Significance. Radiology. 2018;287(1):11-28. Epub 2018/03/21. doi: 10.1148/radiol.2018170803. PubMed PMID: 29558307.
Figures