1809
Multiparametric brain MR Imaging for the assessment of Multiple Sclerosis disease progression over 6 months
Xiaomeng Zhang1, Xiaoqing Yang2, Karthikeyan Subramanian3, Bradley A Hooker1, Mark Haacke3, Ivonne Suridjan1, Qi Guo1, Robert Comley1, Adam Ziemann4, and Yanping Luo1
1Translational imaging, iSAT, Abbvie Inc., North Chicago, IL, United States, 2Data & Statistical Sciences, Abbvie Inc., North Chicago, IL, United States, 3Wayne state university, Detroit, MI, United States, 4Neuroscience Development, Abbvie Inc., North Chicago, IL, United States
1Translational imaging, iSAT, Abbvie Inc., North Chicago, IL, United States, 2Data & Statistical Sciences, Abbvie Inc., North Chicago, IL, United States, 3Wayne state university, Detroit, MI, United States, 4Neuroscience Development, Abbvie Inc., North Chicago, IL, United States
Synopsis
Quantitative brain MRI was used to evaluate 18 RRMS patients and 10 age matched controls at baseline and 6 months. The study aimed to assess test-retest reproducibility in healthy controls, disease variability in the RRMS population, and sensitivity to disease progression of each MRI-derived parameter. The results will inform the selection of MRI measures to be used as biomarkers in future clinical trials. In addition, longitudinal multiparametric assessment of MS lesions may improve our understanding of different pathological components of such lesions (e.g. inflammation, demyelination, and iron accumulation) during disease progression.
Introduction
Multiple Sclerosis (MS) is a chronic autoimmune and neurodegenerative disorder of the central nervous system (CNS) that is characterized by a wide range of symptoms and multiple progressive courses. Conventional MRI assessments (T2-Flair, GAD-enhancing T1W) of disease activities represent one of the key parameters in RRMS clinical trials. Combining multiple quantitative MRI readouts that reflect different aspects of pathophysiological processes may allow lesions to be more accurately staged. In this study, we used a multiparametric MRI approach to assess the reproducibility of various MRI sequences, changes over a 6 month period and the correlation with clinical scores.Methods
Eighteen relapsing remitting MS (RRMS) patients (37.8+/-8 years of age; 15 females) and ten age matched healthy controls (35.4+/-12 years of age; 6 females) (HC) were included in the study. The disease duration for the MS subjects was 6.1+/-5 years. All RRMS patients received standard therapy during the study. Patients underwent two MR imaging sessions at baseline and 6 months with Expanded Disability Status Scale (EDSS) assessments at both visits. HC received two scans within a 2-weeks window in order to assess the test-retest variability of the MR derived measures.All subjects were imaged on a 3T Siemens Verio. The MRI sequences included: pre and post contrast T1W, T2W, 3D T2-Flair, Diffusion Tensor Imaging (DTI), Magnetization Transfer (MT), myelin water fraction (MWF), Susceptibility-weighted imaging (SWI) and STrategically Acquired Gradient Echo (STAGE) imaging. Images were processed using SPIN software (SpinTech Inc., MI). STAGE images were processed using custom Matlab-based software in order to generate phase, SWI, T2*/R2*, QSM data, T1 maps and PD maps. DTI studio was used to generate fractional anisotropy (FA), radial diffusivity (RD) and mean diffusivity (MD) maps. MTR was calculated as the ratio (MTCoff-MTCon)/MTCoff. Regions of interest (ROI) were manually drawn around all radiologist confirmed white matter lesions which appeared in T2-Flair and/or QSM. These lesions were then manually drawn across all image maps/contrasts as they appeared within that images with a NAWM region drawn contralateral. Normal brain tissue ROIs were also drawn in the HC sampling five different regions (juxtacortical, periventricular, deep white matter, cerebellum and grey matter).
The correlation between Imaging-derived parameters and EDSS scores (at both baseline and 6 months) was evaluated using Spearman correlation coefficient. Test-retest variability was evaluated using intraclass correlation coefficient (ICC). Paired t-test were used assess the change in imaging parameters over a 6 months period. Bonferroni correction was used to control the family-wise error rate for the multiple t-tests of the test-retest reliability.
Results
Test-retest: Imaging parameters derived from different MRI sequences used did not show significant differences (adjusted P>0.804) in HC test-retest within 10 days. Reproducibility for the HC data were generally good (ICC>0.632) with highest ICC (0.826) from MTR (Table 1).Longitudinal assessment: Lesion count in MS subjects varied from 2 to 84 lesions in the 18 subjects with clearly visible lesions on T2-Flair. A total of 18 MS subjects and 2 (out of 10) HC subjects had T2-Flair lesions at both time points. All lesions delineated by QSM also appeared as hyperintense in T2-Flair images, but not all lesions on T2-Flair were observed on QSM. A total of 384 QSM positive lesions (QSM+) were found in 18 subjects and 94 QSM negative (QSM-) lesions were found in 11 subjects. The apparent diffusion coefficient (ADC) derived from diffusion MR, demonstrated significant changes over 6 months (p<0.0334), but only in periventricular QSM- defined lesions. No significant functional changes (EDSS) were observed during the period of 6 months.
Correlations between MRI-derived parameters and EDSS score: Among all the MRI measures investigated over different brain regions, periventricular lesion volumes delineated by DTI-RD or MD showed the strongest correlation with EDSS over time (r=0.52, p<0.002). Followed were lesion volumes delineated by MTR, T2-flair in the same brain region with slightly lower correlation coefficient (r=0.51, 0.50 respectively, p < 0.003). All measures from lesions in juxtacortical, deep white matter, brainstem, cerebellum, corpus callosum, grey Matter, internal Capsule and sub-insular areas showed little correlations with EDSS (Table 2).
Discussion
Number of lesions or lesion burden is reported to have a poor correlation with disability as assessed by EDSS (1), however, considering that different areas of the brain are involved in different types of functional activities, the spatial distribution of MS lesions may play an important role in determining the functional disability (2-4). In this study, the total volume of periventricular lesions was larger than other brain regions, which may explain their higher correlation with functional readouts.Most lesions identified by susceptibility contrast are QSM positive. Those lesions are normally seen late in the demyelination phase and are generally considered to be chronic. Only two lesions were detected by contrast enhanced imaging (increased CBV), therefore few acute lesions were included in this study.
Conclusion
Multiparametric MRI shows good test-retest reliability within a single imaging site. Periventricular lesion volume shows the strongest correlation with the clinical outcome measure EDSS in RRMS patients. MRI is sensitive to lesion changes over 6 months, and as such can be considered as a tool to monitor disease progression in RRMS patients.Acknowledgements
This study was funded by Abbvie.References
- Goodin DS. Magnetic resonance imaging as a surrogate outcome measure of disability in multiple sclerosis: Have we been overly harsh in our assessment? Annals of Neurology 2006;59(4):597-605.
- Soriano-Raya JJ, Miralbell J, Lopez-Cancio E, Bargallo N, Arenillas JF, Barrios M, Caceres C, Toran P, Alzamora M, Davalos A, Mataro M. Deep versus periventricular white matter lesions and cognitive function in a community sample of middle-aged participants. J Int Neuropsychol Soc 2012;18(5):874-885.
- Vellinga MM, Geurts JJ, Rostrup E, Uitdehaag BM, Polman CH, Barkhof F, Vrenken H. Clinical correlations of brain lesion distribution in multiple sclerosis. J Magn Reson Imaging 2009;29(4):768-773.
- De Groot JC, De Leeuw FE, Oudkerk M, Van Gijn J, Hofman A, Jolles J, Breteler MM. Periventricular cerebral white matter lesions predict rate of cognitive decline. Ann Neurol 2002;52(3):335-341.
Figures
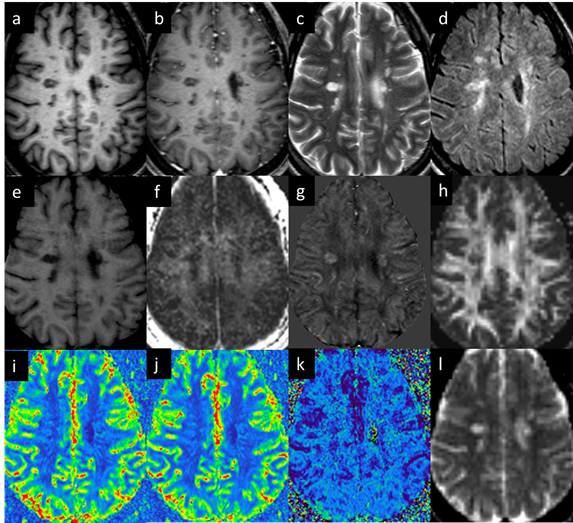
Figure 1: Lesion
appearance in different modalities: (a) pre-contrast T1W, (b) post-contrast
T1W, (c) T2W, (d) T2 FLAIR, (e) MTR, (f)
MWF, (g) QSM, (h) FA, (i) CBV, (j) CBF, (k) MTT, and (l) ADC.
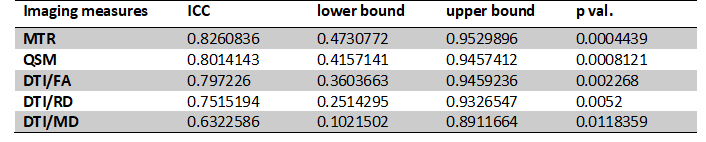
Table 1.
Test–Retest Reproducibility of selected imaging derived parameters.
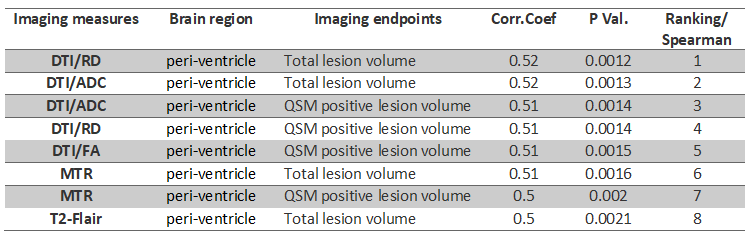
Table 2. Top
correlations form imaging measures (r>=0.5) and functional readouts (EDSS
scores). Ten brain regions (whole brain, periventricular, juxtacortical, deep white
matter, brainstem, cerebellum, corpus callosum, grey Matter, internal Capsule
and sub-insular) were applied with multiple brain MRI readouts: T1W, T2W,
T2-FLAIR, DTI, MTC, MWF, phase, SWI, T2*/R2*, QSM data, T1 maps and PD maps.