1807
Optimization of k-space Filtering for Compensating T2 Blurring in 3D ASL-MRI: Application to GBM1Radiology, UT Southwestern Medical Center, Dallas, TX, United States, 2Pediatrics, UT Southwestern Medical Center, Dallas, TX, United States, 3Neurology and Neurotherapeutics, UT Southwestern Medical Center, Dallas, TX, United States, 4Neurological Surgery, UT Southwestern Medical Center, Dallas, TX, United States, 5Harold C. Simmons Cancer Center, UT Southwestern Medical Center, Dallas, TX, United States, 6Advanced Imaging Research Center, UT Southwestern Medical Center, Dallas, TX, United States
Synopsis
3D arterial spin labeled (ASL) MRI using turbo spin echo (TSE) acquisition suffers from image blurring, due to T2 decay along the echo train. In this study, a k-space filtering method proposed earlier was optimized to compensate T2 blurring, incorporating ASL T2 measurements in healthy volunteers for T2 decay estimation. This method was then applied to 3D ASL images acquired in healthy volunteers and patients with glioblastoma (GBM) from an ongoing clinical trial. Results showed reduced image blurring in both volunteers and patients.
Introduction
3D TSE and GRASE acquisitions are recommended for brain ASL because of their high SNR and compatibility with optimal background suppression [1]. While 3D TSE acquisitions are more robust to B0 inhomogeneities, they suffer from image blurring due to T2 decay along the long echo trains. k-space filtering based on accurate estimation of signal decay can reduce image blurring [2] and is well-suited for ASL images with optimized background suppression, since the majority of the signal is from a single tissue component. In this study, the k-space filtering was optimized by accurately simulating the signal decay along the 3D TSE echo train using the measured T2 of the brain ASL signals in healthy volunteers. The performance of the optimized k-space filtering was evaluated on 3D ASL images in healthy volunteers and glioblastoma (GBM) patients.Methods
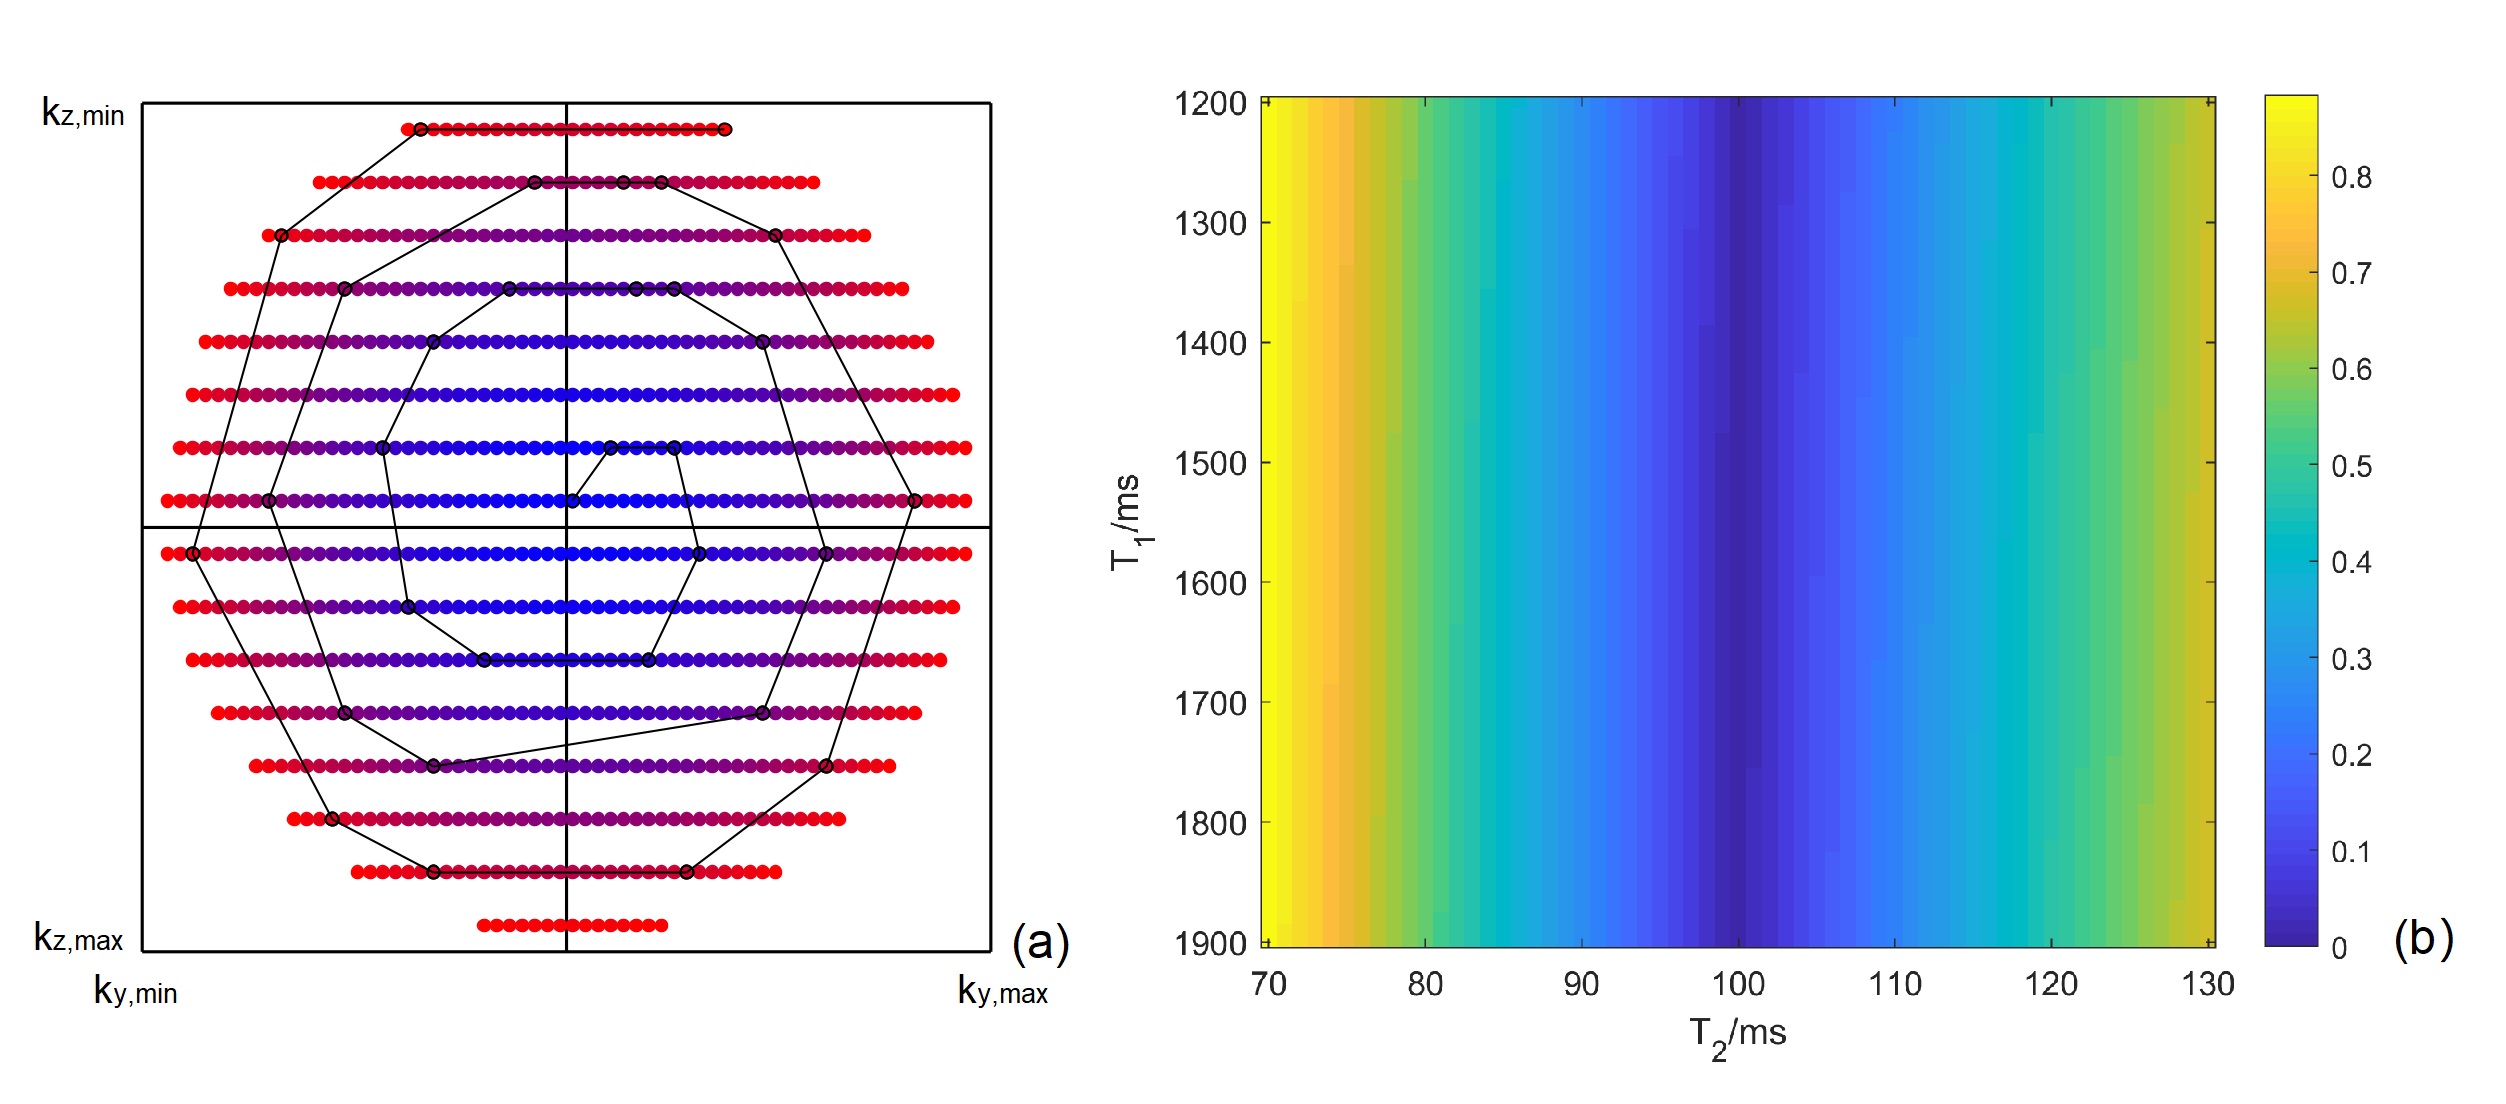
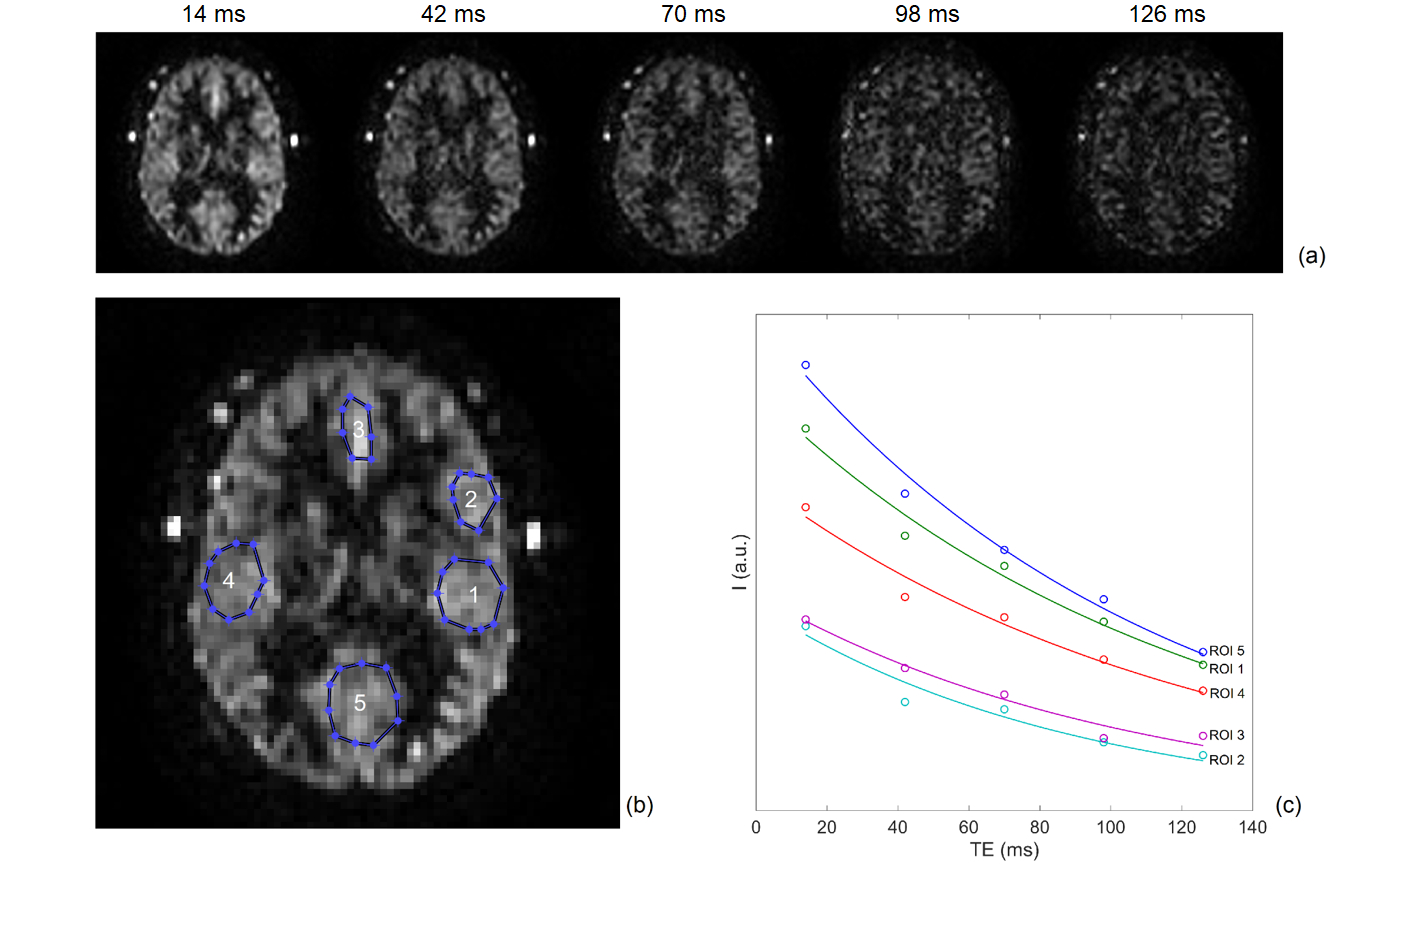
EPG Signal: This study used pseudo-continuous ASL (pCASL) with optimized background suppression and a 3D TSE Cartesian acquisition with Spiral Profile Reordering (CASPR) (Fig. 1a) [3] on a 3T scanner (Ingenia, Philips Healthcare). The signal decay along the echo train was calculated using the extended phase graph (EPG) algorithm [4]. Since the EPG signal is a function of T1 and T2, the sensitivity of signal difference at different T1 and T2 values compared to a constant value (e.g. gray matter with T1 = 1600 ms and T2 = 100 ms) [5] was calculated as \[\sqrt{\sum^{ETL}_{i=1}{{\left[S_i\left(T_1,T_2\right)-S_i\left(T_{1g},T_{2g}\right)\right]}^2}}(1),\] where ETL is the echo train length, s is the EPG signal, T1g and T2g are the gray matter T1 and T2.MR Acquisition: 3D ASL was performed in 9 healthy volunteers and 5 GBM patients with IRB approval. The imaging parameters were: TR/TE = 6000/14 ms, FOV = 220x220x110 mm3, matrix = 64x64 with 36 slices, acquired resolution = 3.5x3.5x6 mm3, reconstructed resolution = 3x3x3 mm3, label duration = 1.8 s, post-label delay = 1.8 s, 1 repetition, 4 background suppression pulses and acquisition time = 3 minutes. A M0 image was acquired using same acquisition parameters in 1:30 minutes. Other parameters were echo spacing = 2.8 ms and ETL = 80. In 5 healthy volunteers, the T2 values of background suppressed ASL signal was also measured using 3D TSE-CASPR with 5 TEs (14, 42, 70, 98, and 126 ms). For comparison, ASL images were also acquired using the vendor supplied 3D GRASE acquisition in all volunteers matching the same imaging parameters as 3D TSE-CASPR except: TR/TE = 3900/14 ms, signal averages = 3, and total acquisition time = 4:30 mins, included a M0 acquisition, matching the total acquisition time of 3D TSE-CASPR.
Image Analysis: T2 values were calculated using mono-exponential regression of image intensities in multiple ROIs . A truncated k-space filter was designed, such that,\begin{equation} I(n) = \begin{cases}\frac{1}{s\left(n\right)},\ n<n_c \\ F\left(n\right),\ otherwise \end{cases} (2) ,\end{equation}where I is the filter intensity, n is the echo index, s is the EPG signal using the measured T2 and the gray matter T1, F is a Fermi window with optimized width and radius, nc is a ‘cut-off’ echo where the truncation of the filter begins. The filters with different cut-off echoes were designed and applied to 3D ASL images on the scanner reconstruction platform (Philips Recon 2.0), and their performance was evaluated by a blur metric [6], for which a higher value reflects a more blurred image. Paired t-test was used for blur metric comparison. The SNRs were quantified using the differences of two pairs of ASL images [7], acquired in 2 healthy volunteers. Cerebral blood flow (CBF) maps were calculated and compared between the original and the filtered images using Bland-Altman analysis.
Results
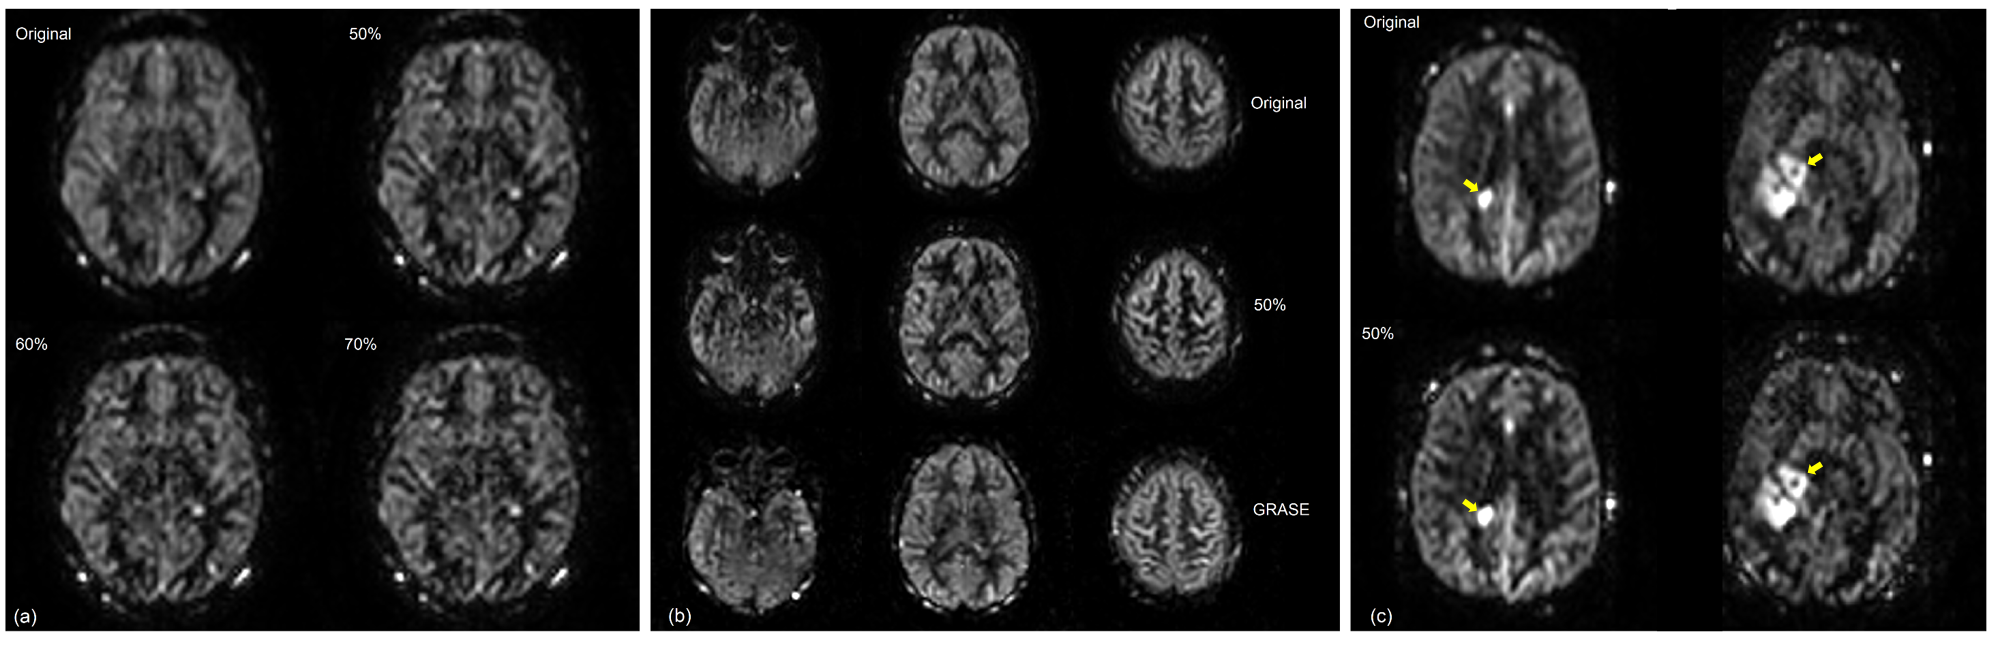
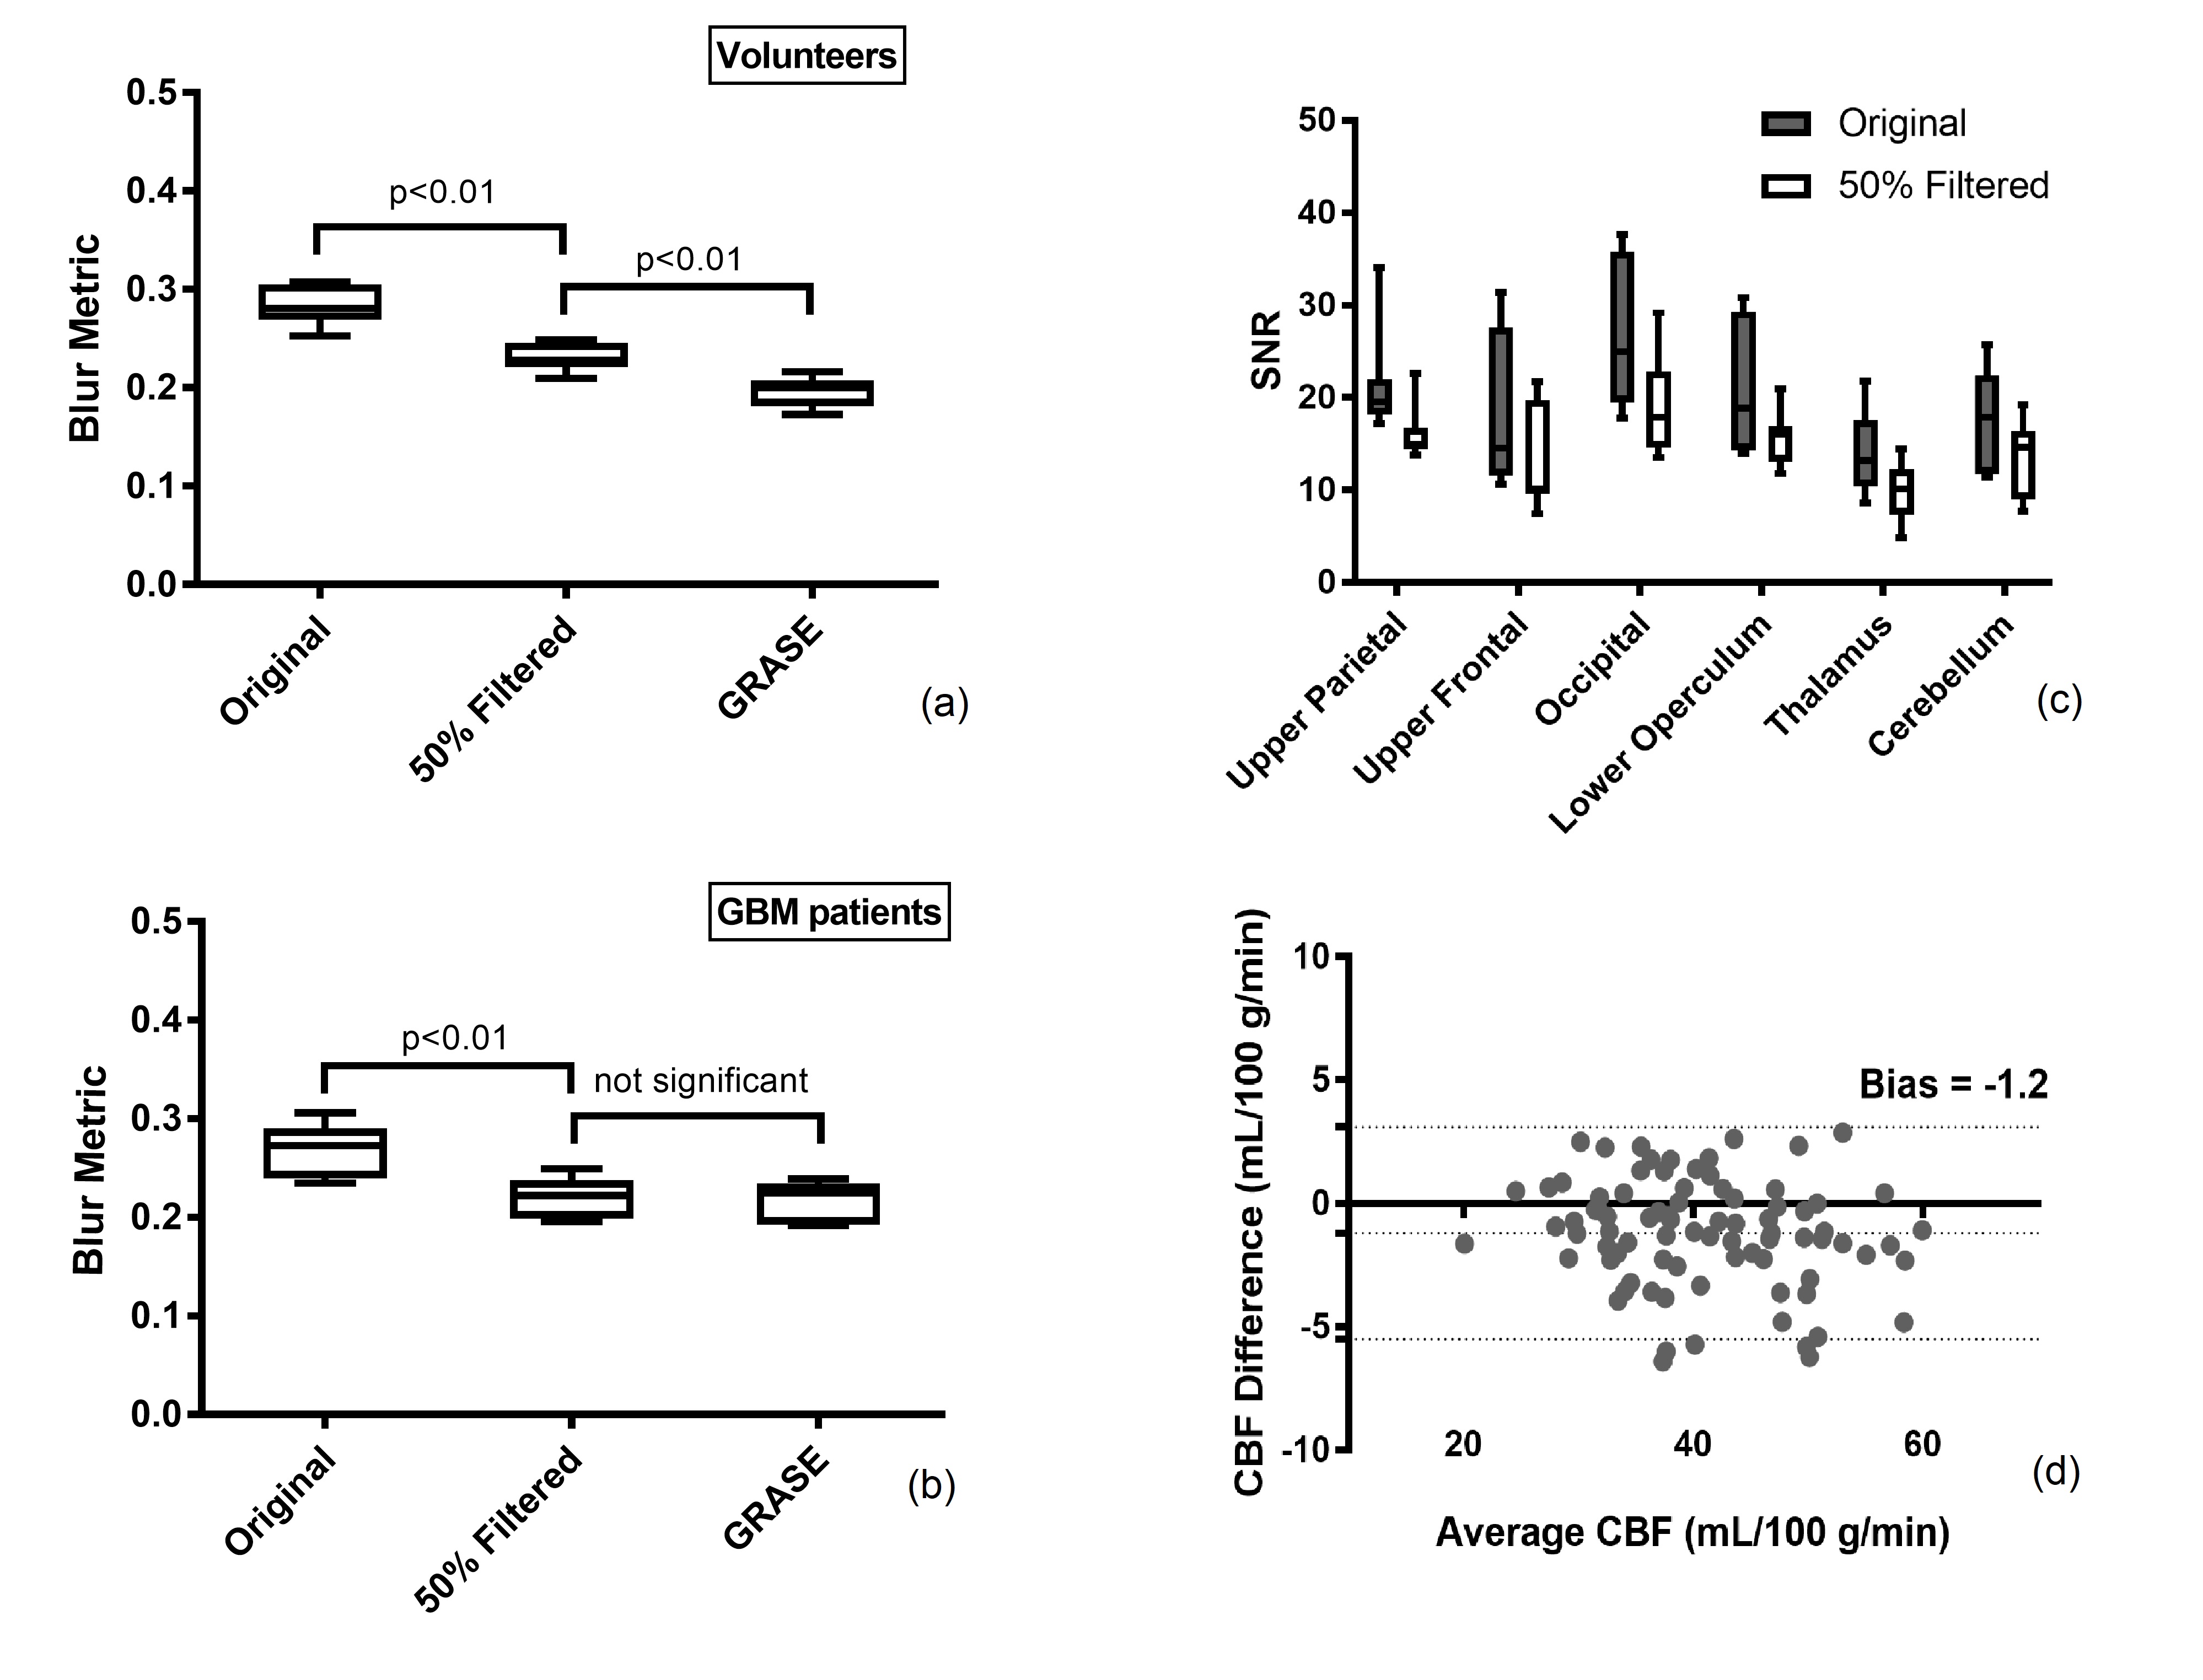
The EPG signal difference shows minimal variation for different T1 values but increased variation to T2 values (Fig. 1b), indicating that accurate measurement of T2 is important for true signal estimation. Across 5 subjects, the measured T2 value of background suppressed ASL signal was 106 ± 8 ms (Fig. 2). Fig. 3a shows the filter intensity as a function of echo index at 3 cut-off echoes (nc) and the 3D rendering of the filter at 50% nc using T1 = 1600 ms and T2 = 106 ms. The k-space filtering improved image sharpness with increasing nc but at the expense of SNR (Fig. 4a). A 50% nc was chosen to be the optimal ratio that provided improved sharpness without significant SNR loss, compared to 3D GRASE images in healthy volunteers (Fig. 4b) as well as in GBM patients (Fig. 4c). With filtering at 50% nc, images showed significantly reduced (p<0.01) blurring in healthy volunteers (Fig. 5a) and GBM patients (Fig. 5b). On average, 50% nc filtering reduced SNR by 27% across different brain regions (Fig. 5c), but without affecting the CBF values (Fig. 5d).Discussion and Conclusion
The k-space filtering method can be used to improve image sharpness of 3D TSE-CASPR pCASL images, without significant SNR loss. This would allow robust ASL images using 3D TSE acquisition in regions with increased B0 inhomogeneities, such as brain stem and GBM patients that often have craniotomy.Acknowledgements
This work was partly supported by the NIH/NCI grant U01CA207091.References
[1] Alsop, DC et al. MRM 2015; 73(1):102-116.
[2] Wang, Y et al. ISMRM 2019:4962.
[3] Greer, JS et al. MRM 2019; 82(5):1713-1724.
[4] Hennig, J et al. MRM 2004; 51(1):68-80.
[5] Wright, PJ et al. MAGMA 2008; 21(1-2):121-130.
[6] Crete-Roffe, F et al. HVEI 2007; 12:6492-6416.
[7] Dietrich O et al. JMRI 2007; 26:375-385.
Figures