1805
Visualization of uncertainty in tractograms using ROC-based transfer functions for real-time TMS applications1Department of Neuroscience and Biomedical Engineering, Aalto University, Helsinki, Finland
Synopsis
Transcranial magnetic stimulation (TMS) is a
non-invasive brain stimulation technique that is widely used in both
research and clinical settings. However, state-of-the-art TMS
guidance systems do not leverage the valuable structural connectivity
in real-time applications. This is mainly due to the limitations of
tractography which has been increasingly pointed out in validation
studies. In order to address this problem, in this work we propose a
novel visualization approach that is capable of providing information
about the uncertainty of obtained streamlines. Our technique offers
an easy and intuitive way for the TMS operator to interpret the
displayed streamlines in real-time.
Introduction
Tractography is a non-invasive and in vivo technique that is capable of revealing structural connections in the human brain based on diffusion MRI (dMRI). Real-time information about the structural connections in the brain would be highly valuable when performing transcranial magnetic stimulation (TMS). Currently, with the state-of-the-art TMS navigation systems, operators can see the TMS coil with respect to subject’s brain MRI and the affected area on a computer screen. However, these systems do not show which connections are affected by the stimulation. With the advancements in rapid imaging techniques, preprocessing, modeling of dMRI and fiber tracking algorithms, tractography has become a widely used tool but not for TMS in real-time settings. One major reason behind this is the limitations of tractography, which have increasingly been pointed out in the results of validation studies as well as international tractography challenges [1-5].Owing largely to the validation experiments conducted by Thomas et.al. [1], using receiver operator characteristic (ROC) curves has become a widely adopted approach to study the performance of fiber tracking results. Using false positive rate and true positive rate (or bundle overreach and bundle overlap), several groups presented reports on the performance of tractography. Based on a simulated dataset, as a result of 2015 ISMRM tractography challenge, Maier-Hein et.al. highlighted that tractograms contain large numbers of false positive fiber bundles [2]. On the other hand, by comparing tracer injections against dMRI-based tractograms, Aydogan et.al. showed that tractography also suffers from a false negative problem [5]. Importantly, using ROC curves, Aydogan et.al. studied the trends in tractography performance with respect to changes in several fiber tracking parameters [5].
In this work, we present a new visualization approach based on the observation in [5], which states that the confidence in tractography results can be increased by repeating the experiments with multiple different parameter combinations. In our study, we leverage this approach for the navigation of TMS for real-time applications where we locally seed tracks within the area that is affected by the TMS pulse. The novelty of the proposed system is that we not only show the connections that may be affected by the TMS pulse, but also at the same time, we color code the connections with respect to previously known performance of parameter combinations on the ROC curve. By taking into account the uncertainty in the accuracy of fiber tracking, our approach helps the TMS operator to better interpret streamlines.
Method
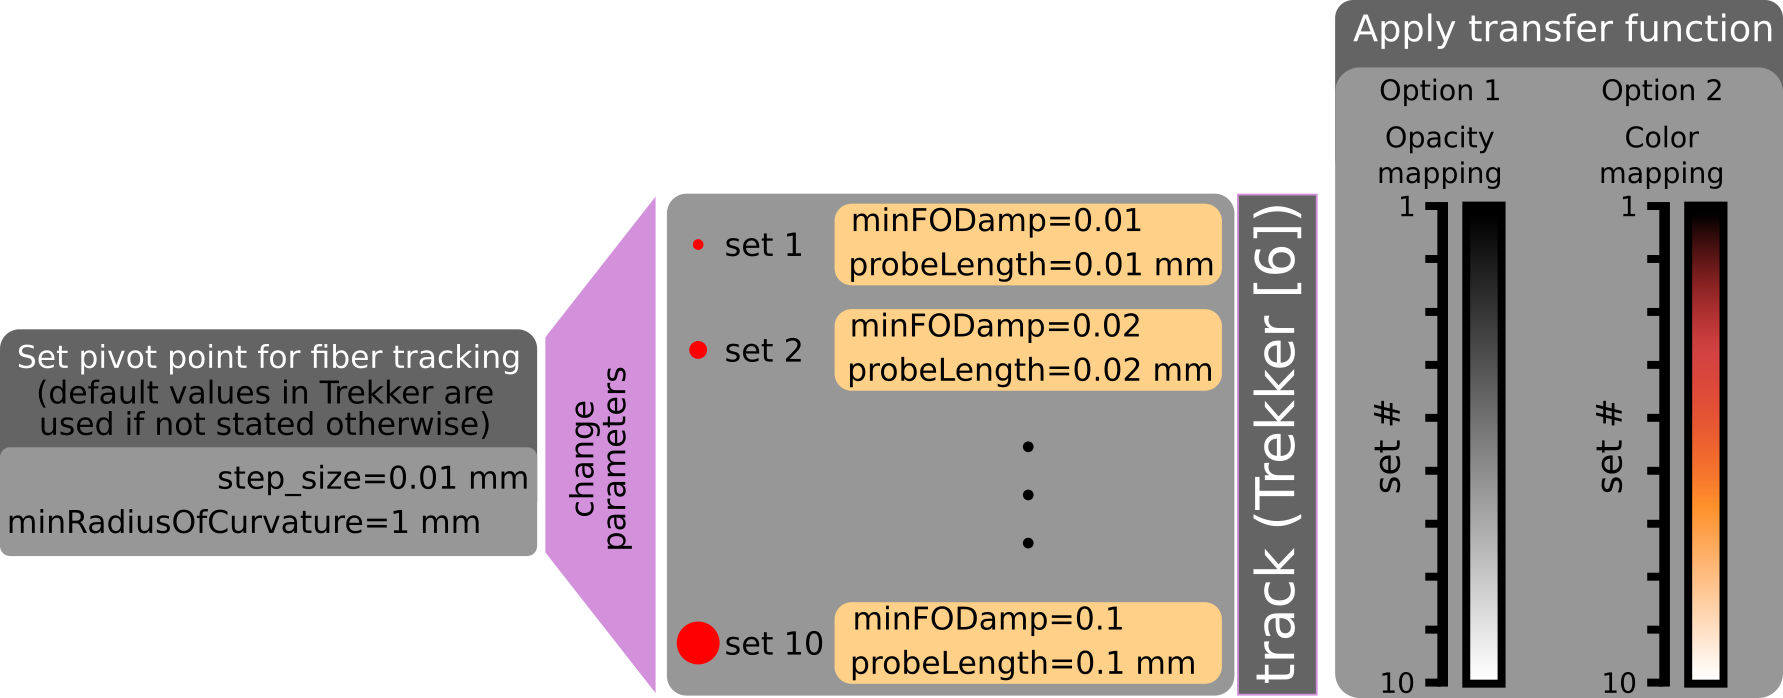
We propose to use transfer functions that map each streamline a color or opacity/transparency value based on the fiber tracking parameter used to obtain that streamline. To that end, we make use of prior knowledge of ROC curves that provide information about previously known performance of tracking parameter combination choices, e.g., it is shown in [5] that when pivoting around a parameter combination, decreasing the FOD threshold leads to more false positives (increased amount of connections that do not exist), whereas increasing it leads to more false negatives (increased amount of actual connections that are missed). Similar trends exist for other parameters as well.Fig.1 shows the overall pipeline for the proposed system to guide the TMS operator with structural connectivity of the brain in real-time. Streamlines are continuously updated and displayed with respect to the affected area by the TMS pulse that is estimated based on the location of the TMS coil. Fig.2 shows two transfer functions that we use for the visualization of streamlines and corresponding tracking parameter combinations. Tractography is done using an in-house, customized, version of Trekker that implements a state-of-the-art probabilistic fiber tracking algorithm based on parallel transport frames [6]. Parameter combinations used for tracking are determined with experiments on the ISMRM 2015 tractography challenge dataset [2].
Results and discussion
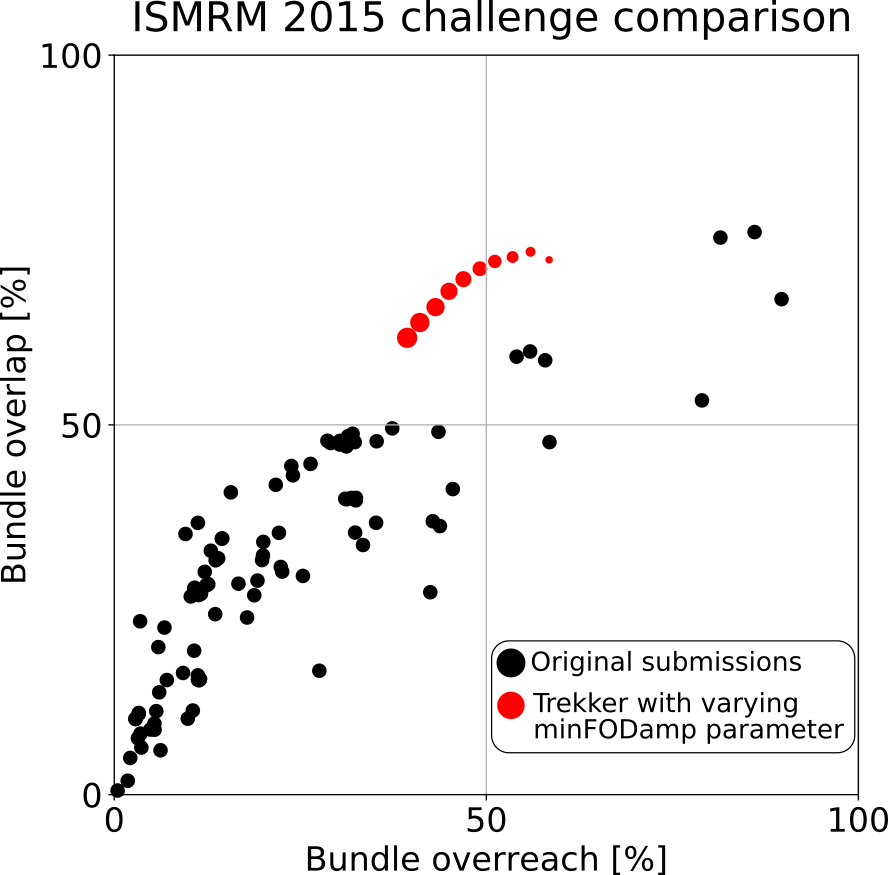
Fig.3 shows results obtained by varying parameters which smoothly traverse the ROC curve. It also shows that the choice for the default pivot point as well as the ranges for parameters score highly competitive against other submissions in the ISMRM 2015 challenge.For our real-time experiments, data from a healthy male (age 37) is acquired and processed using the pipeline shown in Fig.1. Fig.4 shows side-by-side visual comparison of the proposed uncertainty visualization method against the case where it is not used. The neighborhood of the shown stimulation location (the red dot) is a commonly used region in TMS-based speech mapping applications for neurosurgical planning [7]. Results are shown both using opacity and color mapping approaches. Tracks that are more likely to be false positives are easily recognizable by the operator with both approaches.
Our tracking approach is related to ensemble tractography [8], where streamlines obtained with different parameters are combined together. In our visualization technique, however, we additionally treat streamlines differently based on how they are obtained.
Conclusion
While our approach does not solve tractography’s false negative and false positive problems, in contrast to using a single parameter combination choice and a single color mapping scheme for all streamlines, the proposed method offers a more reliable way to use fiber tracking for TMS applications. Furthermore, our approach provides a quick, easy and intuitive way for the TMS operator to visually make judgments about the streamlines in real-time.Acknowledgements
References
[1] Thomas C, Ye FQ, Irfanoglu MO, Modi P, Saleem KS, Leopold DA, et al. Anatomical accuracy of brain connections derived from diffusion MRI tractography is inherently limited. PNAS. 2014 Nov 18;111(46):16574–9.
[2] Maier-Hein KH, Neher PF, Houde J-C, Côté M-A, Garyfallidis E, Zhong J, et al. The challenge of mapping the human connectome based on diffusion tractography. Nat Commun. 2017 Nov 7;8(1):1–13.
[3] Nath V, Schilling K, Parvathaneni P, Hainline AE, Huo Y, Blaber JA, et al. Tractography Reproducibility Challenge with Empirical Data (TraCED): The 2017 ISMRM Diffusion Study Group Challenge. bioRxiv. 2018 Dec 3;484543.
[4] Schilling KG, Nath V, Hansen C, Parvathaneni P, Blaber J, Gao Y, et al. Limits to anatomical accuracy of diffusion tractography using modern approaches. NeuroImage. 2019 Jan 15;185:1–11.
[5] Aydogan DB, Jacobs R, Dulawa S, Thompson SL, Francois MC, Toga AW, et al. When tractography meets tracer injections: a systematic study of trends and variation sources of diffusion-based connectivity. Brain Struct Funct. 2018 Jul 1;223(6):2841–58.
[6] Aydogan DB, Shi Y. A novel fiber tracking algorithm using parallel transport frames. ISMRM 2019, Montreal.
[7] Lioumis P, Zhdanov A, Mäkelä N, Lehtinen H, Wilenius J, Neuvonen T, et al. A novel approach for documenting naming errors induced by navigated transcranial magnetic stimulation. Journal of Neuroscience Methods. 2012 Mar 15;204(2):349–54.
[8] Takemura H, Caiafa CF, Wandell BA, Pestilli F. Ensemble Tractography. PLOS Computational Biology. 2016 Feb 4;12(2):e1004692.
[9] Veraart J, Novikov DS, Christiaens D, Ades-aron B, Sijbers J, Fieremans E. Denoising of diffusion MRI using random matrix theory. NeuroImage. 2016 Nov 15;142:394–406.
[10] Kellner E, Dhital B, Kiselev VG, Reisert M. Gibbs-ringing artifact removal based on local subvoxel-shifts. Magnetic Resonance in Medicine. 2016 Nov 1;76(5):1574–81.
[11] Andersson JLR, Sotiropoulos SN. An integrated approach to correction for off-resonance effects and subject movement in diffusion MR imaging. NeuroImage. 2016 Jan 15;125:1063–78.
[12] Smith SM. Fast robust automated brain extraction. Human Brain Mapping. 2002;17(3):143–55.
[13] Tran G, Shi Y. Adaptively constrained convex optimization for accurate fiber orientation estimation with high order spherical harmonics. Med Image Comput Comput Assist Interv. 2013;16(Pt 3):485–92.
[14] Tustison NJ, Avants BB, Cook PA, Zheng Y, Egan A, Yushkevich PA, et al. N4ITK: improved N3 bias correction. IEEE Trans Med Imaging. 2010 Jun;29(6):1310–20.
Figures