1801
Glial changes induced by lipopolysaccharide inflammatory challenge in humans detected with diffusion-weighted MRS1Department of Radiology, Leiden University Medical Center, Leiden, Netherlands, 2Centre for NeuroImaging Research - CENIR, Brain and Spine Institute - ICM, Paris, France, 3Department of Neuroscience, Brighton and Sussex Medical School, University of Sussex, Brighton, United Kingdom, 4Cardiff University Brain Research Imaging Centre (CUBRIC), School of Medicine, Cardiff University, Cardiff, United Kingdom
Synopsis
Neuroinflammation is a pathomechanism implicated in several neruological, neurodegenerative and psychiatric disorders and is expressed in activation of microglia, the resident brain macrophages. Currently the only neuroimaging method for detecting microglial activation is PET with translocator protein (TSPO) ligands. A well-known model of experimentally inducing systemic inflammation is the administration of lipopolysaccharides (LPS). Here we report a significant increase in the apparent diffusion coefficient of the glial metabolite choline (tCho) in the human thalamus, following injection of LPS. This finding suggests that the ADC(tCho) is a putative marker for glial activation and may be useful in measuring neuroinflammation in disease.
Introduction
Several neurological diseases and mental illnesses, notably schizophrenia, major depression, and Alzheimer's disease, have been linked to inflammation and altered immune function, and more specifically actions of ‘activated’ microglia, the principal immune cell in the brain1. During systemic inflammation, microglia undergo a temporary change in shape and function. This shift from a ‘resting’ to an ‘activated’ state is associated with release of pro-inflammatory proteins that can disrupt the function of surrounding neurons2,3. Translocator Protein (TSPO) PET is the current gold-standard for imaging activated microglia in-vivo4. However, it is hampered by poor specificity, expense and limited availability. Unlike PET, Diffusion-weighted (DW)-MRS5 does not rely on radiotracer administration and has the advantage of being acquired with other routine MR images. DW-MRS measures the apparent diffusion coefficient (ADC) of metabolites, thus providing cell-specific information about cellular morphology. As such, DW-MRS is sensitive to cell-specific morphological changes in disease, particularly in the central nervous system, where metabolites are differentially expressed across cell types6. Of the most commonly measured metabolites, N-Acetyl-aspartate (NAA) resides exclusively in neurons, total creatine (tCr) in both neural and glial cells, while total choline (tCho) is predominantly found in glia. It is therefore conceivable that ADC(tCho) is sensitive to changes in glial morphology. In line with this hypothesis, an increase in ADC(tCho) was recently shown to correlate with disease activity scores in neuropsychiatric systemic lupus erythematosus, an inflammatory autoimmune disease7. Here we used a lipopolysaccharide (LPS) challenge, a widely used paradigm for glial activation in vitro and in vivo but rarely in humans8, to cause a peripheral immune response in healthy volunteers. We measured the changes induced in metabolite ADC due to the LPS challenge to test the hypothesis that ADC(tCho) is selectively affected as a result of microglial activation.Methods
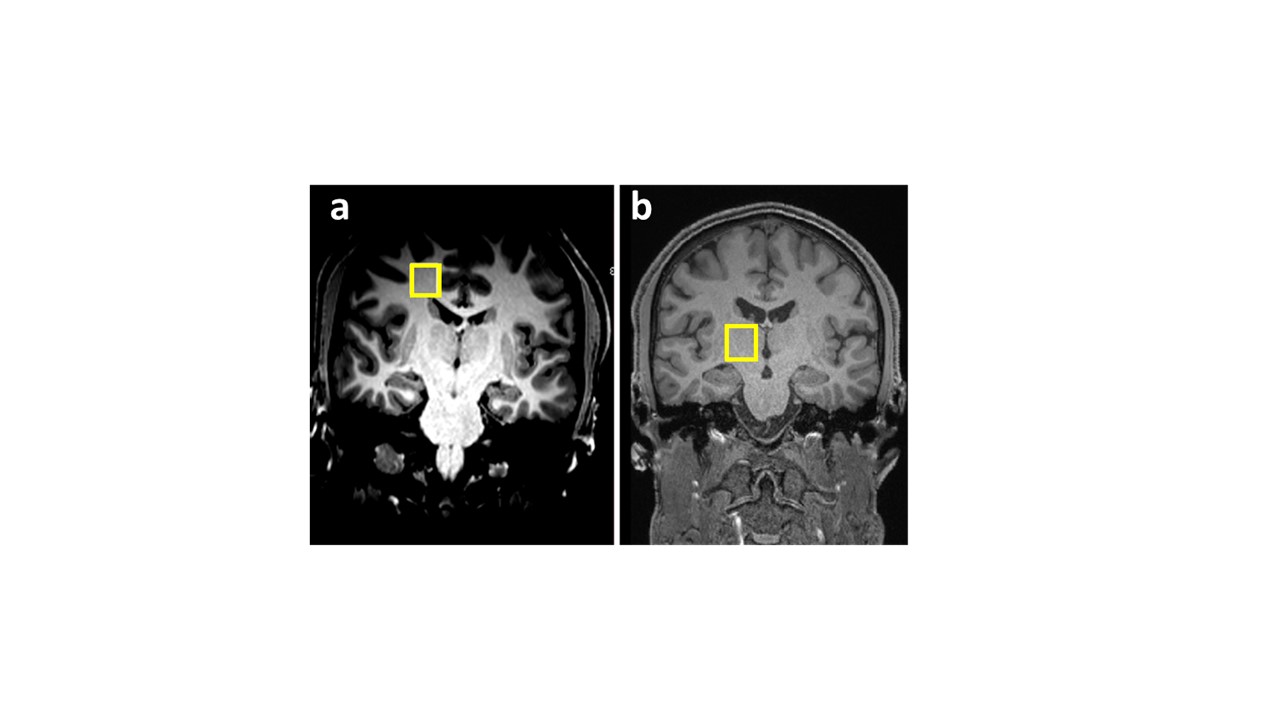
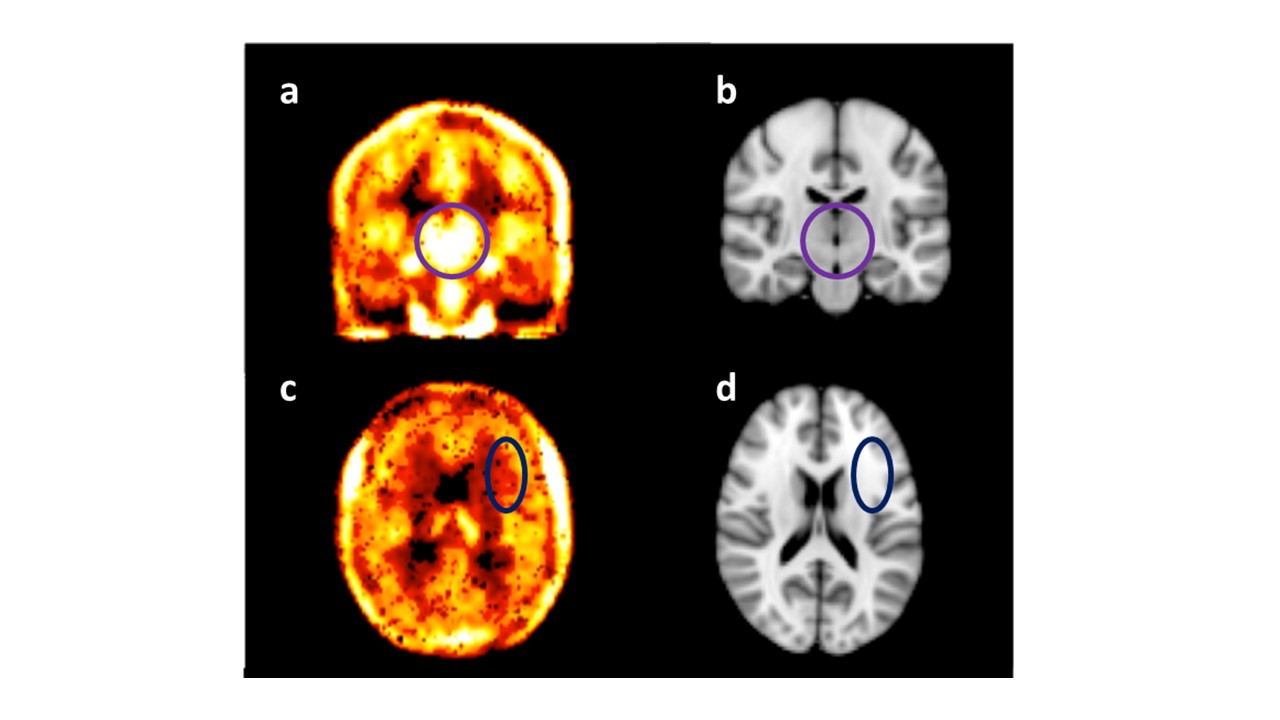
Data were collected from 7 healthy male volunteers, 26±6 years of age. All subjects received an intravenous injection of either LPS (1ng/Kg) or saline (placebo control) in random order on two separate sessions. Serial blood samples were taken to measure peripheral inflammatory markers, and leucocyte subsets and the Profile of Mood States (POMS) to monitor mood change hourly until 6 hours after injection. During each session patients underwent a 60 minute DPA-714 TSPO PET scan followed by MRI. DW-MRS was acquired approximately 5-5½ hours after injection. Data were collected from two 4.5cc volumes of interest (VOI) (Figure 1). One VOI was positioned in the thalamus, a brain structure that shows high uptake levels of DPA-714 (Figure 2) and is susceptible to peripheral inflammation9,10 and the other in the corona radiata, white matter (low DPA-714 uptake) as a control region. The DW-MRS sequence used was a bipolar sequence based on sLASER. TE/TR=100ms/5s. Diffusion weighting conditions: one at b=0 s/mm2 and three spectra taken at b=3823 s/mm2 with gradients in three orthogonal directions; NSA=32 for each condition. A short (NSA=4) scan without water suppression was performed for eddy current correction. Individual spectroscopic data were phase/frequency corrected and averaged per condition. Spectral analyses were performed with linear prediction singular value decomposition (LPSVD) analysis using Matlab (Mathworks, Natick MA, USA), and the peak area estimates were used for ADC calculation. The spectra at b=0 were used to estimate relative tCho and tNAA concentrations, expressed as the ratio between their peak area to the tCr peak area. The ADC of the three metabolites as well as [tCho]/[tCr] and [tNAA]/[tCr] were compared between sessions (LPS vs placebo) using a paired-sample t-test. The association between changes in ADC(tCho) and changes in mood (POMS) were assessed using Pearson’s correlation coefficient.Results
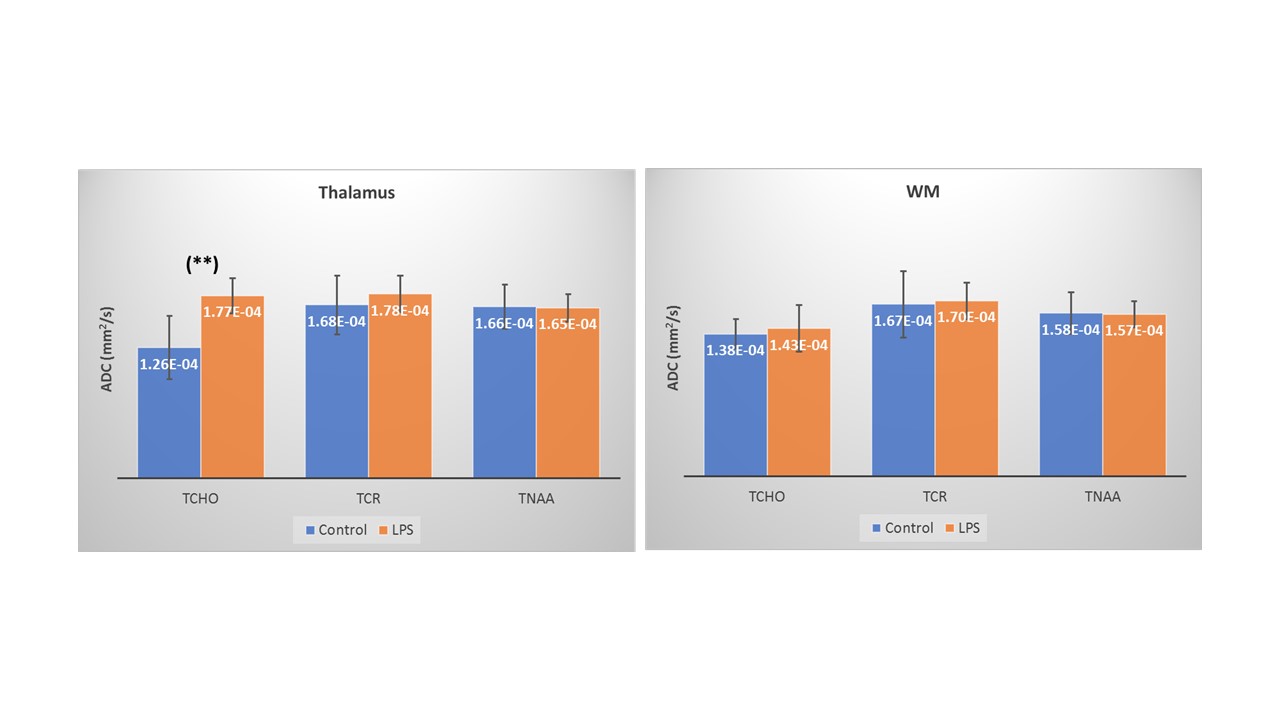
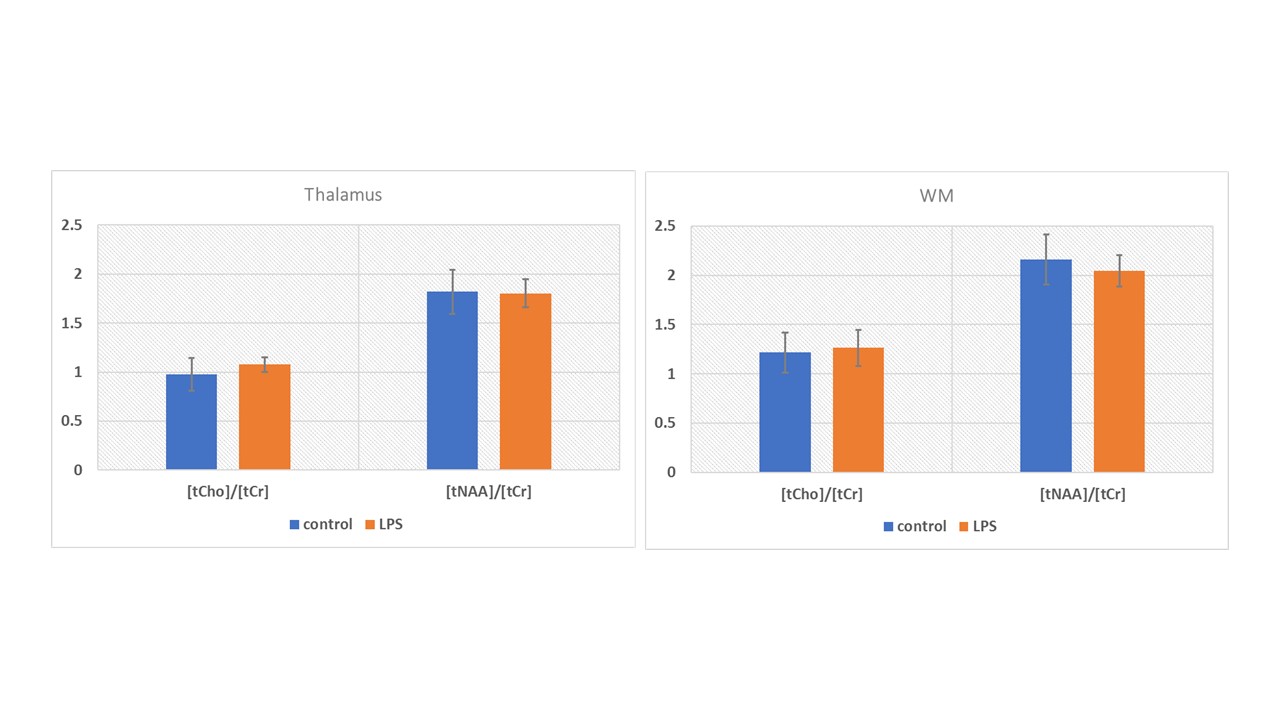
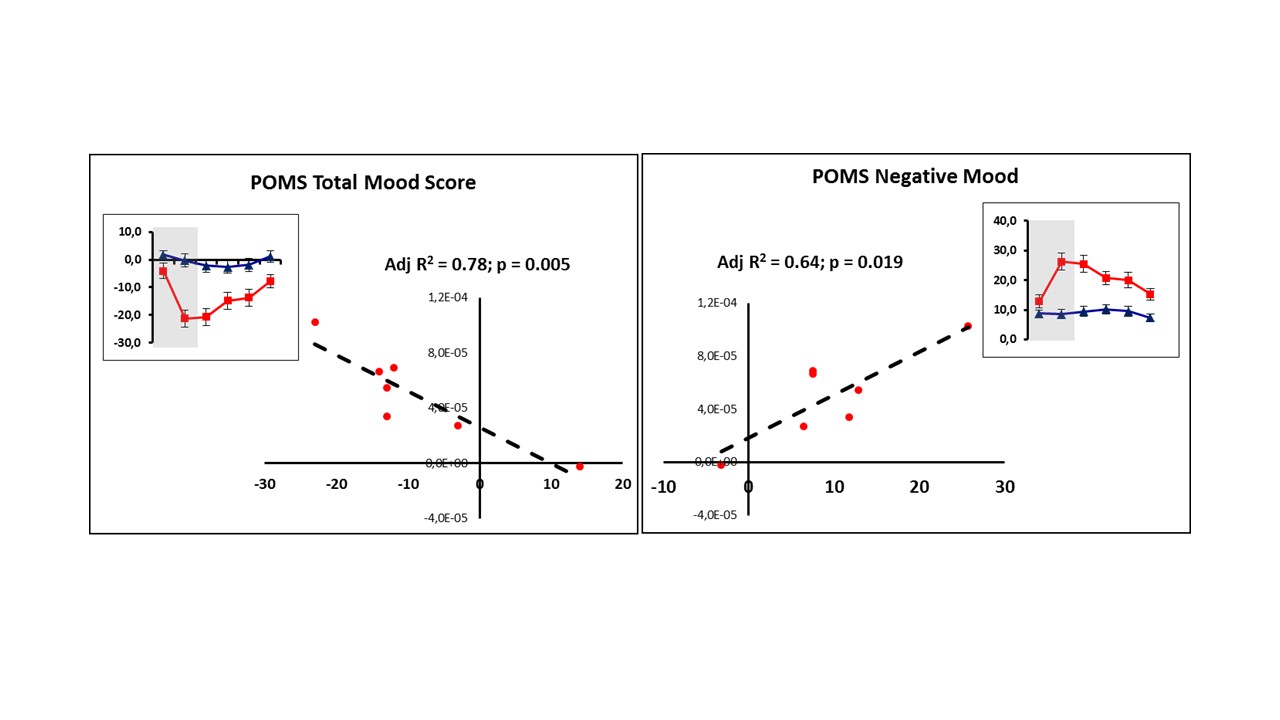
Figure 3 shows the mean metabolite ADC for the thalamus and WM VOIs, for both sessions. Paired t-test revealed a significant increase in ADC(tCho) in the thalamus for the LPS condition (p=0.008). No significant difference was detected in ADC(tCho) in the WM between the two conditions. ADC(tNAA) and ADC(tCr) did not differ significantly between conditions in both VOIs. No significant differences in [tCho]/[tCr] or in [tNAA]/[tCr] were observed in either VOI between conditions (Figure 4). LPS-induced changes in POMS total and negative mood were significantly associated with changes in ADC(tCho) of the thalamus (Adj R2 = 0.78; p = 0.005 and Adj R2 = 0.64; p = 0.019, respectively) – see Figure 5.Discussion and Conclusions
The significant increase in ADC(tCho) but not ADC(tNAA) or ADC(tCr) suggests that peripheral LPS challenge selectively affects human microglial and/or astrocytic cytomorphology. In contrast to effects in mice, LPS does not appears to activate human astrocytes11, implying that the effect we measured is rooted in microglial activation. In-vitro NMR measurements on LPS-activated human microglia do not report a significant increase in tCho concentration12. Spectra shown in the same report suggest that [tCho] in microglia is significantly higher than e.g. [tCr]. This may explain why despite the low total microglial volume, microglial tCho may be responsible for the effects reported here. These encouraging findings imply that ADC(tCho) is a unique marker for microglial activation in humans. Future work will involve validation through correlations of the DW-MRS data with TSPO-PET data we obtained from the same subjects.Acknowledgements
We thank Gosia Marjanska and Eddie Auerbach from the Center for Magnetic Resonance Research, University of Minnesota, for generously letting us use their DW-MRS sequences on the Siemens platform.
We would like to thank Dr Anthony Suffredini and the National Institutes of Health for making freely available the Clinical Center Reference Endotoxin employed in this study.
References
- Graeber MB, Streit WJ. Microglia: biology and pathology. Acta Neuropathol 2010;119(1):89-105. doi: 10.1007/s00401-009-0622-0
- Laskaris LE, Di Biase MA, Everall I, et al. Microglial activation and progressive brain changes in schizophrenia. British journal of pharmacology 2016;173(4):666-80. doi: 10.1111/bph.13364 [published Online First: 2015/10/13]
- Mosher KI, Wyss-Coray T. Microglial dysfunction in brain aging and Alzheimer's disease. Biochem Pharmacol 2014;88(4):594-604. doi: 10.1016/j.bcp.2014.01.008 S0006-2952(14)00032-X [pii] [published Online First: 2014/01/22]
- Best L, Ghadery C, Pavese N, et al. New and Old TSPO PET Radioligands for Imaging Brain Microglial Activation in Neurodegenerative Disease. Curr Neurol Neurosci Rep 2019;19(5):24. doi: 10.1007/s11910-019-0934-y [published Online First: 2019/04/04]
- Palombo M, Shemesh N, Ronen I, et al. Insights into brain microstructure from in vivo DW-MRS. Neuroimage 2017 doi: 10.1016/j.neuroimage.2017.11.028
- Choi JK, Dedeoglu A, Jenkins BG. Application of MRS to mouse models of neurodegenerative illness. NMR Biomed 2007;20(3):216-37. doi: 10.1002/nbm.1145
- Ercan E, Magro-Checa C, Valabregue R, et al. Glial and axonal changes in systemic lupus erythematosus measured with diffusion of intracellular metabolites. Brain 2016;139(Pt 5):1447-57. doi: 10.1093/brain/aww0311 [pii] [published Online First: 2016/03/13]
- Sandiego CM, Gallezot JD, Pittman B, et al. Imaging robust microglial activation after lipopolysaccharide administration in humans with PET. Proc Natl Acad Sci U S A 2015;112(40):12468-73. doi: 10.1073/pnas.1511003112 [published Online First: 2015/09/20]
- Critchley HD, Harrison NA. Visceral influences on brain and behavior. Neuron 2013;77(4):624-38. doi: 10.1016/j.neuron.2013.02.008 [published Online First: 2013/02/27] 1
- Dowell NG, Cooper EA, Tibble J, et al. Acute Changes in Striatal Microstructure Predict the Development of Interferon-Alpha Induced Fatigue. Biol Psychiatry 2016;79(4):320-8. doi: 10.1016/j.biopsych.2015.05.015 [published Online First: 2015/07/15]
- Tarassishin L, Suh HS, Lee SC. LPS and IL-1 differentially activate mouse and human astrocytes: role of CD14. Glia 2014;62(6):999-1013. doi: 10.1002/glia.22657 [published Online First: 2014/03/25]
- El Ghazi I, Sheng WS, Hu S, et al. Changes in the NMR metabolic profile of human microglial cells exposed to lipopolysaccharide or morphine. J Neuroimmune Pharmacol 2010;5(4):574-81. doi: 10.1007/s11481-010-9197-8 [published Online First: 2010/03/25]
Figures