1797
The impact of cerebrocortical-cerebellar loops on brain dynamics in simulations using The Virtual Brain1Department of Brain and Behavioural Sciences, University of Pavia, Pavia, Italy, 2Department of Neurology with Experimental Neurology, Charité – Universitätsmedizin Berlin, Berlin, Germany, 3Institut de Neurosciences des Systèmes - Inserm UMR1106, Aix-Marseille Université, Marseille, France, 4NMR Research Unit, Queen Square MS Centre, Department of Neuroinflammation, UCL Institute of Neurology, London, United Kingdom, 5IRCCS Mondino Foundation, Pavia, Italy
Synopsis
The Virtual Brain(TVB) has been developed to simulate brain dynamics starting from individual structural and functional connectivity(FC) MRI data. Nowadays, only cerebrocortical circuits have been considered. Here, we provided the first TVB simulations including cerebellar nodes on single-subject datasets. The brain dynamics simulated by either including or excluding cerebrocortical-cerebellar connectivity were compared, revealing that the predictive power of empirical FC is not significantly modified by inclusion of cerebro-cerebellar loops. To improve the present results and apply this pipeline to predict disease states involving cerebrocortical-cerebellar loops, specific neural mass models accounting for cerebellar microcircuit physiology need to be integrated in TVB.
Introduction
The activity of several interconnected networks contributes to generate global brain dynamics. In some of these networks, the cerebral cortex is wired through major fiber tracts with the cerebellum forming cerebrocortical-cerebellar loops1. However, the impact of these long-range connections on global brain dynamics remains unclear. The relationship between brain structure, function and dynamics can be investigated using appropriate experimental and modeling approaches. In humans non-invasive MRI measurements are key. Diffusion MRI (dMRI) can be used to generate the brain connectome by diffusion tractography, while functional MRI (fMRI) provides information on how the activity of different brain regions correlates on very-low frequency bands, both at rest2,3 and during tasks4. Recently, a comprehensive modeling framework making use of these data, The Virtual Brain (TVB)5,6, has been developed to simulate whole-brain dynamics. In TVB, brain regions are remapped onto functional nodes (i.e. neuronal masses) wired through individual connectomes from single-subject dMRI. The simulations are compared to empirical fMRI data for multiparametric matching. A few studies have used TVB to simulate physiological brain states and neurological disorders, such as epilepsy7, but only cerebrocortical circuits have been considered. Here, we introduced and wired cerebellar nodes into TVB and provided the first simulations based on single-subject MRI datasets. Brain spatio-temporal dynamics including or excluding the cerebrocortical-cerebellar connectivity were compared.Methods
SubjectsFive subjects (1/4 male/female; 22-35 years) acquired using a Siemens 3T Connectome Skyra scanner were included. Pre-processed 3DT1-weighted images (0.7mm isotropic resolution resampled at 1.25mm), high-quality diffusion weighted data (1.25mm isotropic resolution, b=1000,2000,3000s/mm2, 90 isotropically distributed directions/shell and 18 b0 images) and resting state fMRI (rs-fMRI) (2mm isotropic resolution, TR/TE=720/33.1ms, 1200 volumes) were downloaded from the ConnectomeDB (http://db.humanconnectome.org)8.
Definition of structural connectivity (SC)
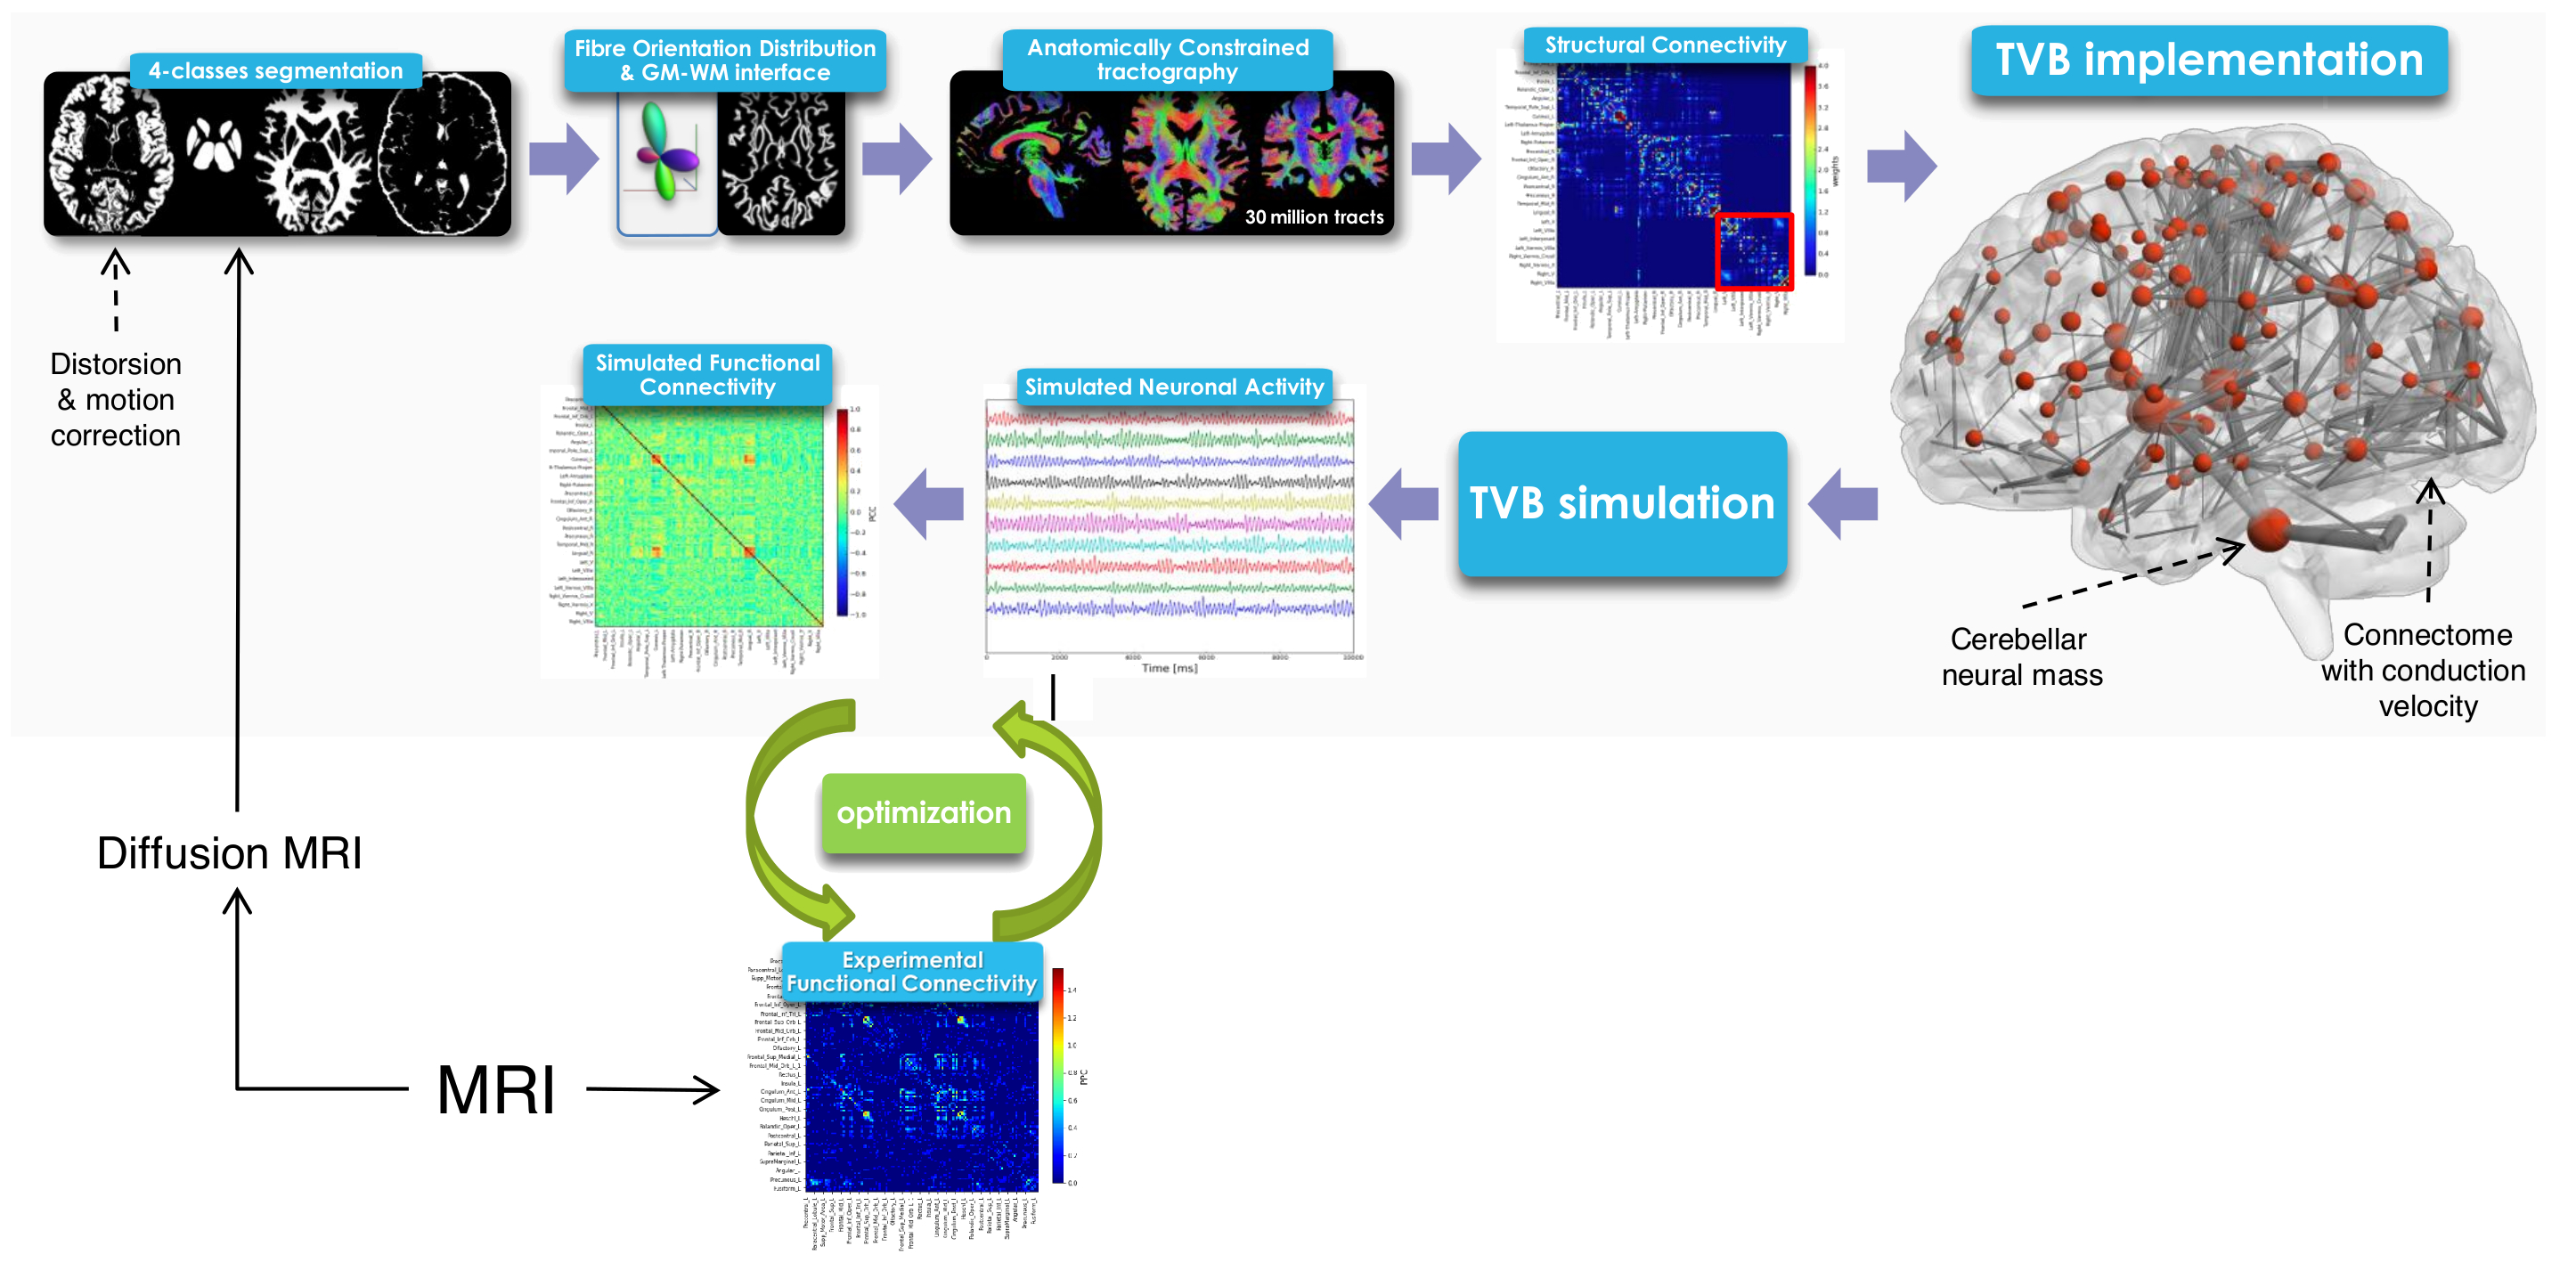
3DT1-weighted images were segmented (FSL, https://fsl.fmrib.ox.ac.uk/fsl/fslwiki) as white matter, gray matter (GM), subcortical GM, and cerebrospinal fluid. 30 million streamlines whole-brain Anatomically-Constrained Tractography9 was performed (MRtrix3, http://www.mrtrix.org/) calculating fibre orientation distributions (multi-shell multi-tissue CSD)10 and using probabilistic streamline tractography11. An ad-hoc atlas comprising of 133 regions was created combining 93 cerebral, including cortical and deep GM structures (Automated Anatomical Labeling12), and 40 cerebellar (SUIT13) labels. Applying the parcellation to the whole-brain tractography we obtained the SC matrix with number of streamlines as edges and cortical/subcortical labels as nodes (Figure1). The weight assigned to each connection was normalized respect to the total number of streamlines. SC was calculated both including and excluding cerebellar connections.
Definition of functional connectivity (FC)
rs-fMRI data were preprocessed, realigned to the MNI152 template and noise components were identified and removed (FIX, FSL)14. The average time-course was extracted for each node from REST1 and a FC matrix was evaluated correlating (Fisher z-transformed coefficient) time-courses between pair of nodes using CONN (http://www.nitrc.org/projects/conn). This FC matrix was thresholded at 0.1206 to obtain the final experimental FC (eFC) matrix, calculated both including and excluding cerebellar regions.
TVB simulation
The SC matrix was used to define the long-range connectivity of the brain and to create a subject specific “avatar”. A reduced Wong-Wang model15 was chosen to generate the mean activity of each node. A model inversion approach was used to tune the global coupling (Gcoupl) (Figure2): the optimal Gcoupl was defined as the value for which the correlation between eFC and simulated FC (sFC) presented its maximum. The brain dynamics were simulated for a period of 6 minutes and a specific time-series for each node was provided (Figure1). Pearson correlation coefficient between temporal signals was estimated to calculate a sFC matrix.
Statistics
Similarity measures were used to assess the coherence between eFC-sFC both for cerebrocortical-cerebellar and cerebrocortical matrices. Correlation coefficient between SC and FC (both eFC and sFC) was also calculated for completeness. A two samples t-test was performed to assess significant differences.
Results
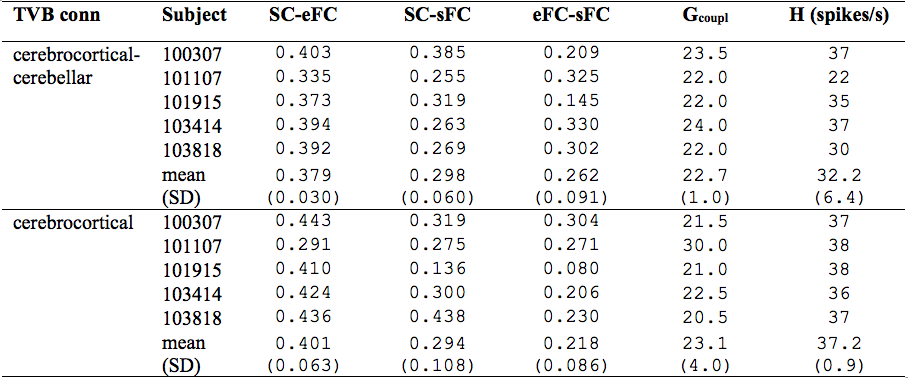
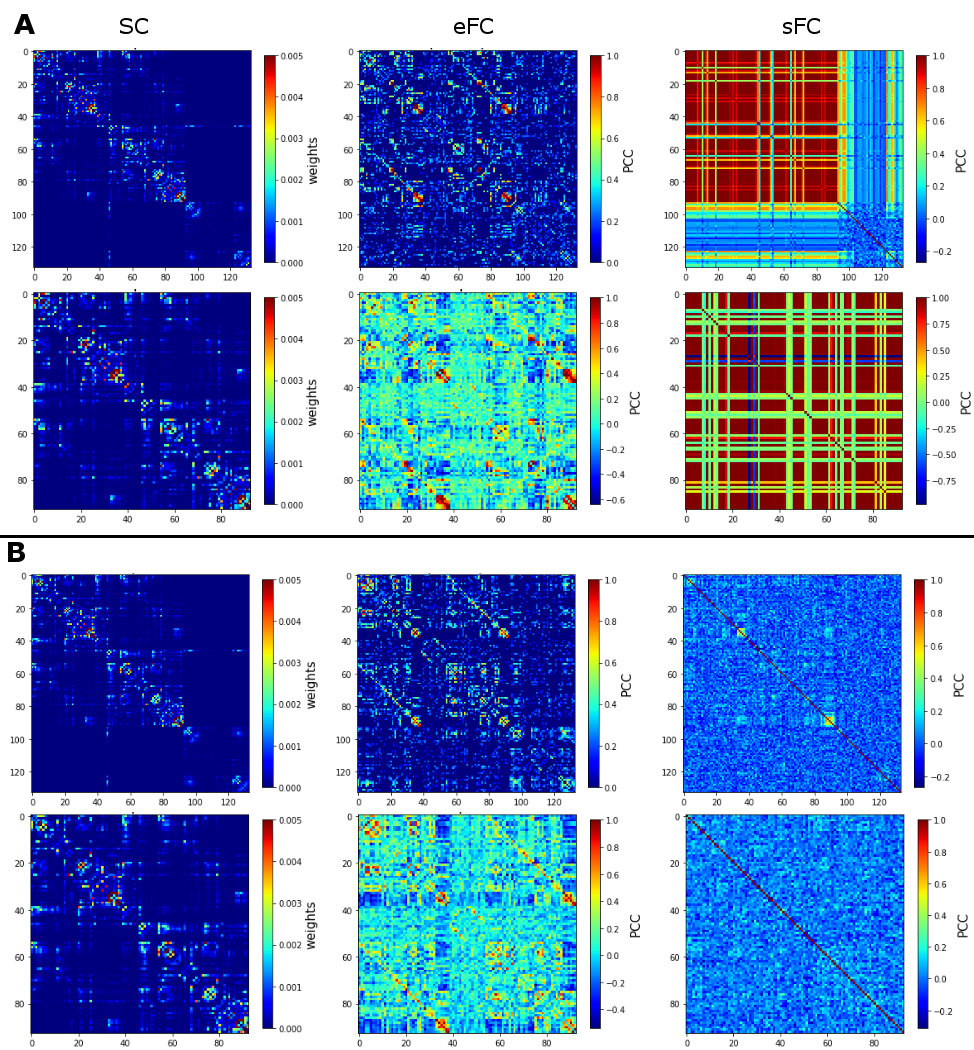
Similarity measures between eFC-sFC and SC-sFC, Gcoupl, and the firing rate (H) for cerebrocortical-cerebellar TVB and cerebrocortical TVB are reported in Table1. The average correlation eFC-sFC was 0.262±0.091 for cerebrocortical-cerebellar activity and 0.218±0.086 for cerebrocortical activity. No significant differences were found as reported in Table2. An example of SC, eFC and sFC is given in Figure3 for the best and the worst coherence between eFC and sFC.Discussion
This work provides the first extension of TVB including cerebellar nodes and cerebrocortical-cerebellar connectivity. In principle, the inclusion of cerebrocortical-cerebellar connections would achieve a more exhaustive and improved understanding of cerebral processing. Our preliminary findings demonstrated that the prediction power of eFC is not significantly modified by the inclusion of cerebrocortical-cerebellar loops. A consideration is that the cerebellum microcircuit organization is quite different from that of the cerebral cortex and therefore the Wong-Wang model may not be adequate. In particular, specific neural masses reflecting the cerebellar microcircuit physiology need to be developed and integrated in TVB. Further analysis will also need to consider internal neural mass parameters and neural dynamics in clusters of nodes formed by specific resting-state networks involving the cerebellum. Once these neural masses will be fully integrated in TVB, the pipeline presented here could be consistently applied to single patients to predict the progression of neurodegenerative pathologies or to predict surgical outcomes, for example, in epileptic patients.Acknowledgements
Data were provided by the Human Connectome Project, WU-Minn Consortium (PI: David Van Essen and Kamil Ugurbil; 1U54MH091657). This project receives funding from the European Union’s Horizon 2020 Research and Innovation under Grant Agreement (No. 785907, 634541), UCL-UCLH Biomedical Research Centre (UK), Spinal Research (UK), Wings for Life (Austria), Craig H. Neilsen Foundation (USA) (jointly funding the INSPIRED study), Wings for Life (#169111), the UK Multiple Sclerosis Society (grants 892/08 and 77/2017).References
1. Palesi F, Rinaldis A De, Castellazzi G, et al. Contralateral cortico-ponto-cerebellar pathways reconstruction in humans in vivo: implications for reciprocal cerebro-cerebellar structural connectivity in motor and non-motor areas. Sci Rep [online serial]. Springer Nature; 2017;7:12841. Accessed at: https://doi.org/10.1038%2Fs41598-017-13079-8.
2. Buckner RL. The cerebellum and cognitive function: 25 years of insight from anatomy and neuroimaging. Neuron [online serial]. Elsevier Inc.; 2013;80:807–815. Accessed at: http://dx.doi.org/10.1016/j.neuron.2013.10.044.
3. Castellazzi G, Bruno SD, Toosy AT, et al. Prominent Changes in Cerebro-Cerebellar Functional Connectivity During Continuous Cognitive Processing. Front Cell Neurosci [online serial]. 2018;12:1–15. Accessed at: https://www.frontiersin.org/article/10.3389/fncel.2018.00331/full.
4. Gross J, Kujala J, Hamalainen M, Timmermann L, Schnitzler A, Salmelin R. Dynamic imaging of coherent sources: Studying neural interactions in the human brain. Proc Natl Acad Sci USA. 2001;98:694–699.
5. Sanz Leon P, Knock SA, Woodman MM, et al. The Virtual Brain: a simulator of primate brain network dynamics. Front Neuroinform. 2013;7:1–23.
6. Ritter P, Schirner M, Mcintosh AR, Jirsa VK. The Virtual Brain Integrates Computational Modeling. Brain Connect. 2013;3:121–145.
7. An S, Bartolomei F, Guye M, Jirsa V. Optimization of surgical intervention outside the epileptogenic zone in the Virtual Epileptic Patient (VEP). PLoS Comput Biol. 2019;15:e1007051.
8. Van Essen DC, Smith SM, Barch DM, Behrens TEJ, Yacoub E, Ugurbil K. The WU-Minn Human Connectome Project: An overview. Neuroimage [online serial]. Elsevier Inc.; 2013;80:62–79. Accessed at: http://dx.doi.org/10.1016/j.neuroimage.2013.05.041.
9. Smith RE, Tournier J-D, Calamante F, Connelly A. Anatomically-constrained tractography: improved diffusion MRI streamlines tractography through effective use of anatomical information. Neuroimage [online serial]. Elsevier Inc.; 2012;62:1924–1938. Accessed at: http://www.ncbi.nlm.nih.gov/pubmed/22705374. Accessed March 24, 2014.
10. Jeurissen B, Tournier JD, Dhollander T, Connelly A, Sijbers J. Multi-tissue constrained spherical deconvolution for improved analysis of multi-shell diffusion MRI data. Neuroimage [online serial]. Elsevier Inc.; 2014;103:411–426. Accessed at: http://dx.doi.org/10.1016/j.neuroimage.2014.07.061.
11. Tournier J-D, Calamante F, Connelly A. Improved probabilistic streamlines tractography by 2 nd order integration over fibre orientation distributions. Proc Int Soc Magn Reson Med. 2010. p. 1670.
12. Tzourio-Mazoyer N, Landeau B, Papathanassiou D, et al. Automated anatomical labeling of activations in SPM using a macroscopic anatomical parcellation of the MNI MRI single-subject brain. Neuroimage. 2002;15:273–289.
13. Diedrichsen J, Balsters JH, Flavell J, Cussans E, Ramnani N. A probabilistic MR atlas of the human cerebellum. Neuroimage [online serial]. 2009;46:39–46. Accessed at: http://www.ncbi.nlm.nih.gov/pubmed/19457380. Accessed June 25, 2011.
14. Griffanti L, Salimi-Khorshidi G, Beckmann CF, et al. ICA-based artefact removal and accelerated fMRI acquisition for improved resting state network imaging. Neuroimage. 2014;95:232–247.
15. Wong KF, Wang XJ. A recurrent network mechanism of time integration in perceptual decisions. J Neurosci. 2006;26:1314–1328.
Figures